Prediction of Anxiety and Depression among the Transgender in Bangladesh
by
Ishrat Jahan Easha 18101356
Fairooz Afnad Faiza 18101367
Mohammad Rafiuddin Sadique 17201011
Fatima Tabassum 18101439 Md. Rakib Uddin
17101254
A thesis submitted to the Department of Computer Science and Engineering in partial fulfillment of the requirements for the degree of
B.Sc. in Computer Science
Department of Computer Science and Engineering Brac University
May 2022
© 2022. Brac University All rights reserved.
Declaration
It is hereby declared that
1. The thesis submitted is my/our own original work while completing degree at Brac University.
2. The thesis does not contain material previously published or written by a third party, except where this is appropriately cited through full and accurate referencing.
3. The thesis does not contain material which has been accepted, or submitted, for any other degree or diploma at a university or other institution.
4. We have acknowledged all main sources of help.
Student’s Full Name & Signature:
Ishrat Jahan Easha
18101356 Fairooz Afnad Faiza
18101367
Mohammad Rafiuddin Sadique
17201011 Fatima Tabassum
18101439
Md. Rakib Uddin 17101254
Approval
The thesis titled “Prediction of Anxiety and Depression among the Transgender in Bangladesh” submitted by
1. Ishrat Jahan Easha(18101356) 2. Fairooz Afnad Faiza(18101367)
3. Mohammad Rafiuddin Sadique(17201011) 4. Fatima Tabassum(18101439)
5. Md. Rakib Uddin(17101254)
Of Spring, 2022 has been accepted as satisfactory in partial fulfillment of the re- quirement for the degree of B.Sc. in Computer Science on May 24, 2022.
Examining Committee:
Supervisor:
(Member)
Md. Golam Rabiul Alam, PhD Associate Professor
Department of Computer Science and Engineering Brac University
Head of Department:
(Chair)
Sadia Hamid Kazi, PhD Chairperson and Associate Professor Department of Computer Science and Engineering
Brac University
Abstract
Today, mental health is as important as safety. It affects people directly and indi- rectly. Transgender people with mental health issues are often overlooked and in our nation, especially transgender women, suffer from anxiety, depression, and suicide.
This research examines depression and anxiety prediction. Classification models and NLP are used to detect depression and anxiety in 41 Bangladeshi transgender people. The data came from sociodemographic, victimization, social support, in- terpersonal functioning, depression, anxiety, and self-esteem questionnaires (RSE).
We predicted depression and anxiety in transgender people using culturally adapted depression and anxiety scales and a hybrid questionnaire based on minority and resilience. We conducted interviews, analyzed sentiment with TF-IDF, and con- structed classification algorithms. We extracted and validated questionnaire data using median, SD, and Cronbach alpha. Correlation between two independent vari- ables. Chi-square and ANOVA examined transgender depression, anxiety, and age.
This link was validated using SVM, XGBoost, Naive Bayes, and Logistic Regression where SVM and Naive Bayes had a better accuracy for depression which was 84.6%
and for anxiety SVM gave 76.9%. In the case of NLP linear SVC and Random Forest gave the highest F1 score among others which were 92.30% and 76.92% re- spectively. Using these methods, we determined that depression is comparatively minimal whereas anxiety is severe. This association can be used to minimize the severity of these mental health problems.
Keywords: Mental health; Transgender; Machine Learning; NLP; Prediction; Anx- iety; Depression
Acknowledgement
We would like to express our sincere gratitude to our supervisor Md. Golam Rabiul Alam, PhD sir for his utmost attention and valuable time. We would like to thank him for giving us the opportunity to work on this topic and guiding us throughout the process. We would also like to express our gratitude to Brac University Counseling Unit for providing us the culturally adapted questionnaire for anxiety and depression prediction.
Table of Contents
Declaration i
Approval ii
Abstract iii
Acknowledgment iv
Table of Contents v
List of Figures vii
List of Tables viii
1 Overview 1
1.1 Introduction . . . 1
1.2 Research Objectives . . . 1
1.3 Literature Review . . . 2
2 Methodology & System Structure 5 2.1 System Overview . . . 5
2.2 Dataset . . . 6
2.2.1 Depression Prediction (Uddin & Rahman, 2005) . . . 6
2.2.2 Anxiety Prediction (Diba & Begum, 2004) . . . 8
2.2.3 Hybrid Questionnaire (Depression and Anxiety): . . . 10
2.3 Applied Methods in Statistical Analysis . . . 11
2.3.1 Finding internal consistency via Cronbach Alpha . . . 11
2.3.2 Median & Standard Deviation . . . 12
2.3.3 Pearson Correlation Coefficient . . . 12
2.3.4 Chi-Square Test . . . 13
2.3.5 ANOVA Test . . . 14
2.4 Algorithms and Machine Learning . . . 15
2.4.1 Logistic Regression . . . 16
2.4.2 SVM . . . 16
2.4.3 XGBoost . . . 17
2.4.4 Naive Bayes . . . 17
2.5 Natural Language Processing . . . 18
2.5.1 Tf-IDF & Machine learning Algorithms . . . 19
3 Result & Discussion 20
3.1 Inferential Statistics . . . 20
3.1.1 Cronbach Alpha . . . 20
3.1.2 Median & Standard Deviation . . . 21
3.1.3 Pearson Correlation Coefficient . . . 21
3.1.4 ANOVA test . . . 23
3.2 Experimental Analysis Based on ML and NLP . . . 23
3.2.1 Depression Prediction . . . 24
3.2.2 Anxiety Prediction . . . 24
3.2.3 Sentiment Analysis using NLP . . . 25
4 Conclusion 27 4.1 Conclusion & Future Works . . . 27
Bibliography 29
List of Figures
2.1 Flowchart of ML based Depression & Anxiety Detection Model . . . 5
2.2 Histogram for Depression Prediction Questionnaire . . . 7
2.3 Histogram for Anxiety Prediction Questionnaire . . . 9
2.4 Annotation of General Statement . . . 15
2.5 Dataset Preprocessing Flowchart . . . 19
3.1 Pearson correlation coefficient of Symptoms vs Depression & Anxiety 22 3.2 Accuracy of different algorithms for Depression Prediction . . . 24
3.3 Accuracy of different algorithms for Anxiety Prediction . . . 25
3.4 F1 Scores for different Models . . . 26
List of Tables
2.1 Internal consistency of different alpha values . . . 12
3.1 Internal Consistency for Each of the Variables . . . 20
3.2 Median and Standard deviation of the variables . . . 21
3.3 Chi Square Test Analysis . . . 23
3.4 One-way Non-parametric ANOVA Test Analysis . . . 23
3.5 F1 Scores for different features . . . 25
Chapter 1 Overview
1.1 Introduction
Mental condition is vital to fitness and well-being. It includes emotional, social, and psychological well-being. It affects how we process ideas, handle emotions, manage life, and make decisions. Mental health affects physical health, making it even more important. Without mental health, there is no total health. Psychological and social elements might indicate a person’s mental health. Mental health illnesses may be caused by significant societal changes, sexual assault, an unhealthy lifestyle, gender discrimination, and social isolation. Everyone, from acceptable to neglected gen- ders, has mental health. Transgenders have diverse identities. Transgender persons don’t identify with their birth sex. Mental health concerns both regular genders and the transgender population. Transgender people are routinely overlooked and underestimated, leave alone their mental health. Due to being different, they are discriminated against and confined, resulting in poor mental health or severe men- tal disease. Transgender persons have severe anxiety and despair owing to social isolation and gender discrimination. Transgender persons, especially transgender women, have more mental health concerns than the general population. Transgen- der women had a 62% lifetime prevalence of depression.[5] Depression and anxiety may contribute to transgender women committing suicide. It’s important to address transgender mental health issues including despair and anxiety. We can examine and assess this social issue’s influence on our nation while it persists. Human resource is a key development indicator. Mental health is crucial to the nation’s resource- fulness. Our nation can’t attain its full potential if certain people are confined and mistreated. If we overlook mental stability concerns like depression and anxiety among transgender people, then our country’s progress will be hampered since we won’t get the most from the population.
1.2 Research Objectives
The aim of this research is to investigate and predict depression rates within a group of transgender people in Bangladesh using classification models and NLP.
The data was collected through surveys through questionnaires implementing the sociodemographic variables and measures of victimization (ETS), social support (MSPSS), interpersonal functioning (IIP-32), depression and anxiety (HADS) and self-esteem (RSE). The objectives of this research are:
1. To focus on the role of various characteristics in predicting anxiety and de- pression levels, such as self-esteem, social support, victimization, cross-sex hormone use and interpersonal functioning.
2. To analyze the reliability of the questionnaires and correlation between De- pression & Anxiety using various statistical tests.
3. To implement Supervised Machine Learning models to derive accuracy scores in depression and anxiety scale.
4. To implement Natural Language Processing on the collected data which will enable sentiment analysis of the general statements.
5. To help transgender people have a better life by reducing violence, the likeli- hood of suicide and self-injury, and the use of drugs and substances.
1.3 Literature Review
The authors of[8] looked at the magnitude of mental strength and self-confidence in transgender people in Pakistan. They also looked into socio-demographic aspects that influence their mental health. The data was obtained through self-informant questionnaires and interviews as part of a cross-sectional study outline. Snowball sampling was used to gather samples from 100 transgender people ranging in age from 19 to 50 years old. Finally, the data was evaluated using the Connor-Davidson Resilience Scale (CDRS), and the Self Esteem Scale (SES). The findings indicated that factors such as education and socio-demographic characteristics influenced psy- chological resilience and self-respect among transgender people. 72 percent of the participants had a low to moderate degree, whereas just 28 percent had a high level of psychological resilience. In terms of self-confidence, more than 67 percent had low to moderate levels.
The authors of[9] this study seek to compare transgender and cisgender students’
experiences on several measures. The research was carried out via an online ques- tionnaire process, which was completed by a total of 50,054 Norwegian students, 15,399 of whom were heterosexual males and 34,437 of whom were females. The number of binary participants was 28, with 69 non binary transgender, 12 transgen- der women and 16 transgender men. The questionnaire asked about the individual’s gender identity, loneliness that was scaled in three steps, mental disorder, suicide thoughts and attempts, and how content they were with their lifestyle. Chi-square tests, logistic regression analyses, and Kruskal-Wallis tests were employed in the study. The study discovered that transgender pupils reported much higher psy- chological weight than other participants, and there was no discernible difference between binary and non-binary transgenders.
In study[3] the authors put forward a research comparing transgender persons to the general population. The study’s goals were to evaluate anxiety symptomatol- ogy between different category of the population based on gender by using different scales like for socio demographic variants and count of anxiety, stress and depression (HADS), self-esteem (RSE), interpersonal functioning (IIP-32) and social support
(MSPSS). And to look at the impact of particular factors in predicting levels of anxi- ety symptomatology. For the different sections of the authors’ goal in data collection, in a span of three years, 913 persons who classified as transgender and attended a transgender health service were questioned in varied quantities. Transgender peo- ple exhibited twofold higher risk of anticipated anxiety disorder in contrast to the public. Both low self confidence and substandard social communication have been connected to anxiety signs.
In this paper[1] the researcher proposed to investigate facilitative and avoidant cop- ing as predictors of distress and transformation phase, peer assistance, and death.
The research were conducted through questionnaire that included different level of measurement on transgender identification, family’s previous records, psychological issues, grief, resilience, anxiety and depression. Total 351 transgender individual took active participation. To evaluate the data Structural Equation Modeling was used and depending on the perception of anxiety and depression, two different mod- els were predicted. The result shows that 51.4% transwomen; 48.3% transmen are found with depressive symptoms and 40.4% transwomen; 47.5% for trans men are found with anxiety. In both instances, avoidant coping acted as an intermediary.
Societal facilitation was found related to distress factors both directly and indi- rectly through avoidant coping. The result suggests that for enhancing transgender people’s mental health, professionals should focus on minimizing avoidant coping behaviors while simultaneously enhancing social support.
The association[2] offered some criteria for effective psychological treatment of trans- gender individuals. The major goal was to assist psychologists in allocating suitable cultural adaptation, advances, and gender-affirming psychological therapies to trans- gender and gender nonconforming people. Different guidelines were covered in the paper, as well as the disparity between guidelines and standards. Different guide- lines were established for specific research topics such as fundamental knowledge and comprehension, stigma and prejudice against care, lifespan development, test- ing and therapy, research, education, and training. There were 16 guidelines, such as guideline 7: how psychologists must detect stigma, discrimination, and preju- dice that affect transgender people’s health. Furthermore, the application of these principles were highlighted, for example, the application of guideline7 revealed that psychologists are driven to address public policy in order to reduce harmful systemic effect on transgender individuals and promote societal positive improvements.
The aim of this paper[7] was to perform a systematic evaluation of the impact of education, race, and income on a transgender person’s lifetime risk of suicidal thoughts and behavioral problems (SITB) in published literature from 1997 to 2017.
The study examined 64 research projects (108 articles) with quantitative data on transgender SITBs, of which at least 51% were over the age of 18. In total, 46.55 percent of papers had suicidal thoughts, with 27.19 percent actually attempting suicide. The majority of Caucasian participants had a bachelor’s degree and a yearly income of10−50000. Despite this, the suicide attempt rate among advanced degree holders was 30.25% and 50.70% among high school students. These findings could be valuable in developing factually and culturally appropriate therapies for transgender people suffering from SITBs, as well as informing future study on the subject.
In this research[6], the authors integrated the relevant literature and to apply the Mi-
nority Stress Model to comprehensively identify mental health end results, in addi- tion to related risk and resilience variables, in gender nonconforming groups(TGNS) and transgender people. It also aims to provide a comprehensive assessment for researchers by focusing on the gaps, as well as key methodological concerns. They utilized a dataset of 77 papers published between 1997 and 2017 to define mental health outcomes and identify gaps in current research. The stress and coping model was utilized as the framework for synthesizing available literature. The Preferred Reporting Items for Meta-Analyses (PRISMA) and Systematic Reviews Guidelines were used to develop a review process and data capture forms. The result shows that Anxiety and overall distress have repeatedly been found to be higher in TGNC individuals.
Another study[11] looked at the depression level of transgender community and their personality traits to determine how they performed psychologically. They also compared their results to that of people and looked at the impact of character profiles in understanding the differences in depression scores among cisgender and transgender adults. This study recruited both transgender and cisgender volunteers in Shanghai Mental Health Centre from September 2018 to July 2019. There were a total of 77 (53.5%) males among which 45 were transgender people and 32 were cisgender people, and 67 (46.5%) females where 26 were transgender people and 41 were cisgender people among the participants. In the MMPI, the mean T score of the Mf subscale amid transgender people was 73.77, which was within the clinical range (T score 70). 16 (22.5 percent) of the 73 transgender subjects were in the range of subclinical (55 T score 70), while 43 (60.6 percent) were in the range of clinical (T score 70).
Chapter 2
Methodology & System Structure
2.1 System Overview
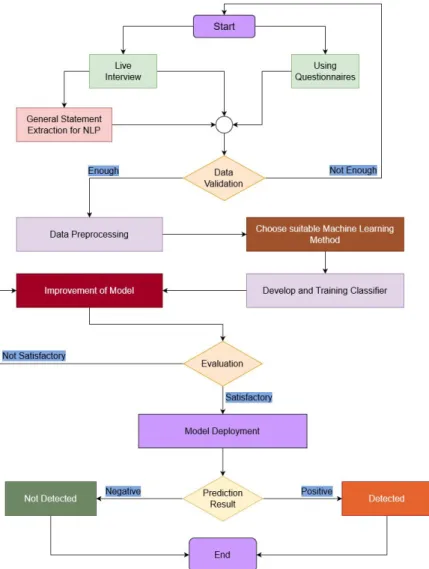
This study predicts transgender depression and anxiety. Our model requires a pro- cedure that takes data from our dataset and systematically processes it to predict depression and anxiety in people. The work plan for our research is given below:
Figure 2.1: Flowchart of ML based Depression & Anxiety Detection Model
2.2 Dataset
We attempted to collect data in our study by conducting interviews and acquiring raw data after the questionnaire was prepared and translated into Bangla with the help of expert psychologists in the field. Because we were dealing with a very sensi- tive and difficult-to-reach group, data collecting was rather inflexible. However, we were able to speak with and record a few of the transgender individuals. The dataset was created by collecting the answers of 41 transgender individuals who were chosen arbitrarily with the help of different organizations like ‘Brihonnola’. They were asked to complete three sets of depression and anxiety questionnaires, as well as hybrid- formed questions with items 30, 36, and 25 that evaluate depression and anxiety levels. As a result of being social outsiders, the participants displayed significant fear and animosity against our group, which was transmitted while conversing with them. We used the total points collected from the classification of each question in the ML models to predict anxiety and depression in the transgender population, as well as the severity of it. We addressed the data acquired through surveys and interviews. Using depression, anxiety, and our hybrid questionnaire, all of which were authorized by the psychologists at our institution, we constructed the dataset in Excel. We also utilized sentiment analysis to extract features and determine if the general remarks obtained during the interviews were positive or negative. The datasets are described below:
2.2.1 Depression Prediction (Uddin & Rahman, 2005)
The survey assesses each individual’s depression. It is a depression screening ques- tionnaire that has been culturally adapted for Bangladesh. It includes 30 features in total, with each feature separated into 5 subcategories. These are: Not at all applicable(1), Not applicable(2), Neutral(3), Slightly applicable(4), Totally appro- priate(5). The questionnaire score ranges from 30 to 150 based on self-assessment.
30 to 100 is regarded as mild, 101 to 114 is considered moderate, and 124 to 150 is considered severe. The questions are provided below:
• Depression Prediction Questionnaire (Uddin & Rahman, 2005):
1. I feel impatient.
2. I feel low these days.
3. My future is dark
4. I feel like my situation will get worse in the future 5. Everything in my life is finished
6. I think that life is currently extremely difficult 7. I feel like a total failure as a human
8. I do not enjoy anything at all 9. I consider myself inferior
10. My self confidence has decreased in everything 11. People seem to feel sorry for me
13. I often feel like crying 14. I often feel irritated
15. I don’t feel interested in anything
16. Nowadays I cannot take any decision or consider anything 17. I can’t seem to concentrate on anything these days
18. I can’t remember things like before 19. I feel weak and get tired easily 20. I sleep less now
21. I sleep more now
22. My mood has become irritable 23. My appetite has decreased 24. My appetite has increased
25. I have lost weight without trying
26. I think the pace of my work has slowed down
27. I cannot laugh even when something funny happens 28. My interest in sex has waned
29. I cannot participate in social activities like before
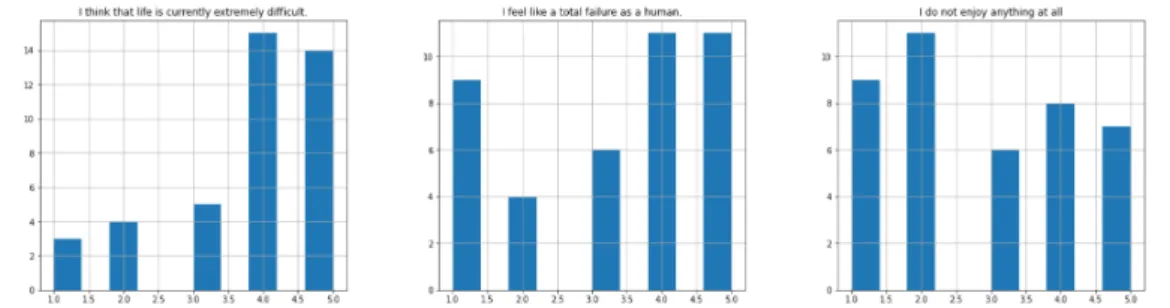
30. I cannot perform my educational and professional activities like before Based on the features and the categories we derived a histogram:
Figure 2.2: Histogram for Depression Prediction Questionnaire
2.2.2 Anxiety Prediction (Diba & Begum, 2004)
The survey assesses each individual’s anxiety. It is an anxiety screening question- naire that has been culturally adapted for Bangladesh. It includes 36 features in total, with each feature separated into 5 subcategories. These are: Not happening at all(0), Happens sometimes(1), Happens often(2), Slightly applicable(3), Totally ap- propriate(4). The questionnaire score ranges from 0 to 135 based on self-assessment.
47.5 is considered a cut out point, 54 and less regarded as mild, 55 to 66 is considered moderate, and 67 to 77 is considered severe, 78 to 135 is profound. The questions are provided below:
• Anxiety Prediction Questionnaire (Diba & Begum, 2004):
1. I experience frequent breathing 2. I feel suffocated
3. My heart feels heavy
4. My heart beats faster than usual 5. I feel chest pain
6. I experience quivering in different parts of my body 7. My hands and feet shivers
8. My hands and feet feels numb
9. I experience burning sensation in my hands and feet 10. I experience dizziness
11. My head spins
12. I experience headache
13. I can feel my scalp burning up.
14. I frequently get thirsty
15. I feel like I’m going to get sick 16. I am anxious about my health 17. I feel weak
18. I have digestion distress
19. I feel discomfort in my stomach 20. I feel nauseous
21. I sweat frequently 22. I don’t feel comfortable
23. I face difficulty communicating in social gatherings 24. I overthink about a particular matter
25. I feel anxious thinking about my future 26. I often get anxious
27. I often get startled
28. I often feel agitated and hesitant 29. I have fear of losing self control
30. I often feel disoriented when I get nervous or excited 31. I feel impatient
32. I often get indecisive 33. I lack self confidence
34. Concentrating on a specific issue becomes difficult for me 35. I feel as if I’m going to die.
36. I constantly have fear of death
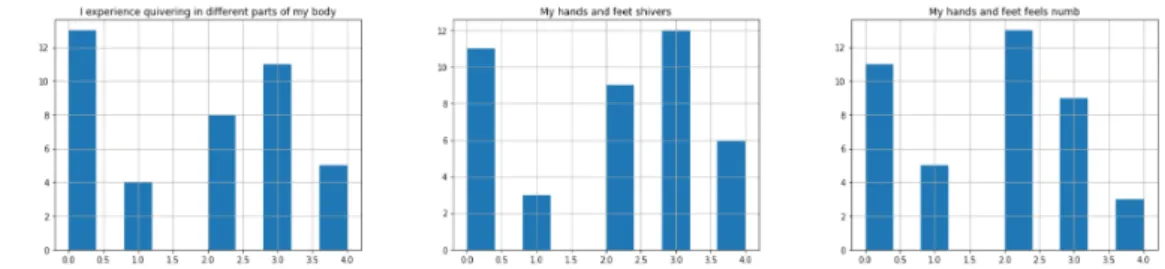
Based on features and subcategories the histogram is shown below:
Figure 2.3: Histogram for Anxiety Prediction Questionnaire
2.2.3 Hybrid Questionnaire (Depression and Anxiety):
In order to find depression and anxiety we created a hybrid questionnaire that incor- porates dimensions like minority and resilience scale in addition to gender identity appearance congruence scale. This hybrid questionnaire was reviewed and accepted by two psychologists. The hybrid questionnaire contains 25 items of which each item is marked as ‘yes’, ‘no’ and ‘sometimes’. We mapped these into numerical val- ues with yes being equivalent to 3, no being equivalent to 1 and sometimes being equivalent to 2. The questions used for this hybrid questionnaire is given below:
• Hybrid Questionnaire (Depression and Anxiety):
1. Do you struggle with mental health issues?
2. Do you sometimes experience breathing difficulties?
3. Have you had difficulty getting medical or mental health treatment?
4. Were you in situations where you would overreact?
5. Do you feel unhappy about your gender identity or expression?
6. Do you feel like you do not have enough willpower or enthusiasm towards doing anything?
7. Did you find it hard to wind down?
8. Do you feel too much negativity and can not think of any positive expe- rience at all sometimes?
9. Do you feel like your life is meaningless?
10. Do you feel you can not control your anger?
11. After bursting out at someone do you regret?
12. Do you fear speaking up about your feelings and needs?
13. Do you feel that most people can’t be trusted?
14. Do you ever experience difficulty getting identity documents that match your gender identity?
15. Did you ever feel that you had nothing to look forward to because of discrimination and lack of opportunities?
16. Do you feel intimidated or threatened by people if they look at you or pass comments?
17. Do you feel anxious to be around people of other genders?
18. Have you been verbally harassed or teased because of your gender iden- tity?
19. Have you been pushed, shoved, hit, or had something thrown at you because of your gender identity?
20. Have you ever self-harmed (or had thoughts about, plans towards causing yourself physical pain) or had suicidal ideation?
21. Have you ever had physical interventions to make your body appear “hy- permasculine” or “hyperfeminine”?
22. Have you faced difficulty finding a partner or having a relationship be- cause of your gender identity or expression?
23. Have you been rejected or made to feel unwelcome by a religious com- munity because of your gender identity or expression?
24. Does your gender identity come in your way of pursuing your education?
25. After completing this questionnaire do you feel you need guidance from a counselor or therapists?
The preprocessing for these datasets are done in two sections for the machine learning algorithms and NLP later in the paper.
2.3 Applied Methods in Statistical Analysis
2.3.1 Finding internal consistency via Cronbach Alpha
In order to determine a questionnaire’s internal reliability or integrity, Cronbach Alpha, or coefficient alpha, is used. It provides support for the validation of ques- tionnaires based on likert scales. When doing questionnaire-based research, a Likert scale is an important tool. They are primarily intended to assess societal behavior, views, and opinions. Cronbachalpha is computed by comparing the value of each item to the total value of each remark and then weighting it against the variation of each individual item’s value. The formula for evaluating cronbach alpha is given below:
α = N ·¯c
¯
v+ (N −1)·¯c (2.1)
Here,
• N = the number of items
• c̄ = average covariance between item-pairs
• v̄ = average variance
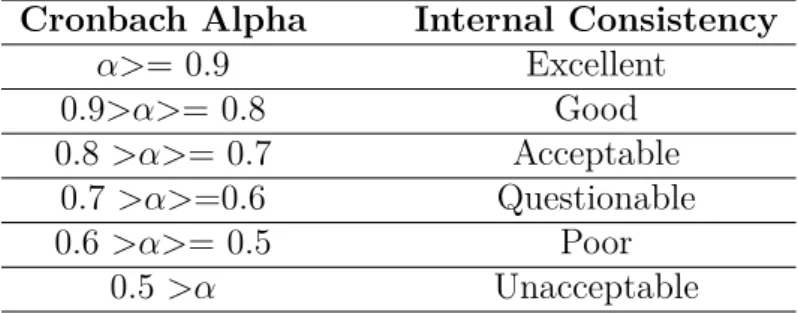
For this study, we used Pingouin, which is a free and open-source statistical analysis tool. We preprocessed the data for our hybrid questionnaire, depression question- naire, and anxiety questionnaire, then installed pingouin in order to calculate the cronbach alpha. The different values of alpha indicates different internal consistency.
The values are given below:
Cronbach Alpha Internal Consistency
α>= 0.9 Excellent
0.9>α>= 0.8 Good 0.8 >α>= 0.7 Acceptable
0.7 >α>=0.6 Questionable 0.6 >α>= 0.5 Poor
0.5 >α Unacceptable
Table 2.1: Internal consistency of different alpha values
2.3.2 Median & Standard Deviation
The median of an ascending data collection is a statistical indicator that identifies the midway value. The median is the value in a set of data that falls in the middle of the upper and lower halves. The advantage of selecting a median value that is above average is that it increases the accuracy of the midpoint because it is less affected by extreme figures. The standard deviation on the other hand is a measurement technique that investigates the variance of a data collection, or how measurements of variables deviate from the mean or median value. A small standard deviation shows that the value is closer to the mean, whereas a big standard deviation reveals how far the data has drifted from the mean. Below is the formula for calculating standard deviation:
SD = s
PN
i=1(xi−x)−2
N −1 (2.2)
Here,
• N = number of observations
• (x1…xN) = observed values
• x = mean value
2.3.3 Pearson Correlation Coefficient
Pearson’s correlation coefficient is a test statistic used to determine the statisti- cal connection, or relationship, of two continuous variables. It is acknowledged as the best way to quantify the connec- tion between variables of interest since it is based on the idea of covariance. It in- dicates the correlation’s amplitude and
direction. The coefficient number goes from -1 to 1, with 1 representing a total linear relationship, -1 total negative correlation, and 0 representing no correlation. This method is a widely used and popular method to determine the linear relationship between two variables. The coefficient is derived by multiplying the covariance of
the two variables and dividing it by the standard deviation of each variable. For ex- ample, if we consider A & B are two independent variables, then Pearson Correlation Coefficient between these two variables will be:
ρ(A, B) = cov(A, B)
σ(A)σ(B) (2.3)
Here,
• Theρ denotes Pearson Correlation Coefficient
• cov(A,B) is the covariance between two variables
• σ(A)σ(B) is the multiplication of standard deviation of both variables
2.3.4 Chi-Square Test
A Chi-Square Test for Independence compares categorical variables (i.e., whether the variables are independent or related). Non-parametric test uses a contingency table to analyze data. The chi-square statistic compares predicted and actual results based on sample size and number of variables. Chi-square tests are frequently used in hypothesis testing. Degrees of freedom are used to establish if a null hypothesis can be re- jected based on the total number of vari-
ables and samples. A small Chi Square suggests categorical variables are connected.
A large Chi Square shows no link between categorical variables. A chi-square test generates a p-value under the null hypothesis, which provides evidence against it.
The null hypothesis states that the dataset variables are independent and unrelated.
The p-value shows test significance. Less p-value, more relevance. The p-value is used to determine if the observed and anticipated results vary enough to reject the null hypothesis. P-value is compared to 0.05 Alpha. If the user desires 95% signif- icance, the alpha threshold is 0.05. If P < alpha, the null hypothesis is rejected.
Equation STH determines the Chi Square Test value.
X2 =
P(Oi−Ei)2
Ei (2.4)
Here,
• O refers to the Observed value(s)
• E refers to the Expected value(s)
• i refers to the ith position in the contingency table
2.3.5 ANOVA Test
Normality Test
The most crucial phase in any research is to ensure that the dataset is normal, because many statistical tests have predefined assumptions that must be followed in order to produce useful results. ANOVA, for example, requires that the dependent variable be normally distributed. In other words, the data has to be linear, otherwise the outcome may well be biased due to a violation of the assumption. A Non- parametric dataset is required for several statistical tests such as Kruskal-Wallis Test, Chi-Square Test etc. A variety of known statistical tests can be employed to determine whether or not the dataset is normal. In our research, the normality of the variables was checked using the Kolmogorov-Smirnov Test and the Shapiro-Wilk Test. Both tests are based on the p value as significant value and the significance level set to 0.05. For both tests, the null hypothesis is that the variables are equally distributed. If the p value is less than 0.05, the assumption of normality of the dataset is rejected, and if it is greater than 0.05, the fact that the dataset is normally distributed is established.
One-way Non-parametric ANOVA
Our dataset is subjected to one way non parametric Analysis of variance (ANOVA), which is used to differentiate between the means of three or more independent variables. It is also known as the Kruskal-Wallis Test. Before performing this test, we made sure by double-checking all of the assumptions that are required for the dataset to qualify for it. In order to receive the best results from a one-way non-parametric ANOVA test, the independent variable must be categorical and the dependent variable must be numeric. The data should also be non-parametric i.e non-normal. If the dependent variable is not normally distributed then the Kruskal- Wallis Test is the best alternative to parametric ANOVA. As the dataset of our research indicates non-normal behaviors, Kruskal-Wallis Test has been conducted on this. In this research, the independence of groups is maintained properly, since it is one of the important assumptions of the Kruskal-Wallis test. After checking all of the assumptions, Kruskal-Wallis Test is finally conducted to find correlations between different dependent and independent variables. First and foremost, a null hypothesis is accepted since there is no significant difference between the medians of the variables, i.e. the medians of the various groups are the same. Primarily, a null hypothesis is assumed since there is no significant difference between the mean of the variables, i.e. the means of the different groups are the same. Based on the test statistics and P value of the analysis, the null hypothesis is either rejected or accepted after the test. If the null hypothesis is rejected, the alternate hypothesis is chosen, which states that the means of the variables differ significantly. If the p-value is less than 0.05, the continuous outcome variable between the two independent groups is statistically significant, indicating that they have a correlation. If the p-value is greater than 0.05, the continuous outcome variable between the two independent groups is not statistically significant, implying that there is no correlation between the variables.
2.4 Algorithms and Machine Learning
For analyzing our data we used Machine Learning and NLP. Machine learning is an essential element of the expanding discipline of data science. Within the context of data mining initiatives, statistical approaches are used to train algorithms to generate classifications or predictions, which ultimately leads to the discovery of crucial insights. The following decisions made inside applications and enterprises are influenced by these insights, which ultimately have an effect on key growth Performance metrics. On the other hand, Natural Language Processing (NLP) develops computers that can comprehend and react to text or voice input, as well as answer with text or speech of their own, in a manner that is very similar to how humans do it. NLP combines computational linguistics (rule-based modeling of human language) with statistical, machine learning, and deep learning models.
When these technologies are merged, computers can analyze human language in the form of text or audio data and ’understand’ its whole meaning, complete with the intent and emotion of the speaker or writer.
Data Preprocessing
We employed three questionnaires in our study. These are Depression Prediction (Uddin & Rahman, 2005), Anxiety Prediction (Diba & Begum, 2004), and hybrid questionnaire. We employed supervised machine learning to predict depression and anxiety. It falls within the machine learning and artificial intelligence categories.
The use of labeled datasets to train algorithms that correctly classify data or predict outcomes distinguishes it. The questions are separated into four categories and include four depression labels and five anxiety labels. We did not leave any features out of our survey. We translated the culturally customized bangla questionnaire into English in order to run the machine learning algorithm. We didn’t have to deal with data removal since our data didn’t include any null values. We did, however, encode the label class into numerical data by setting the minimum to 0, moderate to 1, and severe to 3. We didn’t have to discard any data since the correlation coefficient was neutral.
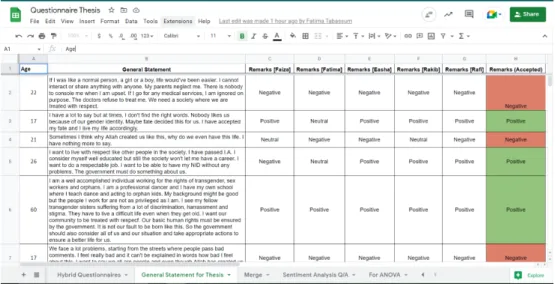
Figure 2.4: Annotation of General Statement
Data Partitioning
Data partitioning is the process of dividing all accessible data into two non-overlapping sets: the training set and the test set. We partitioned the dataset into these two groups. We used 70% of the dataset for training and 30% for testing. We used the python split function to split the dataset.
Data Evaluation
After splitting the dataset and scaling we ran several machine learning models. To evaluate the accuracy we used confusion matrix, accuracy matrix, precision and re- call. Features were combined and compared to increase accuracy and give a better model by defining that the targets are being forecasted accurately. XGboost, Logis- tic Regression, SVM, and Naive Bayes were the algorithms that produced the best results.
2.4.1 Logistic Regression
Logistic Regression is one of the renowned machine learning algorithms which is used for solving classification problems. It is mainly used for estimat- ing the parameters of a logistic model and works as a predictive analysis. Lo- gistic Regression incorporates a more complex cost function, which is known as the ’Sigmoid function.’ The output of a categorical dependent variable is pre- dicted using logistic regression. As a
consequence, the outcome must be discrete or categorical. It may be Yes or No, 0 or 1, true or false, and so on. But instead of exact numbers like 0 and 1, it produces probabilistic values somewhere between 0 and 1. Logistic regression is a popular machine learning technique because it can generate probabilities and clas- sify new data from both continuous and discrete datasets. The equation below was used to estimate the parameters of logistic regression.
log[1−y
y ] =b0+b1x1 +b2x2+...bnxn (2.5)
2.4.2 SVM
SVM is a popular method in Supervised Learning (which stands for Support Vector Machine). SVMs tackle classification and regression issues in machine learning. The Support Vector Machine method splits n-dimensional space into classes to classify data points accurately. Optimal choice boundary is a hyperplane[10]. SVM chooses hyperplane’s extreme points and vectors. Extreme examples of support vectors are known as Support Vector Machines. SVMs may detect complicated data associa- tions without needing many modifications. It’s ideal for small datasets with many attributes. Because they can handle little and intricate data, they often produce
more accurate results than other algorithms. SVMs employ just the class bound- ary data points, hence they need less processing power than random forests and logistic regression. SVMs only employ class-border data points. The model uses solely classification-border data. Reverse selection may enhance prediction and find predictive factors[4]. SVM can classify data using many kernel types. Use a linear kernel. The linear kernel is denoted by the formula:
K(xi, xj) =xixj (2.6)
For the purposes of our study, and due to the fact that our dataset was restricted to a narrow limit, employing SVM in comparison to the other classification models resulted in the greatest accuracy, which was 0.846 for both depression and anxiety.
2.4.3 XGBoost
XGBoost is a technique for collective machine learning that makes use of a gradient boosting framework and is built on decision trees as its primary data representa- tion. It is an implementation of gradient boosting that is very accurate, scalable, and pushes the boundaries of the amount of computer power that can be used for enhanced tree algorithms. It was developed in the first place with the intention of improving the overall performance of machine learning models and accelerating the rate at which these models may be calculated. Since it uses parallel and dis- tributed computing, XGBoost is a much quicker algorithm than other methods.
During development of XGBoost, both extensive considerations in terms of system optimization and fundamentals of machine learning were taken into account. The purpose of this library is to test the boundaries of computing that machines are capable of, with the end objective of providing a library that is flexible, portable, and accurate[12]. The function of XGBoost is the sum of a loss function assessed over all predictions and a regularization function for all predictors (j trees). In the formula, fj denotes a forecast from the jth tree.
obj(θ) =
n
X
i
l(yi−yˆi) +
j
X
j=1
Ω (f j) (2.7)
XGBoost implements a well-known measurement known as ’log loss,’ which is a probability-based metric used to assess the effectiveness of a classification model. In our survey, we performed classification using the XGBClassifier that is included in the scikit-learn package, and we fit it to our training dataset of both anxiety and depression prediction.
2.4.4 Naive Bayes
Naive Bayes is a machine learning method for classifying data. It presupposes strong independence between features based on Bayes’ theorem. Naive Bayes classifiers are scalable in learning tasks, requiring linear restrictions. Naive Bayes is a simple method for building classifiers, models that categorize issue instances as feature vectors. Conditional probability multiplies component probabilities. This means
that, given the class variable, the algorithm assumes the presence or absence of a single class characteristic (absolute independence of features).
P(B|A) = P(B|A)P(B)
P(A) (2.8)
Here,
• P(A) represents the predictor’s previous probability
• P(B) represents the existing likelihood of the class B
• P(B|A) represents the posterior probability
Naive Bayes is useful for large datasets. First, translate the data into a frequency table, then produce likelihood or probability, and then apply the equation. This approach was selected because it performs better with categories than numerical inputs. This method yielded 0.8462 accuracy.
2.5 Natural Language Processing
Dataset
The dataset was compiled using the responses from the interviews that were con- ducted with the transgender people. Our study included the participation of forty- one people who identify as transgender. Each person offered a general remark about how they felt about the society and how they felt about themselves as a part of the society. Using this recorded general statement as a starting point, we first had their responses translated from Bangla to English, and then we used those translations as inputs in the Excel file that we used to generate the dataset for sentiment analysis.
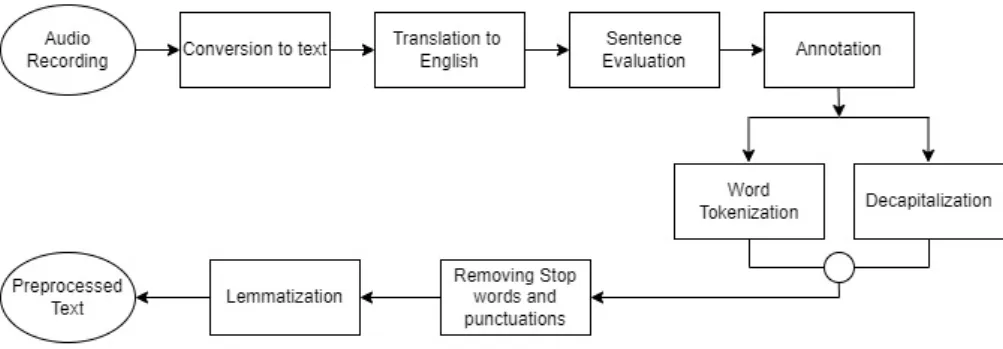
Dataset Preprocessing
In order to facilitate a deeper level of comprehension, each sentence was evaluated by all of our group members and assigned a positive, negative, or neutral interpretation.
The final annotation was selected based on the group’s biggest number of positive, negative, or neutral comments. It was discovered that 29.3 percent were assigned a positive label, 61.0 percent were assigned a negative label, and 9.8 percent were assigned a neutral label. The NLTK module was utilized because it has several interfaces for obtaining corpora, models, and other data packages. The data was then divided into train and test portions. For training, we utilized 70% of the data.
Then we utilized stopwords to remove unnecessary works and WordNet to find word connections, synonyms, grammars, and so on. This is useful for NLP tasks like automated language translation, text similarities, sentiment analysis and so on. We encoded the positive value as 1, neutral value as 0 and the negative value as -1 after using the modules.
Figure 2.5: Dataset Preprocessing Flowchart
2.5.1 Tf-IDF & Machine learning Algorithms
TF-IDF means ”Term Frequency-Inverse Document Frequency.” This is used in ma- chine learning and feature extraction to determine a document or statement’s rel- evance to the corpus. The number of times a phrase appears in a document is calculated using TF. To calculate it, first count the data or words. The raw count is then divided by the document’s total words. Logarithmically scaled frequency (log(1+raw word count)) is conceivable. A value of 1 indicates that the word is in the dataset, whereas 0 indicates that it is not. The term ”inverse document fre- quency” (IDF) refers to the analysis of how frequently a particular word appears in the corpus. The following equation is used to determine IDF:
idf(t, D) =log
N
count(d∈D:t∈d)
(2.9) Here,
• t = term that is to be measured for commonness
• N= number of document in the corpus
• d= number of documents
• D= the corpus
Changing the denominator to ”1 + count” if a phrase is absent from the corpus prevents an error. IDF ensures that commonly used phrases like ”of,” ”the,” and
”as” are written appropriately. Using inverted documents reduces the weight of frequent phrases, giving less frequent terms more weight. Putting together TF-IDF values together by multiplication we get,
tf idf(t, d, D) = tf(t, d)∗idf(t, D) (2.10) If the phrase’s TF-IDF score is high, it’s more relevant; otherwise, it’s less relevant.
Machine learning is sometimes used to classify textual data. In this circumstance, the data must first be vectorized to become a numerical vector. In this stage, each word’s TF-IDF co-occurrence score is transferred into a vector. TF-IDF may be used to extract corpus characteristics.
Chapter 3
Result & Discussion
We received our findings after successfully deploying our test procedures. We found it difficult to evaluate ch square and anova. But we were able to accomplish so thanks to the aforementioned models. We had to guarantee the integrity and de- pendability of our hybrid questionnaire. As a result, we utilized the cronbach alpha.
To find the central tendency of a dataset and how much the data deviated from the average we used median and standard deviation from the statistical analysis.
The chi-square statistic examines the extent of any disparities between observed and expected findings given the size of the sample and the number of variables in the relationship. Moreover, we incorporated ANOVA to determine whether or not the test results are significant. We wanted to discover if there was a link between our results and the symptoms our interviewees stated. The association between symptoms and depression/anxiety was determined using the Pearson correlation co- efficient. We were able to quickly identify the most common and prevalent concerns among participants. The results of the values are discussed below.
3.1 Inferential Statistics
3.1.1 Cronbach Alpha
In order to find out the reliability of the questionnaire used in our survey, cronbach alpha was performed. All the questionnaires had an alpha value greater than 0.7 which is acceptable. The values of alpha are given below.
Variables Cronbach Alpha
Hybrid questionnaire for the prediction
of anxiety and depression 0.732
Depression Prediction
(Uddin & Rahman, 2005) 0.868 Anxiety Prediction
(Diba & Begum, 2004) 0.908 Table 3.1: Internal Consistency for Each of the Variables
The aforementioned figure of the internal consistency for each of the variables makes it clear that the data acquired to carry out this study is very consistent and is
3.1.2 Median & Standard Deviation
The median in statistics is the dividing line between the top and bottom half of a data sample. Since the median is not skewed by a small number of exceptionally big or small values, it provides a more accurate representation of the usual value.
The standard deviation is a measure of variance or deviation among the dataset. It indicates the amount of deviation from the mean/median.
Variables Median Standard Deviation Depression Prediction
(Uddin & Rahman, 2005) 93.0 16.998 Anxiety Prediction
(Diba & Begum, 2004) 72.0 21.138 Table 3.2: Median and Standard deviation of the variables
From the table above, it can be observed that the predetermined and culturally mod- ified depression measures indicate that the maximum of participants suffer from the minimum depression. Additionally, the majority of our research participants suffer from severe anxiety. The individuals deviated from the mean score for depression by 16.988 percent and from the mean score for anxiety by 21.138 percent. From the median found for each question of the hybrid questionnaire it was noticed that max- imum candidates struggle with mental health and it corresponded to major issues like difficulty in getting their identity documents that match their gender identity, feeling intimidated or threatened by people if they look at them or pass comments, difficulty in finding a partner or having a relationship because of their gender identity among the other causes. The standard deviation for these questions were 0.795586, 0.900, 0.767 and 0.943 percent respectively which indicates that the dataset for these particular questions were not deviated much from the mean or median.
3.1.3 Pearson Correlation Coefficient
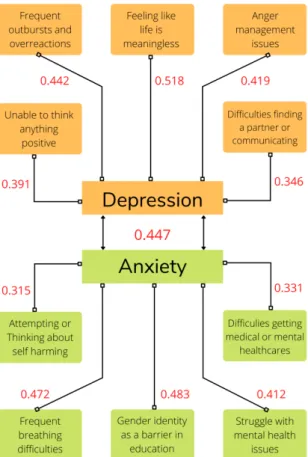
The Pearson Correlation Coefficient determines whether or not two independent variables are associated. In our study, each of our participants was tested for both depression and anxiety. We wanted to see if there is a linear relationship between anxiety and depression in a single person. We calculated a coefficient value of 0.447, which shows a rather substantial link between anxiety and depression. The goal of our next study was to determine the most common symptoms of depression and anxiety. Since we used a hybrid questionnaire with a high number of symptom- based inquiries to interview each of our participants. We compared the results of each question to the depression and anxiety scores. In the case of depression, the greatest coefficient 0.518 was associated with the symptom ”my life is meaningless.”
Other prominent symptoms include ”frequently overreacting” with a coefficient value of 0.442, ”controlling anger” with a coefficient value of 0.419, and ”unable to think positively” with a coefficient value of 0.391. In the case of anxiety, the highest coefficient was 0.483 with the symptom “gender identity as a barrier in education”.
Apart from that, 0.472 was associated with “frequent breathing difficulties”, 0.412 with “struggling with mental health issues” and 0.315 related with “attempting self-harm”.
Figure 3.1: Pearson correlation coefficient of Symptoms vs Depression & Anxiety Chi-Square Test
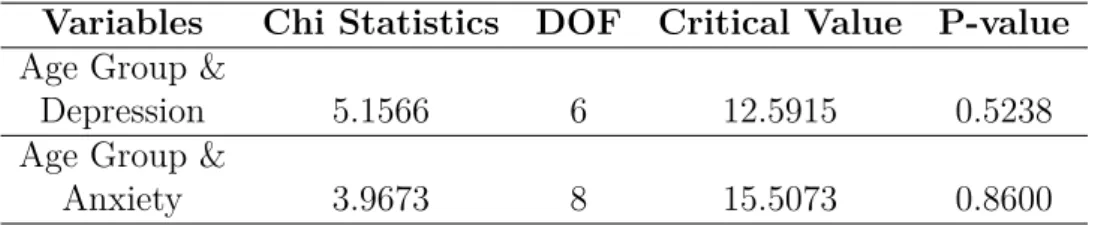
A Chi-Square Test of Independence is used to examine whether or not two categorical variables have a significant relationship. Chi Square test helps to determine whether the null hypothesis is rejected or retained. We have used the Chi square Test of Independence using a contingency table. The hypothesis for our test using the Depression Indicator Questionnaire Dataset was “Depression level and Age groups are independent.”. For the Anxiety Indicator Questionnaire Dataset, the hypothesis was “Anxiety level and age groups are independent”. Chi Square test is a test between categorical variables. To test the hypothesis, the age was grouped into three categories - “Young Adults”, “Middle-aged” and “Elderly”. The Depression Status and Anxiety Status were used which had categories like “Minimum”, “Mild”,
“Moderate” & “Severe”. Table 3.3 shows that Age and Depression have a chi square statistic value of 5.1566 which is less than the critical value. Due to this, the null hypothesis can not be rejected. Again, for the test of Age and Anxiety, the chi square statistic is 3.9673. Since the P value in both cases is greater than the alpha value which is 0.05, the null hypothesis is retained. As a result, it can be derived that Depression and Anxiety levels have no relationship with Age groups as they are totally independent.
Variables Chi Statistics DOF Critical Value P-value Age Group &
Depression 5.1566 6 12.5915 0.5238
Age Group &
Anxiety 3.9673 8 15.5073 0.8600
Table 3.3: Chi Square Test Analysis
3.1.4 ANOVA test
ANOVA helps to determine whether or not the test results are significant. It de- termines if the null hypothesis can be rejected, which states that the mean scores of variables are not equal. The null hypothesis for our research was that the mean anxiety and depression scores among all age groups are equal. The choice can be made by determining whether or not the P value is larger than 0.05. If the recorded P value is greater than 0.05, then the null hypothesis is accepted. If, on the other hand, the P value is less than 0.05, then the mean scores of the variables are not equal.
Variables F-test Statistics P-value Decision Age Groups
& Depression 0.2160 0.8072 Retained Age Groups
& Anxiety 0.0149 0.98514 Retained Table 3.4: One-way Non-parametric ANOVA Test Analysis
After executing the one way ANOVA test in our dataset for anxiety, the f-statistic value was 0.0149 and the P value was 0.98514. Since the P value is greater than 0.05, the null hypothesis was retained indicating that there is not sufficient evidence to say that there is a statistically significant difference between the mean anxiety scores of the three age groups which are Young Adults, Middle Aged and Elderly.
For the depression dataset, the null hypothesis was “The means of depression scores between all three age groups are equal”. For this test the f-statistic was 0.2160 and the P value was 0.8072. Again, as the P value is greater than the alpha value which was set as 0.05, the null hypothesis was retained. This means we don’t have sufficient evidence to say that there is a statistically significant difference between the mean depression scores of the three age groups.
3.2 Experimental Analysis Based on ML and NLP
We needed to prepare three datasets before we could use machine learning methods.
The depression and anxiety questionnaire prediction was categorically categorized and designated into many groups. As a result, supervised machine learning methods were needed for the dataset. We scaled our data using a conventional scaler to achieve better results. Because our dataset was limited, we did not have enough labels to cover all of the characteristics. As a consequence, we stratified the dataset to get better results. Stratified random sampling is a sampling technique that divides
a population into smaller sub-groups known as sectors. We used multiple models to predict depression and anxiety, and some of the top accuracy scores are shown here.
3.2.1 Depression Prediction
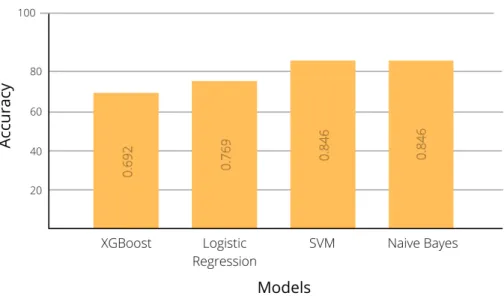
After the dataset was developed, we employed a variety of classification models and algorithms, including Logistic Regression, SVM, XGBoost, and Naive Bayes, to make a prediction of transgender individuals suffering from depression. Accuracy is achieved by utilizing these various methods. The following is a list of the accuracy:
Figure 3.2: Accuracy of different algorithms for Depression Prediction
Among these four models we got the highest accuracy for SVM and Naive Bayes which was 84.6%.
3.2.2 Anxiety Prediction
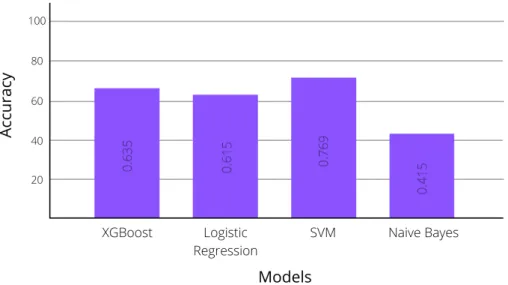
A range of classification models and algorithms, including Logistic Regression (LR), SVM, XGBoost, and Naive Bayes, were used to predict transgender individuals who were suffering from anxiety after the dataset was produced. It is possible to obtain accuracy by using a variety of techniques. An accurate list of the following is provided:
Figure 3.3: Accuracy of different algorithms for Anxiety Prediction
Among these four models we got the highest accuracy for SVM and XGBoost which was 76.9% and 63.5% respectively.
3.2.3 Sentiment Analysis using NLP
After collecting the statement from our transgenders we processed our dataset and ran tf-tdf which converted text to feature vectors for use as input to estimators.
Then we used several models for the f1 scores and the best models are XGBclassifier, LinearSVC, LinearSVC, LogisticRegression and GaussianNB. However, we employed a special kind of SVM called Linear Support Vector Machine in our study weighted by Tf-IDF. The algorithm’s primary goal in this case is to achieve better hyperplanes utilizing various analytical methods.
Features F1 Score
Unigram 69.23%
Bi-gram 53.84%
Tri-gram 61.53%
Unigram and Bi-gram 76.92%
Bi-gram and Trigram 53.84%
Unigram, Bi-gram and Trigram 84.61%
Table 3.5: F1 Scores for different features
The f1 scores for different models are given below:
Figure 3.4: F1 Scores for different Models
Chapter 4 Conclusion
4.1 Conclusion & Future Works
Transgender people have a greater frequency of anxiety and depression, according to recent studies. Transgender depression is directly connected to societal rejection or violence. The stress of transitioning may contribute to their depression and anx- iety. Untreated transgender persons may be more prone to sadness and anxiety.
Individuals may feel less despair and be better prepared for a successful transition if they undertake gender affirming treatment along with programs that build interper- sonal skills, increase self-esteem, and create social acceptance. During our inquiry, we sought numbers for proper data analysis, which would lead to accurate identi- fication of transgender mental health issues. These were all considered. In light of these findings, the societal barrier must be removed to promote mental wellness.
Our research aims to predict transgender depression and anxiety and their sever- ity. Find out if these mental diseases are linked using statistical analysis. In our research, we started with primary fieldwork to gather data from interviews, which led to compelling results in discovering the relationship between depression, anxi- ety, and associated components. Our study datasets were consistent and legitimate after statistical analysis. Using xgboost, logistic regression, svm, and naive bayes, we attained an accuracy rate of 84.6% while for sentiment analysis in NLP the F1 score of linear SVC gave us a score of 92.30% which was the highest among others.
These results reveal that the research has clear links between depression and anxi- ety and accurate severity predictions. According to study, most transsexual people have significant anxiety and mild depression. So, it is appropriate that the research provides ample data that may be used to give proper medication and reduce the occurrence of these diseases. In the future, we may expand the dataset for improved machine learning and natural language processing outcomes. In addition, we may include the hybrid questionnaire’s descriptive responses from the recordings into sentences and apply sentiment analysis to the dataset for a deeper understanding and more accurate findings in predicting depression and anxiety among transgender individuals.
Bibliography
[1] S. Budge, J. Adelson, and K. Howard, “Anxiety and depression in transgender individuals: The roles of transition status, loss, social support, and coping,”
Journal of consulting and clinical psychology, vol. 81, Feb. 2013.doi: 10.1037/
a0031774.
[2] A. Association, “Guidelines for psychological practice with transgender and gender nonconforming people,” American Psychologist, vol. 70, pp. 832–864, Dec. 2015.doi: 10.1037/a0039906.
[3] W. Bouman, L. Claes, N. Brewin, et al., “Transgender and anxiety: A com- parative study between transgender people and the general population,” In- ternational Journal of Transgenderism, pp. 1–11, Dec. 2016. doi: 10.1080/
15532739.2016.1258352.
[4] J. Yu, A. Xue, E. Redei, and N. Bagheri, “A support vector machine model provides an accurate transcript-level-based diagnostic for major depressive dis- order,”Translational Psychiatry, vol. 6, e931, Oct. 2016.doi: 10.1038/tp.2016.
198.
[5] G. Chodzen, M. Hidalgo, D. Chen, and R. Garofalo, “Minority stress fac- tors associated with depression and anxiety among transgender and gender- nonconforming youth,”Journal of Adolescent Health, vol. 64, Sep. 2018. doi:
10.1016/j.jadohealth.2018.07.006.
[6] S. E. Valentine and J. C. Shipherd, “A systematic review of social stress and mental health among transgender and gender non-conforming people in the united states,” Clinical Psychology Review, vol. 66, pp. 24–38, 2018, Gender and Mental Health,issn: 0272-7358. doi: https://doi.org/10.1016/j.cpr.2018.
03.003.
[7] N. Adams and B. Vincent, “Suicidal thoughts and behaviors among trans- gender adults in relation to education, ethnicity, and income: A systematic review,” Transgender Health, vol. 4, pp. 226–246, Oct. 2019. doi: 10.1089/
trgh.2019.0009.
[8] M. Akhtar and N. Bilour, “State of mental health among transgender individ- uals in pakistan: Psychological resilience and self-esteem,”Community Mental Health Journal, vol. 56, pp. 1–9, May 2020.doi: 10.1007/s10597-019-00522-5.
[9] N. Anderssen, B. Sivertsen, K. Lønning, and K. Malterud, “Life satisfac- tion and mental health among transgender students in norway,” BMC Public Health, vol. 20, Jan. 2020. doi: 10.1186/s12889-020-8228-5.
[10] M. McGregor,Svm machine learning tutorial – what is the support vector ma- chine algorithm, explained with code examples, Jul. 2020. [Online]. Available:
https://www.freecodecamp.org/news/svm-machine-learning-tutorial-what-is- the-support-vector-machine-algorithm-explained-with-code-examples/.
[11] J. Zhang, P. Wang, F. Zhang, and H. H. M. Lo, “Using mental health screen- ing instruments for understanding depression and personality profiles among chinese transgender individuals,”China Journal of Social Work, vol. 13, Aug.
2020. doi: 10.1080/17525098.2020.1803517.
[12] G. L. T. -,Understanding xgboost algorithm: What is xgboost algorithm? Mar.
2022. [Online]. Available: https://www.mygreatlearning.com/blog/xgboost- algorithm/#:~:text=XGBoost%5C%20is%5C%20an%5C%20optimized%
5C%20distributed,a%5C%20fast%5C%20and%5C%20accurate%5C%20way.