I hereby declare that the research work included in this thesis titled Prediction of Protein Methylation Sites of Lysine Residues Using Machine Learning Algorithms is the result of original work done by Sadia Islam under my supervision. I would also like to express my gratitude to the people who have supported me along the way. Last but not least, I would like to thank the United International University for providing me with such an environment to carry out my studies.
Motivation
Research Aims
Objectives of the Thesis
Thesis Contributions
Organization of the Thesis
Biological Preliminaries
- Proteins
- Post Translational Modification (PTM)
- Methylation
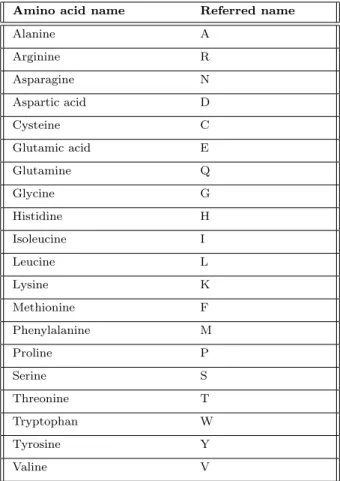
These amino acids are responsible for different functions including different molecular motors and different signaling processes [10]. Along with lysine methylation, arginine methylation also plays an important role for protein data analysis. In various biological aspects such as gene expression and regulation of protein function and RNA sequence processing, lysine methylation plays an important role [8].
Machine Learning Preliminaries
- Defining Machine Learning
- Machine Learning in PTM
- Machine Learning Algorithms
The implementation of machine learning is increasing with time due to its great success in different fields. The gradual learning nature of machine learning tasks lends itself to making decisions about unseen things has made it popular enough to make decisions or predict any future event [15]. In this regard, in our work, we focus on predicting the site of lysine methylation from protein data using different machine learning classifiers.
SVM works by creating a hyperplane between classes and finding the data points on which to create the partition, known as support vectors [21]. Logistic Regression: Logistic Regression is another well-known machine learning algorithm used for prediction purposes. When we use the Gaussian distribution to calculate the probability for each case, it is known as Gaussian naive bays [25].
However, augmentation is known as ensemble classifier, where more than one compared to a weak rule or classifier results are combined to make a decision. Gradient Boosting: Gradient Boosting algorithm is known as one of the most powerful machine learning algorithms with many different applications. Rotation forest classification is another example of ensemble machine learning algorithm which combines the decision of different rules.
Multi-layer Perceptron Classification: Multi-layer Perceptron (MLP) is known as a neural network-based machine learning algorithm that works in a different layer than the input layer.
Literature Review
Gap Analysis
Dataset
Features
Therefore, we have chosen to use predicted structural information as our features that will predict the structural information for proteins to find out the methylation site. We have also combined the predicted structural information with evolutionary information to have a powerful feature set for methylation site prediction. To the best of our knowledge, no studies using combination features of predicted structural and evolutionary information have been found, as they both play an important role in the case of methylation site prediction.

Results
In this chapter we provide a clear and brief explanation of the materials we used for the proposed system and also a clear explanation of the proposed methods.
Materials Methods
- Benchmark Dataset
- Dataset Balancing
- Train and Test Dataset
- Features Extraction
- Evolutionary Information Based Features
- Profile Bigram
- Structural Information Based Features
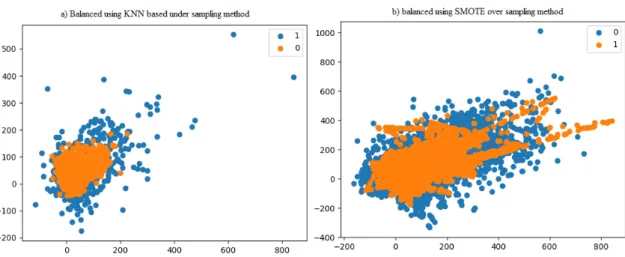
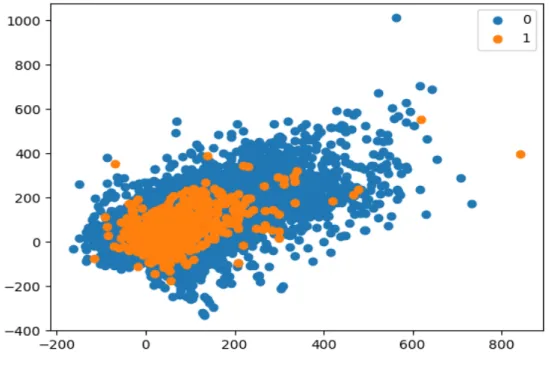
The two most commonly used methods of sub-sampling and over-sampling namely K-Nearest Neighbor (KNN) and Synthetic Minority Oversampling Technique (SMOTE) are investigated in this study. In this figure 3.2, a) shows the distribution of the data after balancing using KNN based on the sampling of the majority class and b) shows the distribution of the data after balancing using SMOTE on the sampling of the minority class. Therefore, in this study, to build our LyMethSE model, we use the undersampling method instead of oversampling.
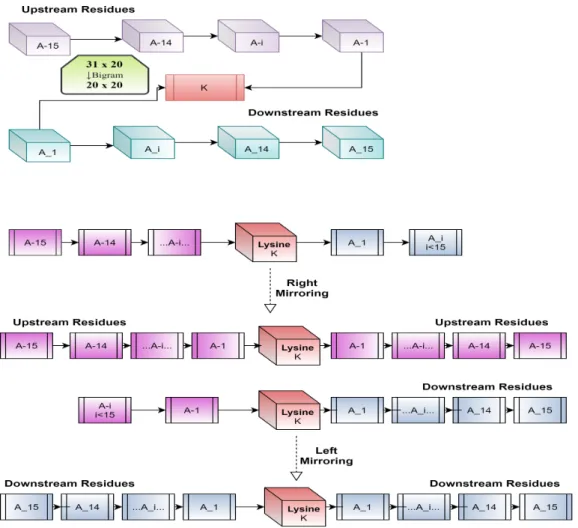
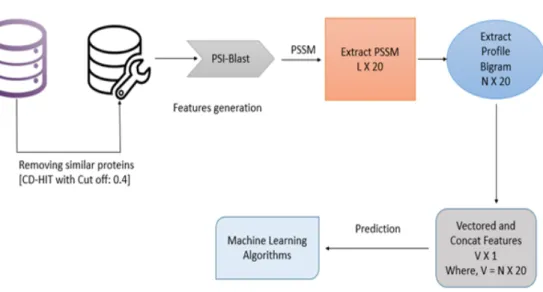
PSSM is an N×20 matrix where N represents the protein sequence length, representing the substitution probability of given amino acid with other amino acids for its position along the protein sequence. The value of p and q here is from 1 to 20 equal to the number of amino acids that build the protein sequence representing a 20 x 20 matrix. If the part of protein sequence that we are considering is called PE, which has a lysine residue in the middle of the section and 15 amino acids at the bottom and 15 more at the bottom, then the visibility of that segment will be.
The amino acids named as A−15 to A−1 and A1 to A15 are the upside amino acids and downward amino acids, respectively, for the targeted lysine in the middle. In a case of protein head and tail parts, where there are not enough amino acids to build the complete window, we use mirror method to fill in the required number. In this method, we fill in the missing amino acids from the data that comes when we mirror the other part.
In this study, we use the secondary structure, the torsional angles of the spine and the accessible surface area (ASA) as structural features.
Classifiers
Support Vector Machine
Support Vector Machine (SVM) is known as one of the most widely used machine learning algorithms. This classic machine learning algorithm has been shown to perform better than many other classifiers for a variety of tasks. The objective of SVM is to find the largest edge hyperplane between classes based on support vector theory to reduce the prediction error and increase the generality of the classification task [ 21 ].
In the case of protein sequence analysis, SVM shows very promising performance compared to other classifiers [64–. To build LyMethSE, we use SVM with rbf as kernel function, which shows the best results compared to other kernels.
Other applied classifiers
Performance Evaluation
Validation
We use an independent test set and 10-fold cross-validation to evaluate the performance of our model. In K-fold cross-validation, we divide the used data set into K segments and then use K-1 segments to train the model and use the last segment for testing. The whole working mechanism and design of our model is shown in the diagram in Figure 3.4.
Summary
We then repeat this model K times to use all samples exactly once for testing. In addition, it describes the classifiers implemented along with the classifier we chose to use as the base methylation prediction classifier for LyMethSE. In this study, we used a balanced CPLM dataset containing 1116 methylated samples and 1101 unmethylated samples.
To validate our model, we split the dataset and 20% of it is used to test the model and 80% of the dataset is used to train our model.
Experimental Results
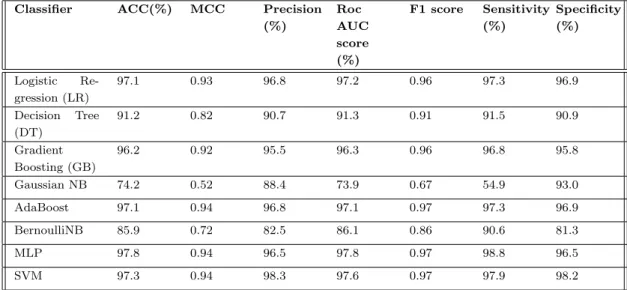
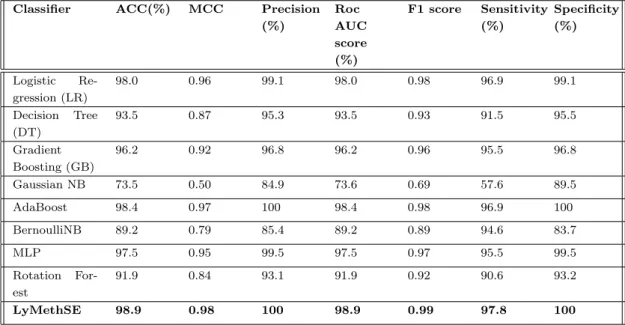
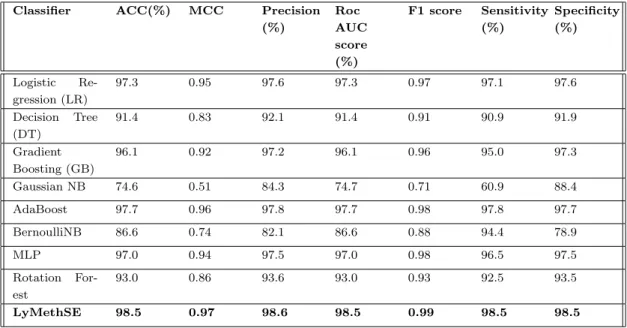
This shows the generosity of our extracted features and also shows the impact of evolutionary based features in the case of methylation site prediction. To investigate more precisely, we also generated the independent test set results for evolutionary-based profile bigram extracted features for different machine learning algorithms. From both table 4.1 and table 4.2 where the 10-fold cross-validation and independent test set results are given for evolutionary based profile bigram features, we can say state evolutionary based information has a great influence in methylation site prediction.
In this regard, we build our LyMethSE model using a built-in combination function of evolution-based bigram profile information and predicted structural information. From Tables 4.1 and 4.2, we find that evolution-based information performs very well with SVM. As shown in Table 4.4, LyMethSE also outperforms and achieved a significant result for the independent test set as well, compared to the other eight classifiers.
From the above discussion, we can say that using evolutionary based bi-profile function we have a very good result for different classifiers. To compare and show the difference between using evolutionary-based bi-profile as features and also using its combination with predicted structural information as feature, we generate a bar graph of MCC score and f1 score for both the results we achieve for these two feature extraction methods. The bar graph of MCC and f1 score for evolutionary-based bigram profile as features and its combination with predicted structural information as feature for 10-fold cross-validation is shown in figure 4.1.
It shows that combining the predicted structural information with the evolution-based bigram profile helps the model to improve its results in terms of various evaluation criteria.

Summary
In this work, we present a new LyMethSE predictor for methylation site prediction of lysine residues from protein sequence. This method demonstrates the effectiveness of using a combination of evolutionary bi-profile information and predicted structural information as features for methylation site prediction. Evolutionary information obtained from the protein sequence and then the profile bigram was used to keep feature sizes constant to account for different window sizes.
Various classifiers are used to predict the sites for the extracted features and our model achieves a significantly outstanding result for such extracted features. In this study, we also present the impact of different classifiers on our extracted features. Thus, we see that LyMethSE together with SVM with the rbf kernel achieves promising results in this respect.
Future Work
Huang, “Incorporating structural features for identifying protein methylation sites,” Journal of computational chemistry , vol. Li et al., “A method for systematic mapping of protein lysine methylation identifies functions for hp1β in dna damage response,” Molecular Cell , vol. Ngai, "Computational identification of protein methylation sites by means of bi-profile bay feature extraction," PloS one, vol.
Zou, “Rapid prediction of protein methylation sites using a sequence-based feature selection technique,” IEEE/ACM Transactions on Computational Biology and Bioinformatics , vol. Napper, "Dapple 2: a tool for homology-based prediction of post-translational modification sites," Journal of Proteome Research, vol. Jiang, “Prediction of lysine pupation sites with machine learning methods,” in International Conference on Artificial Intelligence.
Zhou, “Spider2: A package to predict main chain secondary structure, accessible surface area and torsion angles by deep neural networks,” in Prediction of Protein Secondary Structure. Godzik, "Cd hit: a rapid program for clustering and comparing large arrays of protein or nucleotide sequences", Bioinformatics, vol. Zhou, “Spine x: Improving the prediction of protein secondary structures through multi-step learning coupled with prediction of solvent-accessible surface area and torsional angles of the spine,” Journal of computational chemistry, vol.
Chen, "Svm-prot: web-based support vector machine software for functional classification of a protein from its primary sequence,".