DENGUE DISEASE ANALYSIS IN DHAKA CITY USING MACHINE LEARNING TECHNIQUES
BY
Md Rakib Hassan ID: 221-25-090
This Report Presented in Partial Fulfillment of the Requirements for The Degree of Master of Science in Computer Science and Engineering
Supervised By
Md. Sadekur Rahman Assistant Professor Department of CSE
Daffodil International University Co-Supervised By
Md. Tarek Habib Associate Professor Department of CSE
Daffodil International University
DAFFODIL INTERNATIONAL UNIVERSITY
DHAKA, BANGLADESH 17 JANUARY 2023
ACKNOWLEDGEMENT
At first, we express our heartiest thanks and gratefulness to almighty God for His divine blessing makes us possible to complete the final thesis successfully.
We really very grateful and wish our profound our indebtedness to Md. Sadekur Rahman, Assistant Professor, Department of CSE Daffodil International University, Dhaka. Deep knowledge and keen interest of our supervisor in the field of “Data Science and Machine Learning”
to carry out this thesis. His scholarly guidance, patience, constructive criticism, motivation, constant and energetic supervision, continual encouragement, valuable advice, reading many inferior drafts and correcting them at all stage have made it possible to complete this thesis.
We would also like to thank our co-supervisor Md. Tarek Habib, Associate Professor, Department of CSE Daffodil International University, Dhaka. When we face any problem, she helped us with valuable ideas and suggestions. She motivated us and help us to complete this work.
We would like to express our heartiest gratitude to Professor Dr. Touhid Bhuiyan, Professor &
Head, Department of CSE, for his motivation and appreciation. We are also very thankful to other faculty members and the staff of CSE department of Daffodil International University.
We would like to thank our entire course mate in Daffodil International University, who took part in this discuss while completing the course work.
Finally, we are very thankful to our parents and friends who were always motivate and criticize our work in a manner to improve our work. At least we thank all of them from the core of our heart.
ABSTRACT
As global urbanization and climate change accelerate, Dengue fever is spreading globally.
Bangladesh has also experienced varying degrees of Dengue fever, particularly in the city of Dhaka, causing huge economic losses. Therefore, we collected data on temperature, relative humidity, and rainfall in Dhaka city and tried to find out what kind of relationship there is with dengue. For this purpose, we have collected data on the accuracy of dengue fever forecast in Dhaka city during the period 2010-2019 and also collected our weather data for the same period. First, apply the Linear Regression algorithm of machine learning to this data set to investigate the association of climate with dengue fever. Then apply the Time Series algorithm to whom I have tried to clarify how it is influencing over time.So in our work, we first use the time series dengue fever data that were decomposed into seasonal, trend, and remainder components. Now the seasonal-trend decomposition procedure is based on loess (STL). Then secondly, the time lag of variables was determined in cross-correlation analysis and the order of autocorrelation was estimated using autocorrelation (ACF) and partial autocorrelation functions (PACF).Finally, the two algorithms performed very well on our datasets. Applying the time series algorithm was very challenging for us because we know that Dengue fever is mainly in August, September, and October of the year. September, and October is the maximum but at other times their effect is less.
Also we convert our data into categorical and apply some other algorithms. One of them is Logistics Regression, Decision Tree, Navie Bayes, K-Nearest Neighbors (KNN), Support Vector Machine (SVM) and also apply Random Forest Regression. But here some Algorithm works well but the result of some Algorithm was not satisfactory. Besides that, the biggest challenge was data collection. But in the end, i succeeded and fully did it.
TABLE OF CONTENTS
CONTENTS PAGE
Board of examiners i
Declaration ii
Acknowledgements iii
Abstract iv
CHAPTER
CHAPTER 1: INTRODUCTION 1-5
1.1 Introduction
1.2 Motivation 1.3 Rationale of the Study
1.4 Research Question 1.5 Expected Output
1.6 Project Management and Finance 1.7 Report Layout
01 02 03 03 03 04 05
CHAPTER 2: BACKGROUND 5-10
2.1 Terminologies 2.2 Related Works 2.3 Comparative Analysis and Summary 2.4 Scope of the Problem 2.5 Challenges
05 05 07 09 09
CHAPTER 3: RESEARCH METHODOLOGY 11-27
3.1 Research Subject and Instrumentation 3.2 Data Collection Procedure 3.3 Statistical Analysis
3.4 Proposed Methodology 3.5 Implementation Requirements
11 11 12 14 27
CHAPTER 4: EXPERIMENTAL RESULTS AND DISCUSSION 28-35
4.1 Experimental Setup
4.2 Experimental Results & Analysis 4.3 Discussion
28 32 35
CHAPTER 5: IMPACT ON SOCIETY, ENVIRONMENT AND
SUSTAINABILITY 36-37
5.1 Impact on Society
5.2 Impact on Environment 5.3 Ethical Aspects
5.4 Sustainability Plan
36 36 36 37
CHAPTER 6: SUMMARY, CONCLUSION,
RECOMMENDATION AND IMPLICATION FOR FUTURE RESEARCH
38-40
6.1 Summary of the Study 6.2 Conclusions
6.3 Recommendation
6.4 Implication for Further Study
38 39 39 40
REFERENCES 41
PLAGIARISM REPORT 45
LIST OF FIGURES
FIGURES PAGE NO.
Figure 3.1: Proposed Methodology for Time Series Analysis 15 Figure 3.2: Here is my ADF and Rolling Statistics test graph 17 Figure 3.3: After the log Transform our data is Stationary now 18
Figure 3.4: Decomposition Our Component 19
Figure 3.5: Proposed Methodology for classification algorithm 22
Figure 4.1: Autocorrelation function (ACF). 28
Figure 4.2: Partial Autocorrelation Function (PACF). 29
Figure 4.3: Best Model value in ARIMA. 29
Figure 4.4: Appling ARIMA and draw the best fit line. 30 Figure 4.5: Dengue Disease affected per month 2009 to 2018 30
Figure 4.6: Dengue Disease affected per month 2019 31
Figure 4.7: Confusion Matrix of All Models 33
LIST OF TABLES
TABLE NO. PAGE NO.
Table 2.1: Comparison Between Dengue Fever Previous Work 08
Table 3.1: Dengue Disease Dataset for analysis. 12
Table 3.2: Dataset Details Information 13
Table 3.3: Sample Dataset with Length 13
Table 4.1: Model Accuracy Before Parameters Tuning 31
Table 4.2: Model Parameters Information 32
Table 4.3: Classification Report 34
CHAPTER 1 INTRODUCTION
1.1 Introduction
Dengue is a mosquito-borne disease that has spread rapidly in tropical and subtropical regions of the world in recent years. Dengue virus is mainly transmitted by female mosquitoes of the species Aedes aegypti and to a lesser extent by aedes albopictus mosquitoes are also carriers of chikungunya, yellow fever, and Zika virus. Dengue is widespread throughout the tropics, being influenced by climatic parameters as well as social and ecological, and human factors, creating risk factors. Among those infected various levels of clinical symptoms such as mild fever, headache, muscle and joint pain are observed in addition to pain in severe cases, bleeding and even death. Dengue fever (DF) is widespread Tropical and subtropical regions, such as Africa, the Americas, Southeast Asia, and the Western Pacific. A study by the World Health Organization showed that almost half of the world's population is at risk of DF, and 390 million people are infected with dengue every year, of which about 96 million have clinical symptoms. Over the past 50 years, the incidence of DF has increased 30-fold [3-5]. In the 21st century, DF has rapidly spread and become a serious public health problem.Dengue fever in South Asia was first reported in Bangladesh in 1964 but it has been a major cause of our concern since 2000. While the incidence of dengue in Bangladesh was low compared to most Southeast Asian states, dengue prevalence has continued to increase recently; From 2769 cases in 2017 to 10148 cases in 2018. In 2019, the Director General of Health Services (DGHS) recorded 87,953 cases with 81 deaths, and an increase of almost 9 times the number of infections compared to the previous year, surpassing previous years. Previous studies have shown that dengue cases and deaths are highest during the warmer months of July to November Males were twice as likely to be infected as females.In many cases we misclassify dengue due to the wide spectrum of signs and symptoms of the disease and lack of effective case definition. Therefore, it is of great concern that dengue cases in Bangladesh may be significantly underreported due to faulty health policies or poor surveillance of the health care system. Bangladesh is under constant risk of importation of dengue virus from neighboring countries Local neighbors like India and Myanmar. Dhaka, the capital and one of the most populous capitals Bangladesh's total population (approximately 16 million) was in the largest
number of cities Dengue cases between 2012 and 2019 [20, 22]. Like many other countries, the first dengue vaccine, CYD-TDV we still do not use, has not been introduced in Bangladesh due to the risk of more severe disease exposure in seronegative individuals and children under 9 years of age [23, 25]. Although this is unsustainable, and sometimes ineffective, vector control with insecticides is the mainstay of dengue prevention strategies [26]. Knowledge, Attitude and Practice (KAP) research can be used to eradicate a disease by raising awareness in a population How can we eliminate through research by collecting samples and can we take it further by using health or providing information very quickly; and therefore may play an important role in disease prevention [27–29].Dengue prevalence is increasing rapidly within Dhaka, Bangladesh, and given the recent increase in dengue deaths in Dhaka, one of the most populous cities, there is a need for continuous assessment of people's knowledge, attitudes and practices, hence awareness among Dhaka residents and proper planning by DNCC. Consists of Dhaka North City Corporation (DNCC) and Dhaka South City Corporation (DSCC) with a higher density of former low-income communities (> 124,000 persons per square kilometer) and slums (1755 vs. 1639), inhabited by people but with fewer hospitals and clinics per capita (193 vs. 293) we find [30, 35]. A recent quant Evaluations among these corporations suggest different public health policies for economic reasons the discrimination we observe between the two corporations is not at all desirable.
1.2 Motivation
Dengue is basically a mosquito-borne disease that is slowly spreading in our city of Dhaka as a result of which many people are infected and at risk of death every year.Its horrible picture has come out in various statistics, then we need to take proper measures now to get rid of it which is not possible for the government alone. Because we all know that many of our own negligence is responsible for the spread of dengue, the main negligence that we see in the society is that we do not clean the garbage and the places where rainwater collects around our homes. There is no initiative to do.In this way, Aedes mosquitoes spread constantly in the accumulated water.I think that if we do not take proper measures against it, it will be the subject of our great concert at the present time, although the number of cases has been increasing at a high rate for the last few years, and the number of deaths has been increasing in proportion.So it can be said that it is putting our health sector in a threat
1.3 Rationale of the Study
At present, in the era of modern health system, we can see that no vaccine for dengue virus has been developed yet, but with time, the spread of dengue is increasing day by day. Although we see some vaccines being implemented in some developed countries, if they can be implemented in our country, we may benefit to some extent, but our effective measures for this have not been taken yet.A major reason for this may be that we still lack research on it. Perhaps, we still do not consider it a major threat, but the statistics do not say that. For this, I think we still need to take proper measures so that we can prevent its spread.
1.4 Research Questions
During the research work some question occurs about this work. The main questions of our work in given below:
How do I collect data for dengue disease analysis?
By applying time series analysis can we find out its trending nature at all?
Can we apply supervised prediction models to predict severity of dengue fever in any given month under some specific features?
1.5 Expected Output
This is our experimental analysis, which will enable our health sector to understand the severity of dengue disease. We should be able to understand more about the rate of its spread over time and how its influence is spreading in our society and whether this is a matter of concern or not.Finally, I have some expected output. The results are given below:
A better understanding of the impact of dengue outbreaks will be gained over time.
A dire picture has emerged in the health sector.
The importance of public awareness has been raised
Where the population density is high, the number of infected is higher
Our main expected output is to gain an accurate understanding of dengue prevalence
1.6 Project Management and Finance
I have borne all the expenses for my research data collection.
1.7 Research Layout
In our report we have total 6 chapters
In Chapter 1 we mention our whole research work’s outline and divided this chapter into multiple subchapters. For example, introduction, motivation, rational of the study, research question and expected output of our project.
In Chapter 2 we have discussed about the previous work on Dengue Fever, the scope of the problem and challenges in this work.
In Chapter 3 we will talk about our work procedure, methods and techniques to analysis it by Time Series analysis and linear regression.
In Chapter 4 we will discuss about the Experimental Results and Discussion of our build model.
In Chapter 5 we will talk about the Impact of Society, Environment, Ethical Aspects and Sustainability plan of our work.
In Chapter 6 we have discussed about the Summary, Conclusion and Further Study of the work.
CHAPTER 2 BACKGROUND
2.1 Terminologies
In recent years we can see that the incidence of dengue is increasing day by day all over the world.
Over recent decades, dengue prevalence has increased dramatically worldwide with over 390 million dengue infections occurring annually, a quarter of which show clinical manifestations [2, 3]. The reason for the ongoing increase in the number of dengue cases is, in large measure
In part, the widespread spread of mosquito vectors, rapid and uncontrolled urbanization, increased international travel, and the absence of effective interventions, as well as the lack of awareness among citizens. According to the World Health Organization; The Americas, Southeast Asia (mostly Thailand, Indonesia and the Philippines) and the Western Pacific region are most affected by dengue. Currently, its penetration is also noticeable in Bangladesh and it has increased significantly.In Dhaka, dengue fever is one of the most well-known public health problems. The objective of this study was to examine the epidemiology of dengue and determine the seasonal pattern of dengue and its association with climate factors in Dhaka, Bangladesh, from 2009 to 2019.So we have decided to analyze this problem by applying Time-Series analysis and Linear Regression to find out its worst form.
2.2 Related Works
Since dengue is an epidemic disease, its prevalence is high in tropical countries.Hence, a lot of research has been done on it in almost all the hot summer countries and is still being done.We now want to discuss some such research papers that have worked on dengue fever in different countries."The time series seasonal patterns of dengue fever and associated weather variables in Bangkok" was a research paper published in 2020. In their work, they used time-series analysis of dengue fever data from 2003 to 2017 to highlight various aspects of Bangkok city.In their paper, they have made many graphs about dengue prevalence and made some comparisons like: ACF, PCF, Components.Besides, "A dengue fever predicting model based on Baidu search index data and climate data in".
Another study published in 2019, titled "South China", and highlights the dengue epidemiology of South China.There they did a lot of research on Annual dengue incidence in China, Guangdong, and Guangzhou from 2011 to 2015 respectively. Also, the decomposition plot of local dengue cases in the study areas from January 2011 to December 2015 and calculated Auto-correlation (ACF) and partial auto-correlation (PCF) plots of dengue cases, from 2011-2015.Now we will see some Bangladeshi research papers which have discussed dengue disease. "Dengue in Dhaka, Bangladesh" was a research paper published in 2020 which was hospital-based. Cross-sectional KAP evaluation in Dhaka North (DNCC) and Dhaka South City (DSCC) Corporation area. Where they have published a document about the prevalence of diseases in Taka South and North City Corporation by doing statistical analysis. Shows the segment qualities of respondents from the DNCC and DSCC. A significant number of the respondents were matured 20-40years (44.2%), half were females, most were utilized (65.3%), and were center to big league salary workers (86%).
Around 62.4% of the respondents lived in the South of Dhaka. Numerous respondents didn't safeguard themselves from mosquitoes (60%), and a greater part (88.5%) neglected to keep up with great cleanliness by not cleaning their waste frameworks. Around 66% (71%) of the respondents revealed successive visits to a specialist, what's more, nearly everybody had burned through seven or fewer evenings in the emergency clinic. The typical scores for the respondents' information (A), demeanor (B), and practice (C) towards dengue in DNCC and SNCC Dhaka (Fig 2) was not fundamentally unique among DNCC and SNCC (unpaired t-test: p = 0.2268, 0.7006, and 0.062 individually). In general, the pooled midpoints (±SD) for the two urban areas were 12.0±4.9, 45.5±9.2, and 5.1±1.7 for information, demeanor, and practice separately. This study analyzed KAP in regards to dengue among the occupants of Dhaka by means of the two city enterprises, Dhaka North City Company (DNCC) and Dhaka South City Partnership (DSCC). Our review showed that the greater part of the review populace was educated about dengue, have a fitting and adequate demeanor toward the illness, and lock in rehearses towards its counteraction.
Nonetheless, the elements related to KAP in regards to dengue fluctuated between both city companies; with the term of residency and utilization of mosquito nets viewed as related to information in the north while pay class and age were indicators of information and demeanor in the south. In the pooled examination (joining the two urban communities), information on dengue was a critical indicator of good practice toward dengue fever among the respondents. We found that the general mean rate scores of 52%, 69.2%, and 71.4% for KAP were higher than a clinic put
together a review that inspected KAP with respect to dengue fever among pediatric and grown-up in-patients in Metro Manila, Philippines [34]. This recommends that individuals in Dhaka were, by and large, more proficient, concerned, and would be advised to rehearse towards dengue than in the correlation study [34]. The higher mean rate scores revealed in this study could be ascribed to the way that members analyzed in this study might have encountered an episode of dengue which could change their discernments and disposition towards the infection.Dengue observation has been essential for effectively controlling the flare-up. As per a (CDC report, in August 2019) Diverting general well-being assets from vector control crusades, which had over and over been demonstrated to be inadequate, and on second thought utilizing those to lead cross-country, clinical preparation has been believed to be more viable in different nations that have effectively diminished the passing by dengue consistently. (Illustrations gained from dengue observation and exploration, CDC, 2019) Both the mosquito species and tainted individuals are vital for proceeding with the transmission. Regions with thick populaces close to rearing destinations expect mediations to limit transmission (The American diary of tropical medication and cleanliness, January 2004) Channeled water supply, waste, and sufficient sewage removal are unevenly appropriated all through Dhaka city, all of which can significantly affect dengue transmission.
(PLOS Exploration Article on Dengue, Walk 2017). These can be tackled through basic composed intercessions by DGHS and city companies, supplemented by other CSOs. Networks can likewise assume a significant part in guaranteeing the control and counteraction of the flare-up. (The Day to day Star, August 2019)
2.3 Comparative Analysis and Summery
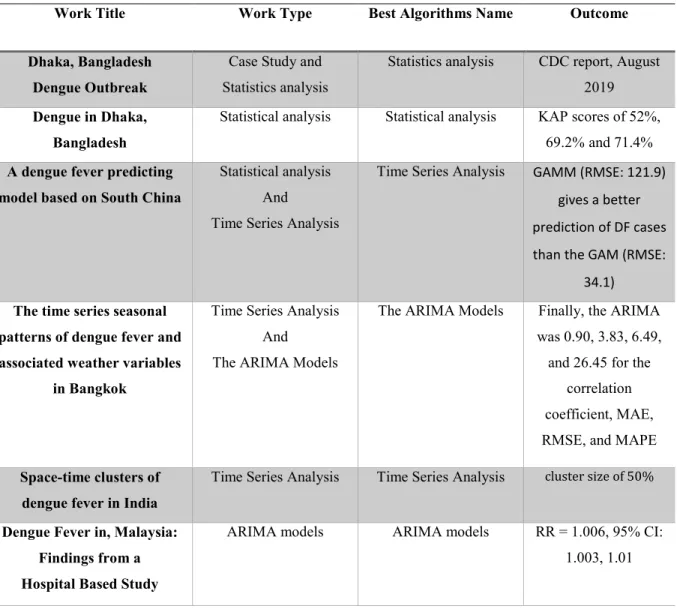
For work, I reviewed some previous work related to us. Basically, I have done some analysis on dengue fever where with the help of time series analysis and linear regression of machine learning I have highlighted the speed nature, spread and severity of dengue fever. Besides that, I have made some comparisons of these related works which are given below.
Table 2.1: Comparison Between Dengue Fever Previous Work
Work Title Work Type Best Algorithms Name Outcome
Dhaka, Bangladesh Dengue Outbreak
Case Study and Statistics analysis
Statistics analysis CDC report, August 2019 Dengue in Dhaka,
Bangladesh
Statistical analysis Statistical analysis KAP scores of 52%, 69.2%and 71.4%
A dengue fever predicting model based on South China
Statistical analysis And Time Series Analysis
Time Series Analysis GAMM (RMSE: 121.9) gives a better prediction of DF cases than the GAM (RMSE:
34.1) The time series seasonal
patterns of dengue fever and associated weather variables
in Bangkok
Time Series Analysis And The ARIMA Models
The ARIMA Models Finally, the ARIMA was 0.90, 3.83, 6.49, and 26.45 for the
correlation coefficient, MAE, RMSE, and MAPE Space-time clusters of
dengue fever in India
Time Series Analysis Time Series Analysis cluster size of 50%
Dengue Fever in, Malaysia:
Findings from a Hospital Based Study
ARIMA models ARIMA models RR = 1.006, 95% CI:
1.003, 1.01
The consequences of the report showed that 36% of Dhaka South City Company (DSCC) and 32%
of Dhaka North City Organization (DNCC) had a 'House File' rating of 10, with the rating liable to apply to a higher extent of houses. (up to 80% houses) during rainstorm season. The study discovered that over 40% of these houses are under development where water-filled barrels, lying randomly, are generally defenseless against becoming favorable places for mosquitoes (CDC report, August 2019.We found that the general mean rate scores of 52%, 69.2% and 71.4% for KAP was higher than a medical clinic put together review that inspected KAP with respect to dengue fever among pediatric and grown-up in-patients in Metro Manila, Philippines.
2.4 Scope of the Problem
When I saw all the research papers, I noticed one thing that the dengue situation in the countries around Bangladesh is very bad. But compared to that, Bangladesh is far behind, even if it is not an epidemic in our country, the way it spreads in the near future, we have to face a very bad experience in the future or it can turn our health sector into a complex situation. At least it can be understood by seeing the expansion of its spread. So I think that as soon as possible to prevent the spread of more research should be done in our country.However, almost all the research papers that I have worked on have discussed the dengue outbreak of a particular year and I have also seen some research papers in which they have tried to solve the issue through case study or analysis. I am here. Wanting to use this as a larger scope, I chose Time Series Analysis to work on the increasing prevalence of dengue fever in Bangladesh from 2009 to 2019.Now the main reason why I used time series here is that the countries around us where dengue outbreaks are more common use time-series analysis for research. Since time-series analysis is a part of statistical analysis and through it a great deal of research or understanding can be gained about the motion nature of an object over time, I would like to apply time-series here so that I can see how the DF spreads over time. Get the right idea about what is growing.
2.5 Challenges
During the whole process of our work, we face some challenges. The main and first problem is the dataset.To be honest I had no idea how to collect such a data set.Then I spoke to my supervisor to know the related information and he advised me to collect it from the Ministry of Health website.
It is a pity that our website of the Ministry of Health is not updated regularly as there are many types of advice related to Dengue but this related work. None of this is stored on their servers.The coronavirus disease is new but very deadly, so there has been extensive research on it in Bangladesh. Its prevalence is very high in our country and abroad recently and many people have died because of it, so many studies are being done or will be done in our country. But I have seen that dengue is such an old disease that there is no extensive research on it. However, every year we see many people dying from it.All kinds of data related to the coronavirus are available on the website of the Ministry of Health, through which anyone can do extensive research, but it is a pity that even though dengue has been slowly killing many people in Bangladesh for so long, I have
not found any such data on the website of the Ministry of Health.That means at least I'm sure they are not giving proper importance to dengue as a result of which they are not collecting any information like how many people are getting infected, and how many people are dying, they are not making it public even if they have three pages, I really don't know why they are not making it public or not. I am confused about the fact that they are not actually collecting. Even though I emailed the Ministry of Health seeking data-related information, but the bot did not respond to any of my emails. In the end I didn't really understand what I should do. Finally, I tried to contact someone who worked, then I talked to some elder brothers of Dhaka University and they actually agreed to help me in this matter. A long time ago they published a report on this related work through a case study, so I have not decided to use the data used in my research, in this case I have decided to apply machine learning to their data set.But teaching I faced some problem when I saw their data set there I saw that there is no weather related information in their data set they only worked with number of patients and some other information. Then I started doing a little research on how to collect data about weather. Later I went to the website of the Ministry of Meteorology and was very disappointed because there are many missing values in the data before 2015. After that I got all the weather data of Bangladesh on Nasa's website which they have collected through satellite.Then I create a new data set by adding the new weather-related data to the previous data set.
CHAPTER 3
RESEARCH METHODOLOGY
3.1 Research Subject and Instrumentation
In my work, I want to create a model that can give an accurate understanding of the spread of dengue in Bangladesh and its harmful aspects, and I have made a research paper about the challenges I may face in the near future to deal with it.To build this model first I need to create a dataset and I need to understand what kind of work I am doing. In my work, I have two classes.
So, our job is to analyze and predict. In this, I am essentially solving the classification problem.
Machine learning algorithms have two ways to build a model, supervised learning and unsupervised learning. Also, I have worked with Time-Series analysis to analyze what kind of changes are taking place over time. In supervised learning, my system is given input and output and the system predicts the unseen data based on the input-output data. On the other hand, in unsupervised learning, I am given only input data, and the machine clusters data based on data patterns. In our work, our system is given input and output data to train the model. So here I use supervised learning. In supervised learning, there are some classification algorithms that are used to solve classification problems. My work is related to binary classification problems. So, we will use some classification algorithm that performs and gives high accuracy with text data. In our work, I am going to use LR KNN, SVM, DT, and RF classification algorithms. In the upcoming proposed method section, I will discuss all the algorithms, how it works and which algorithms work very well on my dataset. After that, I need to evaluate our model based on some criteria like precision, recall, and f1-score. I will briefly discuss all the terms in the Proposed Methods section.
3.2 Data Collection Procedure
Machine learning algorithms work best when the data collected is more balanced and reliable to fully train the machine. So, data collection is very important for My work. I have done a lot of analysis on what kind of data I will collect for our research work, firstly I make a list of how many dengue fever cases per year by month. I've added the two together. I have collected this data from 2010 to 2019, one thing to mention here is that one of the major reasons why we are unable to save the data for 2020 and 2021 is the outbreak of the Covid 19 virus during this period. Because dengue
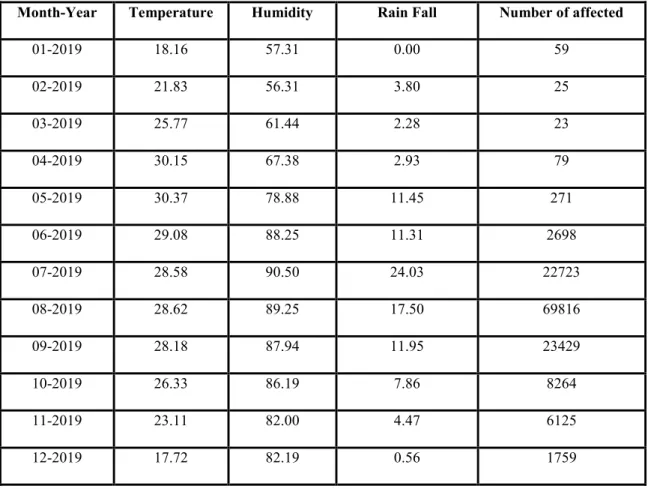
and covid-19 virus patients had fever symptoms, it was seen that people sought treatment at home for fear of social stigma, thinking it was a common fever or covid-19, so data on dengue fever was not properly stored.I have tried to analyze some samples of our data collection here. Through that you can get an idea of what kind of data we have used in My work. Table 3.1 provides the sample data.
Table 3.1: Dengue Disease Dataset for analysis.
Month-Year Temperature Humidity Rain Fall Number of affected
01-2019 18.16 57.31 0.00 59
02-2019 21.83 56.31 3.80 25
03-2019 25.77 61.44 2.28 23
04-2019 30.15 67.38 2.93 79
05-2019 30.37 78.88 11.45 271
06-2019 29.08 88.25 11.31 2698
07-2019 28.58 90.50 24.03 22723
08-2019 28.62 89.25 17.50 69816
09-2019 28.18 87.94 11.95 23429
10-2019 26.33 86.19 7.86 8264
11-2019 23.11 82.00 4.47 6125
12-2019 17.72 82.19 0.56 1759
3.3 Statistical Analysis
After collecting data from various sources, I was able to collect 132 data.That is, from 2009 to 2019, a total of 132 data were collected, 12 per year.Our data set has a total of 5 columns and 132 rows.The fast column attribute is named year because I will be applying time-series analysis and we know that time-series analysis is time-series analysis and on the other hand I will be analyzing the changes in our target over time based on what kind of changes My target has made. Take the time.The other three column properties are named Temperature, Humidity, Rain Fall respectively.
The last column is our target whose attribute name is the number of affected.That is, the number of the number of infected every month is placed here.
Table 3.2: Dataset Details Information
Number of affected Total Data Count Percentage of Total Count
Low number of affected 80 60.60%
High number of affected 52 39.40%
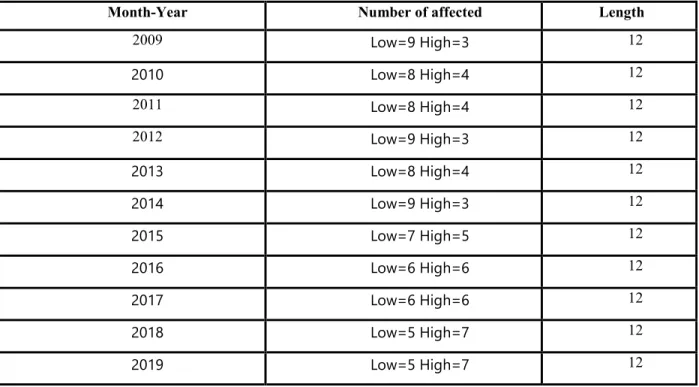
Table 3.3: Sample Dataset with Length
Month-Year Number of affected Length
2009 Low=9 High=3 12
2010 Low=8 High=4 12
2011 Low=8 High=4 12
2012 Low=9 High=3 12
2013 Low=8 High=4 12
2014 Low=9 High=3 12
2015 Low=7 High=5 12
2016 Low=6 High=6 12
2017 Low=6 High=6 12
2018 Low=5 High=7 12
2019 Low=5 High=7 12
We have 5 columns in our dataset.
In our dataset we have highest 12 lengths of every year data.
Our dataset is available in CSV (Comma Separated Value) format which extension is .csv
Our data set we can see in 2019 and 2018 High number of affected.
3.4 Proposed Methodology:
I am going to discuss about our research methodology in this following section. In My work, I use six supervised machine learning classifiers and Time Series Analysis. The six supervised model is linear regression, logistic regression, DT, RF, KNN, and SVM to classify the increasing ret of Dengue Disease.
3.4.1 Proposed Methodology for Time Series Analysis:
So first I want to talk about the time series analysis then we discuss the classification algorithm.
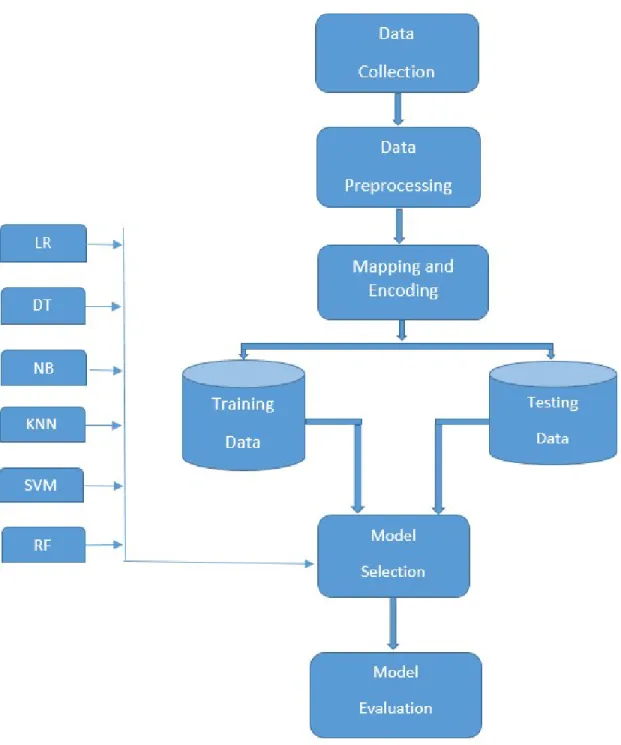
For this, I divided our work into some steps for using time series analysis. Each step is very important for Time Series, the most important thing I need to notice is the Stationary check of our Data set. In case it is not stationary, I have to apply some method to make the data stationary, then I can apply time-series otherwise it will not be possible for us.On the other hand, in order to apply the classification algorithm, I have to arrange the data set in a categorical form, in that case, I arranged our data categorically and applied the rest of the algorithm there except for linear regression. Since we have applied two types of machine learning algorithms in our work, we have tried to analyze our methodology steps through two graphs. So we first drew the methodology steps of time-series analysis and later drew separate methodology steps for classification algorithms. Figure 3.1 represents the Time Series steps of our methodology. We discussed data collection procedure in 3.2 section. Rest of the methodology steps are described below.
3.4.1.1 Data Preprocessing
We cannot use raw text data to feed our classifier model. Because sometimes raw text data have some characters or symbols which is not essential and suitable for our classifier model Since I have applied machine learning algorithms for analysis and prediction in my work. In this case, I have applied time series analysis for analysis and classified algorithms for prediction. So first of all it is better to say that for applying time-series analysis I Dependent variable needs to find out what changes over time. So I divided my dataset into two parts to applying time service analysis.
In the first part, I took time along with a number of cases along the y-axis, and also applied a classification algorithm. To do this, I converted the strings that were on the data set into numerical values by encoding and decoding so that machine learning can work very easily because to work with string values in machine learning, they must be converted to numerical numbers convert is to take.Apart from this, I did not have to do any data preprocessing work.
3.4.1.2 Checking Stationarity our Time Series Data:
First of all, I need to know what stationary means. A stationary series is one whose measurable properties like mean, change, and covariance doesn't differ with time or these details properties are not the capability of time that’s men constant mean and variance. All in all, stationarity in Time Series likewise implies a series without a Pattern or Occasional parts. Stationary series are very useful for statistical models and can be predicted precisely by it.
Types of Stationary Series,
(i)Strict Stationary (ii)Seasonal Stationary (iii)Trend stationary
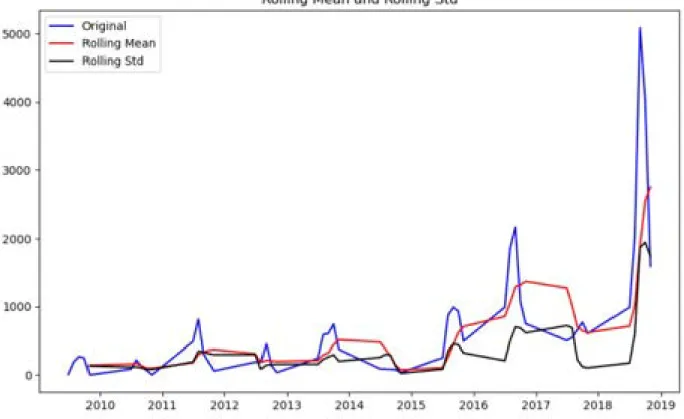
How we can check Stationarity, Stationarity can be checked in two ways I have checked the stationarity of my data set in two ways, first is Rolling Statistics and the second is Augmented Dickey-Fuller (ADF) Test. The ADF test expands the Dickey-Fuller test equation to include a high-order regressive process in the model.
𝒚𝒚
𝒕𝒕= 𝒄𝒄 + 𝜷𝜷
𝒕𝒕+ 𝜶𝜶𝒚𝒚
𝒕𝒕−𝟏𝟏+ 𝝋𝝋
𝟏𝟏𝜟𝜟𝒚𝒚
𝒕𝒕−𝟏𝟏+ 𝝋𝝋
𝟐𝟐𝜟𝜟𝒚𝒚
𝒕𝒕−𝟐𝟐+ ⋯ + 𝝋𝝋
𝒑𝒑𝜟𝜟𝒚𝒚
𝒕𝒕−𝒑𝒑+ 𝒆𝒆
𝒕𝒕Figure 3.2: Here is my ADF and Rolling Statistics test graph
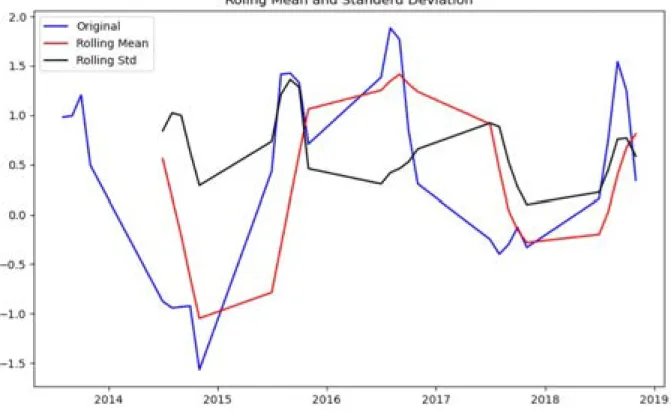
At rest I checked if there is constant mean and variance, I saw that my data set was not stationary.
Notice here that we have only added different terms, the rest of the equation remains the same.
This adds more thoroughness to the exam. The null hypothesis is very similar to the Dickey-Fuller test. So we have to remember that one key point is: Since the null hypothesis assumes the presence of unit root, i.e. α=1, the p-value obtained should be less than the significance level (say 0.05) so that null The hypothesis can be rejected. Thus, assuming that the series is stationary however, is a very common mistake that analysts make with this test. That is, if the p-value is less than the significance level, we consider the series to be unstable. So in Figure 3.1 I show my graph we can see our data is not Stationary because we get our p-value is 0.99 so we say our data is not Stationary. So first we make our data Stationary the we go next step of Time Series analysis.
3.4.1.3 Make Stationary in Time Series Data:
There are lots of ways to make data Stationery, such as a)Differencing and Seasonal differencing
b)Transformation c)Rolling statistics
First I apply Differencing and Seasonal differencing, the I get p-value is 1.58 which is not Stationary. Then secondly I apply three different Transformation such as
(i) Log Transformation
(ii) Square root Transformation (iii) Cubed root Transformation
I my data set we are trying this three Transformation. To apply Log transformation, we get p-value is 0.04 this is really good. Because we know that if p-value is less than 0.05 we will say our data is Stationary.
Figure 3.3: After the log Transform our data is Stationary now
So after Log Transformation we make our data stationary. Now we can decompose our data.
3.4.1.4 Decomposition Our Component for Time Series:
Time series decomposition divides a series into a combination of level, trend, seasonality and noise components.To decomposition, we will discover time series decomposition and how to automatically split a time series into its components with Python. After completing this decomposition, you will know:
Figure 3.4: Decomposition Our Component
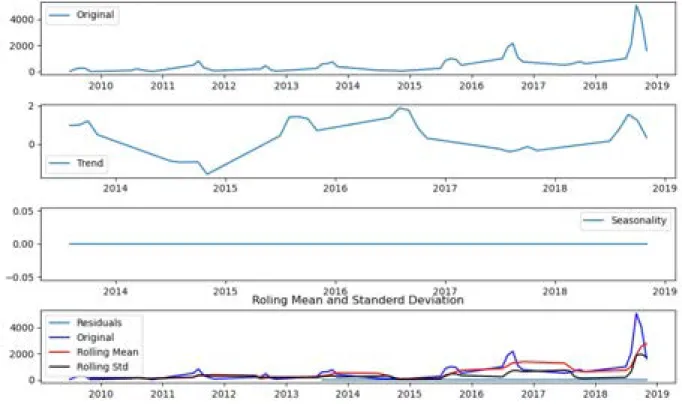
Here we look at the time series decomposition method of analysis and how it can help in forecasting. How to decompose additive and multiplicative time series problems and plot the results gives practical knowledge of the change in position of something over time.
A given time series is thought to consist of three systematic components including the Original, Trend, seasonality, and one non-systematic component called noise.
So in this figure we are see our components after decomposition our data set. Hear we see that our trend is Upward. And we also see the Seasonality is not in our data set.
These components are defined as below:
i) Original ii) Trend iii) Seasonality iv) Noise.
3.4.1.5 Calculate ACF and PACF for Time Series:
Autocorrelation examination is a significant stage in the Exploratory Information Examination of time series determining. The autocorrelation examination distinguishes examples and checks for haphazardness. It's particularly significant when you mean to utilize an autoregressive–moving- average (ARMA) model for gauging in light of the fact that it assists with deciding its boundaries.
The examination includes taking a gander at the Autocorrelation Function (ACF) and Partial Autocorrelation Function (PACF) plots. This article assists you with building an instinct for deciphering these ACF and PACF plots. We'll momentarily go over the essentials of the ACF and PACF. Nonetheless, as the emphasis lies on the translation of the plots, an itemized conversation of the hidden science is past the extent of this article. We'll allude to different assets all things being equal.If we auto-regressive (AR) model assumes that the current value (y_t) is dependent on the previous values (y_(t-1), y_(t-2), …). Given this assumption, we can construct a linear regression model.
𝒚𝒚�
𝒕𝒕= 𝜶𝜶
𝟏𝟏𝒚𝒚
𝒕𝒕−𝟏𝟏+ ⋯ + 𝜶𝜶
𝒑𝒑𝒚𝒚
𝒕𝒕−𝑷𝑷And the Moving Average (MA) model assumes that the current value (y_t) is dependent on the error terms including the current error (𝜖𝜖_t, 𝜖𝜖_(t-1),…). Since mistake terms are arbitrary, there's no direct connection between the ongoing worth and the blunder terms.
𝒚𝒚�
𝒕𝒕= 𝝐𝝐
𝒕𝒕+ 𝜷𝜷
𝟏𝟏𝝐𝝐
𝒕𝒕−𝟏𝟏+ ⋯ + 𝜷𝜷
𝒒𝒒𝝐𝝐
𝒕𝒕−𝒒𝒒3.4.1.6 Model Selection for Time Series Analysis:
ARIMA is made out of 'Auto Regressive Incorporated Moving Average is really a class of models that 'makes sense of a given time series in light of its own previous qualities, or at least, its own slacks and the slacked figure mistakes, so the condition can be utilized to conjecture future qualities. Find out about the boundaries of ARIMA and discuss its impediments,
Any 'non-occasional' time series that shows designs and is certainly not an irregular background noise be displayed with ARIMA models.
An ARIMA model has be 3 components that represent the AR, I and the MA terms: p, d, q where,
p is the representation of the AR term q is the representation of the MA term
d is the number of differences that we get to make the time series stationary. If a time series, has seasonal patterns, then you need to add seasonal terms, short for ‘Seasonal ARIMA’.
So, what does the ‘order of AR term’ even mean Before we go there, let’s first look at the ‘d’ term first we calculate ACF and PACF as we get q, p, and r values. So in our Time Series analysis I applying ARIMA
3.4.2 Proposed Methodology for classification problems:
Now we apply this classification algorithm, we make our own dataset. Though it is hard to find the increasing ret of Dengue Disease but try our level best to make our work accurate.
Figure 3.5: Proposed Methodology for classification algorithm
3.4.2.1 Data Preprocessing
We cannot use raw text data to feed our classifier model. Because sometimes raw text data have some characters or symbols which is not essential and suitable for our classifier model Since I have applied machine learning algorithms for analysis and prediction in my work. In this case, I have applied time series analysis for analysis and classified algorithms for prediction. First we have applied the time-series analysis, now we want to apply the classification algorithm, in that case we have to convert the Number of affected column of the data set to categorical value, in this case we have calculated the median from the data of the Number of affected column. Then based on the median, the Number of affected column of the entire data set is divided into two categories such as: a) Low number of affected b) High number of affected. After that, we applied logistic regression, DT, RF, KNN, and SVM algorithms.
3.4.2.2 Model Selection for classification problems:
To Classification problem hear I apply some classifier algorithm such as Simple Logistic regression, Decision Tree Classifier (DT), Random Forest Classifier (RF), K-Nearest Neighbors (KNN),Support Vector Machine (SVM),Naive Bayes Classifier (NB).
3.4.2.2.1 Simple Logistic regression (LR)
Logistic regression is the fitting relapse investigation to lead when the reliant variable is dichotomous (binary). Like all relapse examinations, calculated relapse is a prescient investigation.
Calculated relapse is utilized to depict information and make sense of the connection between a reliant parallel variable and at least one ostensible, ordinal, stretch, or proportion-level free factor.
Logistic regression generates high accuracy output for classification problem. In our work it performs very well and score best accuracy which is 72%. The confusion matrix for this classifier is [[02 00], [07 03]].
3.4.2.2.2 Decision Tree Classifier (DT)
Decision tree is used to solve both regression and classification problems. DT also works with continuous and categorical I/O (input/output) variables. Working approach if this algorithm is to make a tree. DT is a tree where every internal node of the tree represents the attribute values and
classification problem. In our work it performs very well and score best accuracy which is 61%.
The confusion matrix for this classifier is [[05 01], [09 02]].
3.4.2.2.3 Random Forest Classifier (RF)
Random forests are a machine learning algorithm that is used to solve regression and classification problems. These algorithms split the dataset into many parts and make many decision trees from datasets. It makes the decision or predicts the output based on the decision tree outcome which has the maximum probability of occurrences. For our dataset, it predicted the outcome 62% accurately with the confusion matrix [[09 03], [05 11]].
3.4.2.2.4 K-Nearest Neighbors (KNN)
K-nearest neighbor is the most used classification algorithm. It is also used in regression problems.
It works by calculating the distance between dependent variables (our expected result) and one or more independent variables (our features). For calculating the distance, it uses the Euclidean distance formula. In this algorithm, it creates a group by using similar data points which means which data point has a closer distance from the expected outcome. Based on the value of k (neighbors’ numbers) it decides much data it took to create a group. Here we use the value of k as 3. This algorithm cannot predict the outcome, it memorizes the created group and compares the test data with those groups, and generates an outcome. For this reason, it takes time to show the expected outcome. That’s why this is also known as a non-parametric and lazy algorithm. But our dataset performs pretty well with an accuracy of 62%. The output confusion matrix is [17, 05], [11 09].
3.4.2.2.5 Support Vector Machine (SVM)
It is a machine learning algorithm that is mostly used to solve regression and classification problems. But it is commonly used in classification problems. In the SVM algorithm, the data was plotted in a hyperplane with n-D space (where n is the feature number). Here we use a two- dimensional surface plane where the line separates the space into two different sections. One class is on one side and another class is on the other side of the space. These algorithms solve our classification problem with a medium 66% accuracy. The confusion matrix for this algorithm is
3.4.2.2.6 Naive Bayes Classifier (NB)
Naive Bayes is a classification algorithm that is also known as a simple probabilistic classifier.
Basically, this classifier is a set of classification algorithms that works based on Bayes' Theorem.
This classifier is not a single algorithm; this is actually a set of familiar classification algorithms where that share a common principle. In our research work, we used a Multinomial Naive Bayes classifier. Because Multinomial Naive Bayes performs very for text document data. Our work is related to text documents. This algorithm came with the highest accuracy for our dataset. This algorithm perfectly predicted our classes. The accuracy is 53% with the confusion matrix [[09 17], [07 18]].
3.4.3 Model Evaluation
Only based on training and testing accuracy we cannot evaluate our model. We need to consider some reports for evaluating our model. First of all, to get an accurate result from our model need to apply cross-validation. After that, we need to make a classification report for evaluating our model. The short description will discuss in the below subsections.
3.4.4.1 K-Fold Cross Validation
Cross-validation is a validation technique that helps us to evaluate the accurate accuracy of our model.
Because when we divide our dataset into train and test data, every time it divides our data randomly.
For this reason, sometimes test data consists of data that is not in train data. That's why sometimes we get less accuracy from our model. k-Fold cross-validation helps us to solve this problem. In this technique, there is a parameter(k) which is the number of folds that a dataset is divided into. Cross- validation randomly divides the dataset into k times and checks how well the model performs when it faces any randomly picked unseen test data. In our research work, we set the value of k as 5. Therefore, we use a 5-Fold cross-validation process in our research work.
3.4.4.2 Classification Report
Only based on the cross validation score we cannot tell that this model is best for this dataset.
Besides this we need to evaluate some parameters which are used to make classification reports.
These parameters are given below:
3.4.4.2.1 Confusion Matrix
It is a performance measure table which is mostly used to represent the performance of a machine learning model based on a set of test output data [15]. It checks the performance by calculating four terms such as, True Positive (TP), True Negative (TN), False Positive (FP) and False Negative (FN). We will describe briefly about this in the experiment and result segment.
3.4.4.2.2 Precision Score
Precision is a ratio of True Positive result and total Positive predictions. This is also known as PPV or positive predictive value.
Precision = TP / (TP + FP) --- (1) 3.4.4.2.3 Recall Score
It is the quotient of True positive result and the total number of actual predictions. Recall is known as true positive rate or sensitivity.
Recall = TP / (TP + FN) --- (2) 3.4.4.2.4 F1 Sore
It is also known as F1-measure. Basically, this is called the Fβ-score. Fβ-score is the combination of harmonic mean of precision score and recall score. When β = 1, this is called F1- score.
𝐹𝐹𝐹𝐹 − 𝑠𝑠𝑠𝑠𝑠𝑠𝑠𝑠𝑠𝑠= (1 +𝐹𝐹2). 𝑝𝑝𝑝𝑝𝑝𝑝𝑝𝑝𝑝𝑝𝑝𝑝𝑝𝑝𝑝𝑝𝑝𝑝.𝑝𝑝𝑝𝑝𝑝𝑝𝑟𝑟𝑟𝑟𝑟𝑟
𝛽𝛽2.𝑝𝑝𝑝𝑝𝑝𝑝𝑝𝑝𝑝𝑝𝑝𝑝𝑝𝑝𝑝𝑝𝑝𝑝+𝑝𝑝𝑝𝑝𝑝𝑝𝑟𝑟𝑟𝑟𝑟𝑟 --- (3) 𝐹𝐹1− 𝑠𝑠𝑠𝑠𝑠𝑠𝑠𝑠𝑠𝑠= 2. 𝑝𝑝𝑠𝑠𝑠𝑠𝑠𝑠𝑝𝑝𝑠𝑠𝑝𝑝𝑠𝑠𝑝𝑝.𝑠𝑠𝑠𝑠𝑠𝑠𝑟𝑟𝑟𝑟𝑟𝑟
𝐹𝐹2.𝑝𝑝𝑠𝑠𝑠𝑠𝑠𝑠𝑝𝑝𝑠𝑠𝑝𝑝𝑠𝑠𝑝𝑝+𝑠𝑠𝑠𝑠𝑠𝑠𝑟𝑟𝑟𝑟𝑟𝑟
3.5 Implementation Requirements
Our research title is “Dengue Disease analysis in Dhaka city using Machine Learning Techniques”, So many machine learning algorithms were applied to analyze my data set well, I had to use a well configured computer to run the albums well. To process and evaluate the entire work I need a high- configuration Computer setup with GPU and other necessary instruments. Below we mention the all hardware, software, and advanced tools which we need to complete this work.
Hardware and Software:
Intel Core i7 8th gen integrated with 24GB ram
1 TB Hard Disk
Google Colab with 12GB GPU and 350GB ram
High Speed Internet Connection Advance Libraries and Tools:
Windows 11
Python 3.10
Pandas
NumPy
Regular Expression (RE Library)
NLTK
Matplotlib
Scikit-Learn
CHAPTER 4
EX PERIMENTAL RESULTS AND DISCUSSION
4.1 Experimental Setup
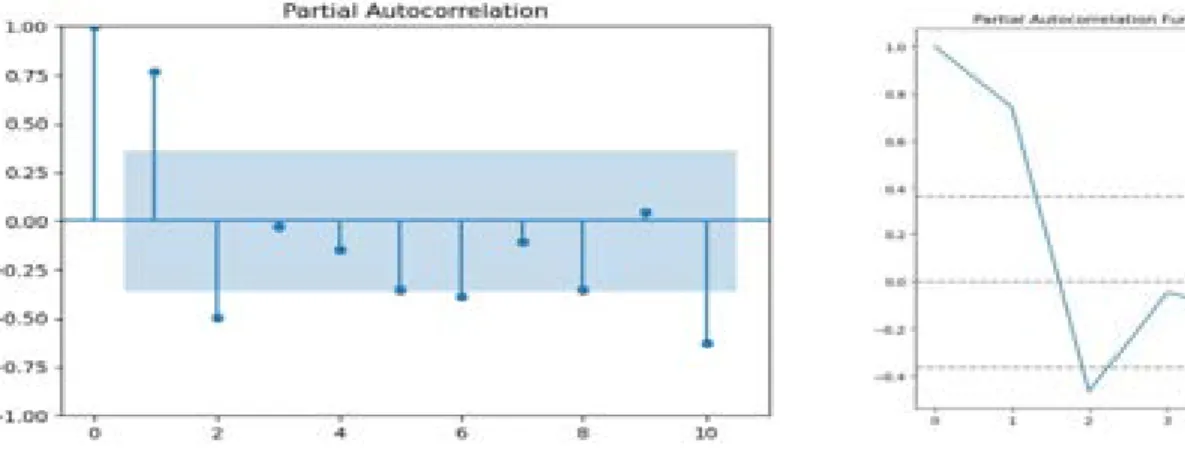
In this section, I am going to describe our model performance which we apply to our Dengu Disease Analysis dataset. In our work, First, I use Time series analysis then I use 5 classification algorithms which we already discussed in the Methodology section. All classification algorithms and forecasting algorithms perform very well but some of them classify our data accurately. When i try to apply Machine Learning algorithms to raw data, we found accuracy below 20%. After that, we preprocessed the raw data. In the Methodology section, we mentioned the technique we use to preprocess our data. Then we apply six machine learning algorithms to our clean data. In the Time series analysis, i get the RSS value is 0.4143 and also apply some Classifier algorithms that result in what is described now. Our LR, DT, NB, KNN, RF, and SVM models came with an accuracy of 72%, 61%, 53%, 62%,62%, and 66% respectively. These classifiers perform very well with text data. Table 4.1 shows the all-models accuracy with their cross-validation accuracy. Only based on the accuracy score we can’t consider our model as a perfect model for our dataset. For better judgment of our model, we generate a confusion matrix, classification report, and cross-validation score. Then we compare the all values for all models, then we finalize our results. So Now First i show Autocorrelation function(ACF) and Partial Autocorrelation Function(PACF). A function which gives us values of auto-correlation of any series with its lagged values is call ACF.
An indirect function to find Auto correlation after removing the relationship explained by previous lags its call PACF. Now draw see the result of PACF graph is below.
Figure 4.2: Partial Autocorrelation Function (PACF).
To using those ACF and PACF I got the Best p, q, d value,
Figure 4.3: Best Model value in ARIMA.
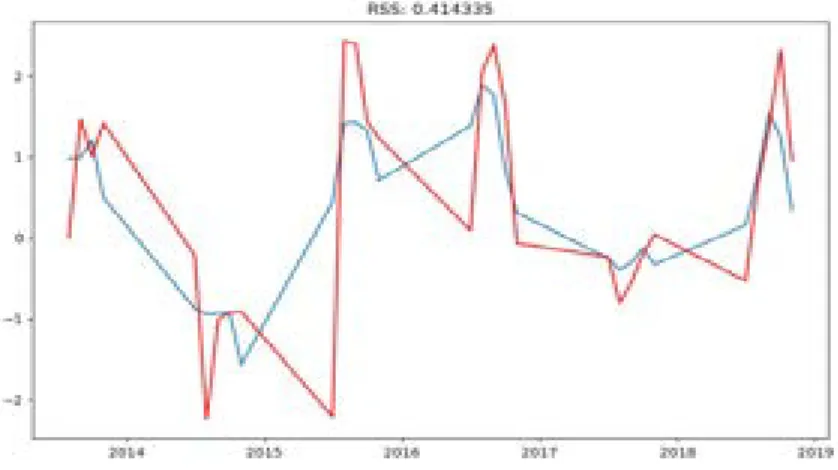
Here we got p=0, q= 2 and the d=0 If we use those value in ARIMA model we get the best fit line.
Now applying ARIMA Model I got the RSS value is 0.4143.
Figure 4.4: Appling ARIMA and draw the best fit line.
Now see our data analysis part that is appling in our model,
Figure 4.5: Dengue Disease affected per month 2009 to 2018
But 2019 we can see lots of people are affected in 2019.
Figure 4.6: Dengue Disease affected per month 2019
So here is my Dengue Disease forecasting part. Now I want to do some classifier analysis. In classifier analysis I apply some machine learning alogorithm.
Table 4.1: Model Accuracy Before Parameters Tuning
Model Name Accuracy Cross Validation Accuracy
Decision Tree 61% 59%
Random Forest 62% 59%
Naive Bayes 53% 50%
Logistics Regression 73% 70%
Support Vector Machine 66% 61%
K-Nearest Neighbors 62% 57%
4.2 Experimental Results and Analysis
Machine Learning models cannot predict everything with 100% accuracy. We need to try to get an optimal solution from our models. That’s why in our work I experiment with our models using some techniques like hyper parameter tuning. Hyper parameter tuning sometimes helps us to find the appropriate models’ parameters for our dataset. So, I decided to tune our models’ parameters based on our dataset. Then use hyper parameters tuning with help of the python library. Here I use GridSearchCV to tune our models. After tuning our models based on our dataset, we see that some algorithms' accuracy increased slightly and some of them decreased. Our LR, DT, RF, SVM, and KNN models came with the accuracy score of 73%, 41%, 27%, 46%, 62%, and 62% respectively after tuning our models. On the all-evaluation criteria, we found that Multinomial Naive Bayes (MNB) came out with highest accuracy for our dataset which is 85%.
Table 4.2: Model Parameters Information Model
Name
DT RF LR NB SVM KNN
Best Parameters
default random_state=10 n_estimators=1
Default default C = 25, gamma = 0.01, kernel = ‘rbf’
N_neighbors = 3, Weights = distance’
Accuracy 0.61 0.62 0.73 0.53 0.66 0.62
It is a performance measure table which is mostly used to represent the performance of a machine learning model based on a set of test output data. It checks the performance by calculating four terms such as, True Positive (TP), True Negative (TN), False Positive (FP) and False Negative (FN). We will describe briefly about this in the experiment and result segment.
Figure 4.7: Confusion Matrix of All Models
Table 4.3: Classification Report
Algorithms Name
Class Precision Score
Recall Score
F1 Score Accuracy Score
Cross Validation Score Decision tree Low number of
affected
0.36 0.83 0.70
0.61 0.59
High number of affected
0.67 0.18 0.69
Random Forest
Low number of affected
0.43 0.62 0.59
0.62 0.59
High number of affected
0.36 0.41 0.39
Logistics Regression
Low number of affected
0.22 1.00 0.36
0.72 0.70
High number of affected
1.00 0.30 0.46
Navie Bayes Low number of affected
0.56 0.35 0.43
0.53 0.50
High number of affected
0.51 0.72 0.60
Support vector machine
Low number of affected
0.45 1.00 0.62
0.66 0.61
High number of affected
1.00 0.04 0.07
K-nearest neighbors
Low number of affected
0.61 0.77 0.68
0.62 0.57
High number of affected
0.64 0.45 0.53
4.3 Discussion
A few days ago we saw that many people lost their lives in the terrible clutches of the Corona virus disease, then it seemed to me that the dengue disease was going to create a terrible situation among us even earlier than we have never actually considered it as a big concern, the results of which can be seen in the past. Many people are getting infected and dying from it since few years due to our
negligence as common people and our Ministry of Health has not identified it as an important problem. As time goes by it is seen that its spread is increasing if we look at it from 2009 10 to 2018. If we look at its spread, we will see how much influence it has spread over time in our country.Especially in 2019, there is no way to blanket it from an epidemic, the total number of infected has exceeded all other years and even many people are dying and we have identified a new one in 2019 which we named Chikungunya.It also has the same characteristics as Dengue, as a result of which the race is born in the body in a slightly different way, but the symptom is close.
In any case, I have finally managed to successfully analyze the dengue epidemic and I hope to give some insight into the country's health sector.Although I have noticed one thing that our country still needs a lot of research on dengue especially we know that there is no vaccine for dengue so maybe a research is very important from the side of medical science because of which many lives may be saved. In my research paper I mainly tried to analyze the spread of dengue which is affecting our society over time so I used machine learning language through which I tried to analyze about dengue.Here I have used many machine learning algorithms including time series to get an idea about the spread of dengue over time and also I have used some classified algorithms to get an idea about when the spread of dengue is high or low. Among Classifiers algorithms, Simple Logistics Regression and K-nearest neighbors performed best, with accuracies of 73% and 62%, respectively. Which I have described in detail in Table 4.3: Classification Report.
CHAPTER 5
IMPACT ON SOCIETY, ENVIRONMENT AND SUSTAINABILITY
5.1 Impact on Society
Dengue fever is a very important problem that is slowly affecting our society and if we do not take any action now, it can destroy our health sector. We need to raise awareness among ourselves without depending on the government of the country because we know that the main reason for the spread of dengue disease is that dengue mainly spreads from where the rain water accumulates around our house, so we must keep the area around our house clean and I hope This research of mine will help our health sector
5.2 Impact on Environment
As we are expecting that it will be a convenience project that will create a great impact on society then it must be having a great impact on the environment too. Because an environment is made with society & society made with people. If people are having adequate knowledge about their own language, then it also dominant in their environment. So, I can say that if we all come together to fight dengue fever then all of us in our society will benefit and I believe we can create awareness among the citizens to keep everything clean without rainwater going anywhere around our houses.
We can protect ourselves and society from this epidemic. We all have to come forward. If necessary, we can create some teams in our society to raise awareness. What steps to take to survive it and how they can protect someone else from it? Finally, we can deal with dengue fever not by saying a word but by awareness, so be aware yourself and create awareness while others are aware. In this, the country will live and the society will survive.
5.3 Ethical Aspects
All over the world, even with the triumph of technology, we face all kinds of obstacles. We have to overcome all the obstacles and move forward. Also, we have to think about how to achieve success by keeping ourselves moral as the health risk in society is making our people come out of it we must morally like self-awareness as well as awareness of others it has to be awakened in us.
1. To preventDengue we should come forward and fight everyone in our society.
2. To protect our Health sector.
3. Awareness should be raised among all.
4. Mutual cooperation should be increased.
5.4 Sustainability Plan
I have a big plan in the future which is to create a team and create awareness by going to different parts of the society.We have to keep a watchful eye so that the rain water does not accumulate anywhere and where there are polythene products we have to throw them in the right place because maximum time it is seen that water accumulates in various polythene products which results in the spread of Aedes mosquitoes. Profitably we need to sustain this expansion as we form a team and tackle it together.Also another big plan is to do a hospital based survey to publish a research paper on the extent to which the proper treatment is being implemented. It may face many challenges but I want to do another research paper on it in future.We all know that the condition of most of the government hospitals in Bangladesh is very deplorable and it is very sad that there is a lot of neglect of cleanliness around the hospital which is not desirable at all. Somewhat better they actually avoid government hospitals mainly because of not getting good treatment or feeling uncomfortable due to excessive disease.I myself suffered from dengue and went to Sir Salimullah Medical College, Dhaka, where I had a very bitter experience. Unfortunately, I didn't get any treatment there and finally got admitted to a private hospital which made me very sad the treatment in a private hospital is much better than in a government hospital maybe not everyone like me can afford this thing economically that's why I want to do a lot of research on this. So that there is a thought to work more on how to improve the quality of hospital-based treatment.