I | P a g e
ATTRIBUTES OF BATHAN CATTLE IN THE NORTHERN DISTRICTS OF BANGLADESH
A production report submitted in partial of the requirement for the fulfillment of the degree of Doctor of Veterinary Medicine (DVM)
A Production Report Submitted by
Md. Rasel Prank Roll No. 17/27 Registration No. 01852
Intern ID: 20 Session: 2016-2017
Faculty of Veterinary Medicine
Chattogram Veterinary and Animal Sciences University Chattogram-4225, Bangladesh
August 2022
II | P a g e
ATTRIBUTES OF BATHAN CATTLE IN THE NORTHERN DISTRICTS OF BANGLADESH
A production report submitted as per approved styles and contents Approved by
_________________________________
Supervisor
Prof. Md. Emran Hossain, PhD
Department of Animal Science and Nutrition
Faculty of Veterinary Medicine
Chattogram Veterinary and Animal Sciences University Chattogram-4225, Bangladesh
August 2022
III | P a g e Acknowledgement
The author is grateful to honorable Professor Dr. Mohammad Alamgir Hossain, Dean, Faculty of Veterinary Medicine of Chattogram Veterinary and Animal Sciences University and Professor Dr. A. K. M. Saifuddin, Director of External Affairs, Chattogram Veterinary and Animal Sciences University for arranging this type of research work as a compulsory part of this internship programmed.
The author expresses his sincere gratitude, humble respect heartfelt thanks to my internship Supervisor, Md. Emran Hossain, Professor, Department of Animal Science and Nutrition, Chattogram Veterinary and Animal Sciences University for his scholastic guidance, kind cooperation, sincere help, valuable suggestions, inspirations, who was involved with this study its inception. I ever remain grateful to him.
Authors are thankful to the bathan owners and workers of the study areas for their cooperation in participating and answering pre-formed questions about bathan rearing to meet to objectives of this study.
Finally, I would like to thank everybody who contributed to the course and expressing my apology that I couldn’t mention personally each one by one.
IV | P a g e
Table of Contents
Abstract ... 1
Introduction ... 2
Materials and methods ... 4
Study design, animals and housing ... 4
Study area... 4
Farm selection ... 4
Farmer’s interview ... 5
Data collection ... 5
Statistical analysis ... 5
Results ... 6
Herd management ... 6
Productive performance ... 7
Reproductive performance ... 10
Effects of genotype ... 12
Effects of parity... 14
Effect of grazing time ... 14
Marketing system of milk ... 15
Prospects and constraints ... 16
Discussion ... 21
Herd management ... 21
Productive performance ... 21
Birth weight ... 21
Live weight ... 22
Body condition score ... 22
Lactation length ... 22
Milk yield ... 23
Reproductive performance ... 23
Age at puberty ... 23
Age at first service ... 23
Age at first conception ... 24
Service per conception ... 24
Gestation period ... 24
Dry period ... 25
Post-partum period ... 25
Calving interval ... 25
Days open... 26
Effects of genotype ... 26
V | P a g e
Effects of parity... 27
Effect of grazing time ... 27
Marketing system of milk ... 28
Prospects and constraints ... 28
Conclusion ... 28
VI | P a g e
List of Abbreviation
AI - Artificial insemination BCS - Body condition score BDT - Bangladeshi taka CDC - Crossbred dairy cow
Cl - Calving interval d - Day
DMI - Dry matter intake
DMRT - Duncan’s new multiple range test DO - Days open
DP - Dry period
GLM - Generalized linear model h - Hour
Kg - Kilogram
kg/cow/d - Kilogram per cow per day Kg/d - Kilogram per day
l - Liter
l/d - Liter per day
L×HF - Local × Holstein Friesian
L×J×HF - Local × Jersey × Holstein Friesian L×SL×HF - Local × Sahiwal × Holstein Friesian
m - Month Max - Maximum
Min - Minimum no. - Number OR - Odds ratio
PC×HF - Pabna cattle × Holstein Friesian
PC×J×HF - Pabna cattle × Jersey × Holstein Friesian PC×SL×HF - Pabna cattle × Sahiwal × Holstein
Friesian
PPP - Post-partum period SE - Standard error
SPC - Service per conception USA - United states of America USD - United states dollar
VII | P a g e
List of Table
Table 1. Management systems of the crossbred dairy bathan cattle (N=245) ... 7 Table 2. Birth weight, live weight, body condition score, milk yield and lactation length of the crossbred dairy bathan cattle (N=245) ... 8 Table 3. Reproductive performance of the crossbred dairy bathan cattle (N=245) ... 10
List of Figure
Figure 1. Bathan system of crossbred dairy cattle production in the northern districts of Bangladesh (N=245) ... 3 Figure 2. Effects of birth weight (kg), live weight (kg), body condition score (BCS, 1-5 scale), grazing area (area), concentrate supply (kg/d) and post-partum period (day) on milk yield (litter/lactation) of the cross-bred dairy cattle (N=245) ... 9 Figure 3. Central composite design response surface model showing optimized zone of milk yield (litter/lactation), live weight (kg) and dry period (day) (bottom) of the CDC (N=245) ... 9 Figure 4. Colormap showing multiple correlation coefficient matrix of the productive and reproductive parameters of the CDC (N=245)... 11 Figure 5. Principal component analysis showing dimensionality and latent trends of the components exhibiting variability of milk yield plotted on ‘x’ as component 1 (61.6%) and ‘y’
as component 2 (34.8%) ... 11 Figure 6. Central composite design response surface model showing optimized zone of milk yield (litter/lactation), age at first conception (day) and calving interval (day) of the cross-bred dairy cattle (N=245) ... 12 Figure 7. Effect of genotype on milk yield (litter/lactation) of the cross-bred dairy cattle in pertinent to their live weight (N=245) ... 13 Figure 8. Boxplot showing effects of live weight (kg) on milk yield (litter/lactation) of the cross-bred dairy cattle (N=245) ... 14 Figure 9. Bivariate simple linear regression showing effect of grazing time on age at puberty (top left, month), post-partum period (top right, day), grazing time (bottom left, hour) and calving interval (bottom right, day) of the cross-bred dairy cattle (N=245) ... 15 Figure 10. Milk pricing system and buyers of milk of the cross-bred dairy cattle in the bathan cattle of Shahjadpur upazila, Sirajganj, Bangladesh (N=245) ... 16
VIII | P a g e Figure 11. Word cloud showing prospects (top) and constraints (bottom) of bathan cattle production in the Shahjadpur upazila, Sirajganj, Bangladesh (N=245)... 17 Figure 12. Mosaic plot showing effects of using feed additives on the proportion of udder edema (left) and mastitis (right) of the cross-bred dairy cattle (N=245) ... 17 Figure 13. Bivariate logistic regression showing effects of milk yield (litter), live weight (kg), grazing area (acre) and birth weight (kg) on the probability of mastitis of the cross-bred dairy cattle (N=245) ... 18 Figure 14. Bivariate logistic regression showing effects of live weight (kg), milk yield (litter), dry period (d) and grazing area (acre) on the probability of udder edema of the cross-bred dairy cattle (N=245) ... 19 Figure 15. Bivariate logistic regression showing effects of service per conception (no), calving interval (day), days open (day) and age at first conception (month) of the cross-bred dairy cattle (N=245) ... 20 Figure 16. Bubble plot showing effects of live weight (kg) and milk yield (litter) on udder edema (indicated by bubble size) of the bathan cross-bred dairy cattle (N=245) ... 21
1 | P a g e Attributes of ‘bathan’ cattle in the northern districts of Bangladesh
Abstract
The objective of the study was to clarify attributes of ‘bathan’ cattle production in the northern districts of Bangladesh. A cross sectional survey was conducted on 245 crossbred dairy cattle (CDC) from 17 bathans in Shahjadpur upazila, Sirajganj, Bangladesh for a period of 12 months from July 2021 to June 2022. Results indicated that the average herd size of the bathan was 112.5±4.5 cattle. Mean birth weight and live weight of the bathan CDC was 29.5±0.6 kg and 331.3±3.5 kg, respectively. Mean body condition score was 2.8±0.0, 3.1±0.0, 3.4±0.0, 3.4±0.0, 3.1±0.0 and 2.9±0.0 for the 1st, 2nd, 3rd, 4th, 5th and 6th parities, respectively. Mean lactation length 248.0±0.8 d and milk yield per lactation was 2831.9±41.5 l. The milk yield was strongly influenced by the genotype, live weight, body condition score, grazing area and the amount of concentrate supplied. Overall, the L×HF75% genotype produced 45.4%, 38.2%, 26.3%, 22.4%, 12.5%, 2.9% and 2.8% more milk per lactation compared with PC×HF25%, L×HF25%, PC×SL×HF50%, PC×J×HF50%, L×HF50%, L×SL×HF50% and L×J×HF50% genotypes, respectively which was 29.7% higher in parity 4 compared with parity 1. Mean age at puberty of the bathan CDC was 576.0±0.3 d, age at first service 579.0±0.3 d, age at 1st conception 597.0±0.3 d, number of services per conception 1.4±0.0, gestation period 276.8±0.3 d, dry period 67.1±0.6 d, post-partum period 67.6±1.9 d, days open 101.0±2.2 d and calving interval was 354.8±2.2 d. The age at puberty, age at first conception and calving interval constituted the highest eigenvectors controlling maximum variability for the milk yield. An increased grazing time significantly reduced age at puberty (P=0.024), post-partum period (p=0.018), days open (p=0.002) and calving interval (p=0.0036) of the CDC. An increased probability of mastitis, udder edema and infertility were associated with increased milk yield, live weight, dry period and calving interval.
Keywords: Crossbred dairy cattle, bathan, productive and reproductive performance, milk yield, prospects and constraints.
2 | P a g e Introduction
The ‘bathan’ is a nearly extinct agrarian herding colony of the village cattle. A particular category of village cowboy usually maintains bathan in the riverain seasonal pasture and barren croplands (Figure 1). The fallow government land is normally used as the suitable site for the bathan. Because the quantity of government land is diminishing over time, the system of maintaining bathan is also declining. However, bathans are still noticeable in some haor basins, newly formed chars and offshore islands of Bangladesh. In Sylhet, Habiganj, Netrokona and Kishoreganj, temporary bathan settlements are common in the winter season near the haor beds which are dismantled during the monsoon season due to flood water. The bathans are then transferred to the new highlands of the hilly areas where grasses and leaves grow in the monsoon. Like haor basins, huge number of bathans have been established in the Baghabarighat and ‘Chalan beel’ areas of Pabna and Sirajganj districts where a number of milk processing industries have been developed recently.
Baghabarighat milk shed areas located in the northern riverain parts of Bangladesh are famous for the largest cooperative milk pocket known as Bangladesh Milk Producers’ Co-Operative Union Limited (Milk vita) based on bathan cattle. The two-thirds of the country’s total milk are produced in those areas (M. S. Islam et al., 2017). During British period, the inhabitants of those areas were active in raising high-yielding dairy cows because of the abundance of seasonal riverside pasture land. High yielding dairy cattle were raised in those areas using imported purebred bulls and the semen of a variety of temperate breeds, including Holstein Friesian, Jersey, Sahiwal and Pabna cattle (Khan, 2009). Under initiatives of milk vita, frozen semen was imported from New Zealand, Australia, USA, Pakistan and India and distributed among those areas to develop upgraded CDC for increased milk yield. Hence, the cattle in those areas exhibit higher levels of temperate dairy heredity with comparatively better milk production than the other regions of Bangladesh (Hossen et al., 2012).
3 | P a g e Figure 1. Bathan system of crossbred dairy cattle production in the northern districts of Bangladesh (N=245)
Previous studies highlighted that increased milk yield from the CDC might be optimized at the expense of genetic dilution if the population of CDC could be increased (Huque, 2014). Hence, the volume of milk produced from milk vita has been increasing day by day in bathan cattle because the majority of the bathan CDC are crossbreds of local Pabna cattle and Holstein- Friesian (Rahman et al., 2015). However, this random genetic mixing and unintentional artificial insemination between or among breeds of those bathan cattle are imposing a direct or indirect impact on productive performance, reproductive efficiency, farm profitability and the growth of the national economy (M. N. Islam et al., 2020). Hence, it is important to know the productive and reproductive traits of the bathan CDC for evaluation of their performance.
Although several studies have been done in the Baghabari milk vita areas, little attention has been made in a systemic way. Therefore, the goal of this study was to figure out attributes of the CDC raised in the bathan of the northern districts of Bangladesh.
4 | P a g e Materials and methods
Study design, animals and housing
From July 2021 to June 2022, a descriptive cross-sectional survey was conducted over of 12 months. The research locations were chosen from two villages (Resombary and Jaljary) in the Shahjadpur Sub-district of Sirajganj based on large livestock rearing in the Bathan. Most of the cattle in Bathan are Friesian cross and black white in coat colour. November to June, they are maintained in a loose housing system on the unpaved floor, once or twice cleaning the shed without a cleaning agent and during this period they utilize jute-wood, shon and other materials as roofs. The remainder of the time, the bricks are set on the floor without a mat and the shed is cleaned twice with only water, the second time with a tin roof.
Study area
In Bangladesh's Rajshahi Division, Sirajgonj is a district in the North Bengal area. It is a vital economic district in Bangladesh. It is flanked on the north by Bogra district, on the south by Pabna and Manikganj districts, on the east by Tangail and Jamalpur districts and on the west by Pabna, Natore and Bogra districts. The study focused on locations along the Pabna district's border and bathan settlements along the Gumani River's bank (Dalay nodir gat) in Shahjadpur sub-district. That location has the most grazing acreage under the milk vita and is very close to the river's bank. Shahjadpur sub-district has a land area of 324.47 square kilometers and is located between 24°04' and 24°25' north latitudes and 89°31' and 89°31' east longitudes. In Shahjadpur, the maximum average temperature is 36°C in April and the lowest is 26°C in January. A year's rainfall is around 1201 mm, with an average humidity of 66%.
Farm selection
Total 17 bathans were chosen at random from two villages in the Shahjadpur sub-district. The bathan was chosen using a simple random sampling process. Bathans with at least 10 years of raising expertise, at least five cross-bred cows to complete the sixth parity and who stay on the riverbank from November to June are chosen for the research.
5 | P a g e Farmer’s interview
One interviewer received training in surveying, interviewing, and contacting farmers, as well as how to fill out a questionnaire form for the research, all of which were taught at Chattogram Veterinary and Animal Sciences University. To be thorough, one interviewer only interviewed three bathans every day. Face-to-face questions were asked to fill out a pre-made questionnaire.
The interviews with the bathan owners and laborers who had worked on the same farm for ten years took around one and a half to two hours. Between the two consecutive interviews, a 20–
30-minute break was taken. During the farm tour, each cross-bred cow was observed, and photographs were taken.
Data collection
Previously, a field survey, a structured questionnaire and a survey methodology were designed to fulfil certain goals. Following a briefing on the interview's aims, respondents' verbal and written consents were obtained. Prior to final data gathering, data are acquired experimentally from a farm. It eliminates some unneeded and long queries. Finally, the respondents' comments and ideas were used to refine and update the questionnaire while it was in the field. A total of 245 crossbred cow data were gathered, including birth weight, live weight, body condition score, lactation length, milk yield, age at puberty, age at first service, age at first conception, service per conception, gestation period, dry period, post-partum, days open, calving interval, reproductive disorder, and disease state.
Statistical analysis
Raw data were compiled into Microsoft excel professional 2020 (Microsoft corporation, USA).
Outliers and multi-collinearity in the data set were tested by inter quartile range test and variance inflation factors. Normality of the response variable was checked by Shapiro Wilk test. The data were analyzed by generalized linear model (GLM). Heatmap of multiple orthogonal contrasts were produced to check the dimensionality and strengths of the co- variates. Kaiser-Meyer-Olkin measures of sampling adequacy and Bartlett’s test of sphericity were applied to test the suitability of the dataset for the principal component analysis The linear regression and response surface models were fitted using SAS 16.1.0 (SAS Institute Inc.).
When statistical effects were deemed significant (P<0.05), the Duncan’s New Multiple Range
6 | P a g e Test (DMRT) was used to compare the means. All statistical tests were performed by using Stata 14.1 SE (Stata Corp LP, College Station, Texas, USA). The following model was used to estimate the effects of the predictors on dependent variables:
Yijkln = µ0 + αij + βik + γil +…… ωin + Ɛijlkn
Where,
Yijkln = The observed effect of the trait ‘i’ at the ‘jth’ level of the predictor ‘α’, the
‘kth’level of the predictor ‘β’, ‘lth’ level of the predictor ‘γ’……and the ‘nth’ level of the predictor ‘ω’;
µ0 = The intercept of the regression model;
αij = The slope of the regression model for the trait ‘i’ at ‘jth’ level of the predictor ‘α’ observed on Yijkln;
βik = The slope of the regression model for the trait ‘i’ at ‘kth’ level of the predictor ‘β’ observed on Yijkln;
γil = The slope of the regression model for the trait ‘i’ at ‘lth’ level of the predictor ‘γ’ observed on Yijkln;
ωin = The slope of the regression model for the trait ‘i’ at ‘nth’ level of the predictor ‘ω’ observed on Yijkln;
Ɛijkln = The random sampling error of the trait ‘i’ at the ‘jth’ level of the predictor
‘α’, the ‘kth’level of the predictor ‘β’, ‘lth’ of the predictor ‘γ’……the ‘nth’ level of the predictor ‘ω’ which is distributed as Ɛi ̴ NID (0, σ2).
Results
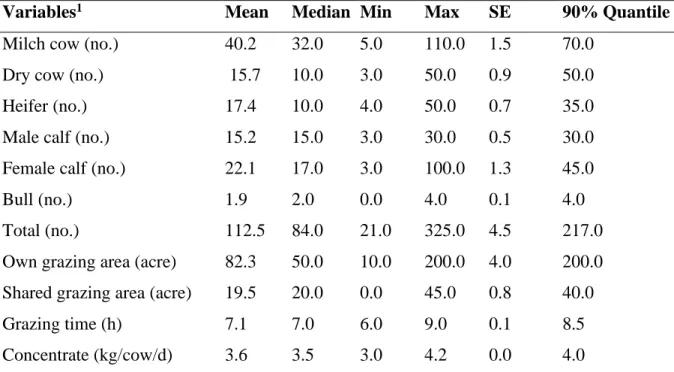
Herd management
The average bathan herd size was 112.5±4.5 cattle which consisted of milch cow (40.2±1.5), dry cow (15.7±0.9), heifer (17.4±0.7), male calf (15.2±0.5) and female calf (22.1±1.3) (Table 1). Own and shared pasture area per bathan was 82.3±4.0 and 19.5±0.8 acres, respectively.
Matikalai and Khesari were the main seasonal fodder cultivated during November to February.
Durba grass (Cynodon dactylon) was predominant during March to June. Animals were grazed twice a day, i.e., in the morning and afternoon. Average grazing time was 7.1±0.1 h on pasture.
Concentrate mixture was provided in the large round-shaped manger once a day at midday.
During the monsoon (July to October), the animals were transferred from riverbanks to the
7 | P a g e high land and fed only straw and 3.6±0.0 kg of concentrate per cow twice a day. Before grazing, the cows were hand milked twice a day once in the morning and another in the afternoon.
Milking was completed tying the calf to her mother's front leg. For milking, mustard oil was used as lubricant. After birth, the calf was given colostrum either directly from the dam's udder or through a bottle. After grazing in the morning, all animals were forced to bath in the river to overcome heat stress.
Table 1. Management systems of the crossbred dairy bathan cattle (N=245).
1Min = Minimum; Max = Maximum; SE = Standard error
Productive performance
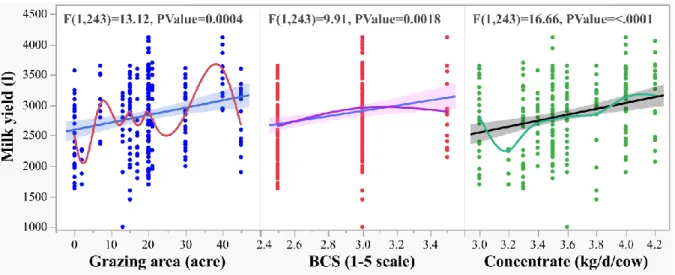
Mean birth weight and live weight of the bathan CDC was 29.5±0.6 kg and 331.3±3.5 kg, respectively. Mean body condition score was 2.8±0.0, 3.1±0.0, 3.4±0.0, 3.4±0.0, 3.1±0.0 and 2.9±0.0 for the 1st, 2nd, 3rd, 4th, 5th and 6th parities, respectively (Table 2). Lactation length was 248.0±0.8 d and milk yield per lactation was 2831.9±41.5 l. The milk yield was strongly influenced by the birth weight (P=0.002), live weight (P<0.001) and body condition score (P=0.001) (Figure 2-3).
Variables1 Mean Median Min Max SE 90% Quantile
Milch cow (no.) 40.2 32.0 5.0 110.0 1.5 70.0
Dry cow (no.) 15.7 10.0 3.0 50.0 0.9 50.0
Heifer (no.) 17.4 10.0 4.0 50.0 0.7 35.0
Male calf (no.) 15.2 15.0 3.0 30.0 0.5 30.0
Female calf (no.) 22.1 17.0 3.0 100.0 1.3 45.0
Bull (no.) 1.9 2.0 0.0 4.0 0.1 4.0
Total (no.) 112.5 84.0 21.0 325.0 4.5 217.0
Own grazing area (acre) 82.3 50.0 10.0 200.0 4.0 200.0 Shared grazing area (acre) 19.5 20.0 0.0 45.0 0.8 40.0
Grazing time (h) 7.1 7.0 6.0 9.0 0.1 8.5
Concentrate (kg/cow/d) 3.6 3.5 3.0 4.2 0.0 4.0
8 | P a g e Table 2. Birth weight, live weight, body condition score, milk yield and lactation length of the crossbred dairy bathan cattle (N=245).
1Min = Minimum, Max = Maximum, SE = Standard error
Variables1 Mean Median Min Max SE 90% quantile
Birth weight (kg) 29.5 30.0 12.0 50.0 0.6 41.4
Live weight (kg) 331.3 320.0 150.0 480.0 3.5 400.0
BCS at 1st parity 2.8 3.0 2.5 3.5 0.0 3.0
BCS at 2nd parity 3.1 3.0 2.5 3.5 0.0 3.5
BCS at 3rd parity 3.4 3.5 2.5 3.5 0.0 3.5
BCS at 4th parity 3.4 3.5 3.0 4.0 0.0 3.5
BCS at 5th parity 3.1 3.0 2.5 4.0 0.0 3.5
BCS at 6th parity 2.9 3.0 2.5 3.5 0.0 3.5
Milk yield at 1st parity 2273.9 2150.0 1725.0 3420.0 28.6 3270.0 Milk yield at 2nd parity 2676.8 2450.0 1900.0 3860.0 35.8 3570.0 Milk yield at 3rd parity 2964.9 2800.0 1800.0 4230.0 44.9 4050.0 Milk yield at 4th parity 3232.8 2790.0 2180.0 4830.0 48.7 4260.0 Milk yield at 5th parity 2869.5 2820.0 1810.0 3960.0 46.6 3870.0 Milk yield at 6th parity 2382.1 2260.0 1150.0 3818.0 42.6 3410.0 Milk yield/lactation (l) 2831.9 2910.0 1150.0 5080.0 41.5 3585.0 Lactation length (d) 248.0 245.0 210.0 280.0 0.8 270.0
9 | P a g e Figure 2. Effects of birth weight (kg), live weight (kg), body condition score (BCS, 1-5 scale), grazing area (area), concentrate supply (kg/d) and post-partum period (day) on milk yield (litter/lactation) of the cross-bred dairy cattle (N=245).
Figure 3. Central composite design response surface model showing optimized zone of milk yield (litter/lactation), live weight (kg) and dry period (day) (bottom) of the CDC (N=245).
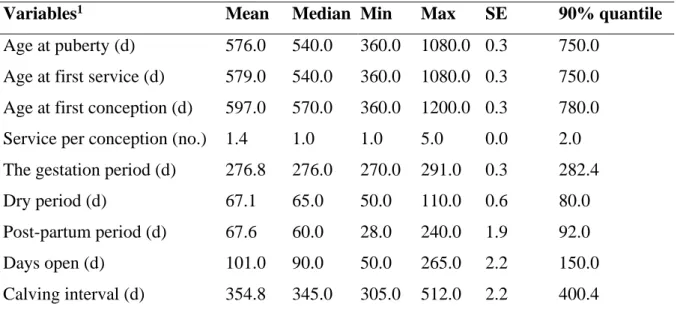
10 | P a g e Reproductive performance
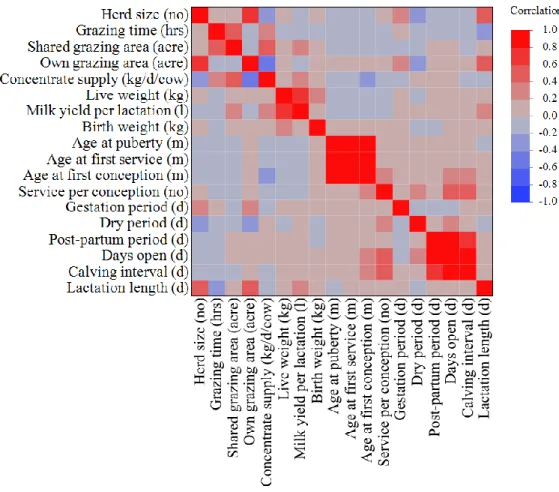
Mean age at puberty of the bathan CDC was 576.0±0.3 d. Mean age at first service was 579.0±0.3 d, mean age at 1st conception 597.0±0.3 d, number of services per conception 1.4±0.0, gestation period 276.8±0.3 d, dry period 67.1±0.6 d, post-partum period 67.6±1.9 d, mean days open 101.0±2.2 d and calving interval was 354.8±2.2 d (Table 3). There was a strong relationship among age at puberty, age at first conception and calving interval which had the highest eigenvectors contributing maximum variability for the principal component 1 (61.6%) and 2 (34.8%) (Figure 4-6).
Table 3. Reproductive performance of the crossbred dairy bathan cattle (N=245).
1Min = Minimum, Max = Maximum, SE = Standard error
Variables1 Mean Median Min Max SE 90% quantile
Age at puberty (d) 576.0 540.0 360.0 1080.0 0.3 750.0 Age at first service (d) 579.0 540.0 360.0 1080.0 0.3 750.0 Age at first conception (d) 597.0 570.0 360.0 1200.0 0.3 780.0 Service per conception (no.) 1.4 1.0 1.0 5.0 0.0 2.0 The gestation period (d) 276.8 276.0 270.0 291.0 0.3 282.4
Dry period (d) 67.1 65.0 50.0 110.0 0.6 80.0
Post-partum period (d) 67.6 60.0 28.0 240.0 1.9 92.0
Days open (d) 101.0 90.0 50.0 265.0 2.2 150.0
Calving interval (d) 354.8 345.0 305.0 512.0 2.2 400.4
11 | P a g e Figure 4. Colormap showing multiple correlation coefficient matrix of the productive and reproductive parameters of the CDC (N=245).
Figure 5. Principal component analysis showing dimensionality and latent trends of the components exhibiting variability of milk yield plotted on ‘x’ as component 1 (61.6%) and ‘y’
as component 2 (34.8%).
12 | P a g e Figure 6. Central composite design response surface model showing optimized zone of milk yield (litter/lactation), age at first conception (day) and calving interval (day) of the cross-bred dairy cattle (N=245).
Effects of genotype
Milk yield significantly (p<0.01) differed due to genotype. The L×HF75% genotype produced 45.4%, 38.2%, 26.3%, 22.4%, 12.5%, 2.9% and 2.8% more milk per lactation compared with PC×HF25%, L×HF25%, PC×SL×HF50%, PC×J×HF50%, L×HF50%, L×SL×HF50% and L×J×HF50% genotypes, respectively (Figure 7).
13 | P a g e Figure 7. Effect of genotype on milk yield (litter/lactation) of the cross-bred dairy cattle in pertinent to their live weight (N=245).
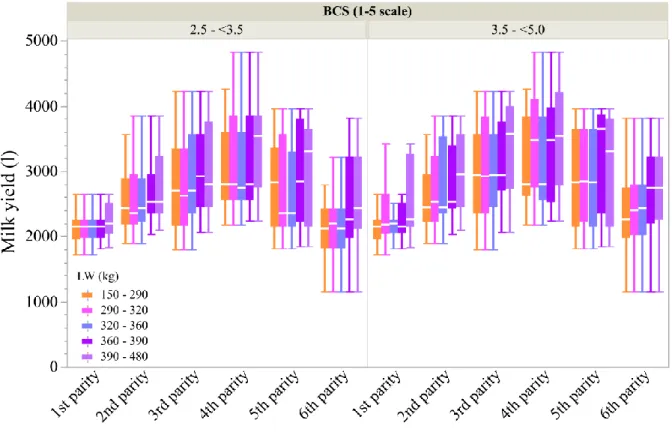
14 | P a g e Effects of parity
The mean milk yield per lactation was highest in the 4th parity (3232.8±48.7 l) and lowest in the 1st parity (2273.9±28.6 l) (Table 2; Figure 8).
Figure 8. Boxplot showing effects of live weight (kg) on milk yield (litter/lactation) of the cross-bred dairy cattle (N=245).
Effect of grazing time
Grazing time substantially influenced reproductive performance of the CDC. An increased grazing time significantly reduced age at puberty (P=0.024), post-partum period (P=0.018), days open (P=0.002) and calving interval (P=0.003) of the CDC (Figure 9).
15 | P a g e Figure 9. Bivariate simple linear regression showing effect of grazing time on age at puberty (top left, month), post-partum period (top right, day), grazing time (bottom left, hour) and calving interval (bottom right, day) of the cross-bred dairy cattle (N=245).
Marketing system of milk
Pricing system of milk was mainly fat% followed by volume. Milk vita was the principal buyer of raw milk followed by local goala, organized industry and local customer (Figure 10).
16 | P a g e Figure 10. Milk pricing system and buyers of milk of the cross-bred dairy cattle in the bathan cattle of Shahjadpur upazila, Sirajganj, Bangladesh (N=245).
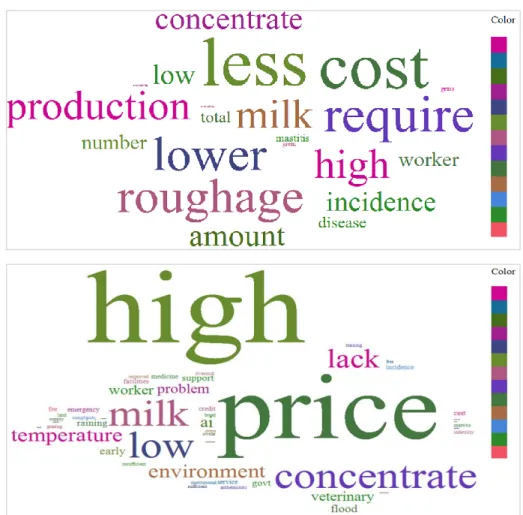
Prospects and constraints
The less cost of available seasonal roughage production, high production of raw milk, lower concentrate requirement, lower number of worker requirement and reduced incidence of disease were the main prospects of rearing CDC in the bathan (Figure 11). High price of concentrate, low price of milk, high environmental temperature and problem of artificial insemination were the main constraints of bathan CDC production. Use of additive substantially reduced udder edema (Figure 12). Increased milk yield (p<0.001; OR=3331.4), live weight of dam (p<0.001; OR=247.7), amount of grazing area (p=0.003; OR=3.2) and birth weight of calf (p=0.009; OR=4.0) were associated with increased probability of mastitis (Figure 13). Similarly, increased live weight of dam (p<0.001; OR=45.0), milk yield (p<0.001;
OR=65.5), dry period (p=0.013; OR=0.08) and grazing area (p=0.004; OR=3.2) elevated possibility of udder edema (Figure 14,16). Accordingly, increased service per conception (p<0.001; OR=205.4), calving interval (p<0.001; OR=2516.2), days open (p<0.001;
OR=505.7) and age at first conception (p<0.001; OR=32.4) were related to the increased probability of infertility (Figure 15).
17 | P a g e Figure 11. Word cloud showing prospects (top) and constraints (bottom) of bathan cattle production in the Shahjadpur upazila, Sirajganj, Bangladesh (N=245).
Figure 12. Mosaic plot showing effects of using feed additives on the proportion of udder edema (left) and mastitis (right) of the cross-bred dairy cattle (N=245).
18 | P a g e Figure 13. Bivariate logistic regression showing effects of milk yield (litter), live weight (kg), grazing area (acre) and birth weight (kg) on the probability of mastitis of the cross-bred dairy cattle (N=245).
19 | P a g e Figure 14. Bivariate logistic regression showing effects of live weight (kg), milk yield (litter), dry period (d) and grazing area (acre) on the probability of udder edema of the cross-bred dairy cattle (N=245).
20 | P a g e Figure 15. Bivariate logistic regression showing effects of service per conception (no.), calving interval (day), days open (day) and age at first conception (month) of the cross-bred dairy cattle (N=245).
21 | P a g e Figure 16. Bubble plot showing effects of live weight (kg) and milk yield (litter) on udder edema (indicated by bubble size) of the bathan cross-bred dairy cattle (N=245).
Discussion
Herd management
Our study identified that the bathan CDC providing maximum nutrients by supplying wheat bran, til oil cake, maize, rice polish and commercial mix in addition to pasture grazing yielded maximum milk. Previous studies reported that the quantity of pasture feeds was one of the most important elements influencing increase of milk yield (İnal et al., 2001). It was further reported that increasing the total amount of concentrate resulted in increased milk yield of the CDC.
Consistent with our results, Lawrence et al. (2015) further reported that by increasing the amount of concentrate supplied, cows consumed more energy and had the higher total dry matter intake which eventually enhanced milk yield by reducing negative energy balance and improving body condition score. Increased dry matter intake causes the rumen to produce more volatile fatty acids (Nikkhah et al., 2008) leading to an increase in the conversion of butyrate to β-hydroxybutyric acid which eventually increases milk yield (Reynolds, 2002).
Productive performance
Birth weight
In the study we observed that the average birth weight of the CDC calf was 29.5 kg with a minimum of 12.0 kg and a maximum of 50.0 kg. The result is supported by Dhakal et al. (2013) who reported that the average birth weight of crossbred calf was 29.4 kg with a minimum of 16.6 kg and a maximum of 53.5 in case of CDC. Islam et al. (2017) further reported that the mean birth weight of the Australian Friesian×Sahiwal CDC was 30.0±1.1 kg at the central cattle breeding and dairy farm in Savar, Bangladesh. They further reported that the birth weight was influenced by the genotype of the breed, management, genetic factor, feeding practices and physiological status of the cow. We further observed that the CDC with higher birth weight produced more milk than those with lower birth weight. Similar results were reported elsewhere (Hasan et al., 2014; Lamb & Barker, 1975).
22 | P a g e Live weight
Our study revealed that the mean live weight of the CDC was 331.3 kg which ranged from 150.0 to 480.0 kg. The result was supported by Saha et al. (2016) who reported that the average live weight of the Friesian CDC was 307.5±65.5 kg. Closely similar result was further reported by Handcock et al. (2019a) where mean live weight of the CDC was 343.4 kg. We observed that the average milk yield per lactation of the CDC depended on her weight, i.e., the higher live weight CDC had a higher milk yield and the vice versa. Closely consistent result was reported in previous studies (Handcock et al., 2019b; M. S. Islam et al., 2017). According to Islam et al. (2017), the milk yield of the CDC from 200 to below 300 kg, 300 to below 400 kg and 400 to 570 kg live weight was 8.9 l/d, 12.7 l/d and 18.8 l/d, respectively.
Body condition score
The mean BCS of the CDC was was 2.8±0.0, 3.1±0.0, 3.4±0.0, 3.4±0.0, 3.1±0.0 and 2.9±0.0 for the 1st, 2nd, 3rd, 4th, 5th and 6th parities, respectively. The result was supported by Truman et al. (2022) who reported that for parity 1, 2, 3, 4 and ≥5, the mean BCS was 3.1, 3.4, 3.4, 3.5 and 3.4, respectively. Close associations between BCS and parity are commonly accepted phenomena (Waltner et al., 1993). The genotype of the CDC, volume of milk produced, nutritional variations and exposure to the pasture influence the dry matter intake, energy balance and thereby BCS of the CDC (Truman et al., 2022). We further observed positive relationship between milk yield and BCS of the CDC which was supported by Berry et al.
(2007) who reported that the heavier cows produced comparatively better milk.
Lactation length
In the present study the average lactation length of the CDC was 248.0 d. This result was supported by Miazi et al. (2008) who reported that the average lactation length of the CDC was 246.1±6.7 d. In another study, Mamun et al., (2015) reported that the lactation length of the Friesian CDC was 257.5±14.2 d. The lactation length between Friesian CDC and indigenous cows differs significantly because of differences in genotype, management practices of herd and other environmental factors (Sarder et al., 2007).
23 | P a g e Milk yield
The mean milk yield per lactation in our study was 2831.9±41.5 l. Closely consistent result was reported by (Khan, 2009) where average milk yield was 2990 litter per lactation.
Accordingly, Huque, (2014) found 2661.0 l for the Friesian CDC. Contrastingly, Kiwuwa et al. (1983) reported 2356 l. According to Hossen et al. (2012), the milk yield of the bathan CDC was 2225.5 l which differs with present study. Gandhi et al. (1995) studied the effect of non- genetic factors on total lactation yield and lactation length. It was reported that the lactation yield of the CDC in Satkhira district was higher than that in Sirajganj district because of longer lactation period (M. N. Islam et al., 2020). The milk yield of the CDC is affected by system of herd management, parity and seasonal changes in Bangladesh (Barua, et al., 2021). Similar result was reported in a previous study by Sarder et al. (2007).
Reproductive performance
Age at puberty
In the present study, the average age at puberty of the CDC was 576.0±0.3 d which ranged from 360-1080 d. The result was supported by Adhikary et al. (2020) who reported that the average age at puberty of the Friesian crossbred heifer was 18.7±0.2 m. Almost similar result was reported by Severino-Lendechy et al. (2017) who found that the age at puberty of criollo heifer was 19.2±0.5 m without supplementary feeding. Contrasting result, however, was reported by Uddin et al. (2008) who found that the average age at puberty of the Holstein crossbred heifer was 662.4±2.5 d. According to Reid et al. (1957), heifers on a low or high plane of nutrition may enter to puberty later or earlier than those on a normal plane of nutrition.
Age at first service
Our study revealed that the average age at first service of the CDC heifer was 579.0±0.3 d.
Similar result was reported by Desselegn et al. (2016) who reported that the average age at first service was 18.7±3.7 m for the cross breed cattle reared by the farmers in Ethiopia.
Contrastingly, Hossen et al. (2012) reported that the average age at first service of the crossbred heifer was 27.5±0.1 m in the bathan cattle. Age at first service may vary from place to place
24 | P a g e for a number of reasons, including plane of nutrition and management practices (Tolasa &
Andure, 2021).
Age at first conception
The mean age at first conception of the crossbred heifer was 597.0±0.3 d in our study. Similar result was reported by Novaković et al. (2011) who reported the average age a first conception was 16.2±0.3 m in case of black and white phenotype Friesian heifer. Sarder et al. (2007) observed that the mean age at first conception of the CDC heifer was 29.2±6.4 m. It was further reported that inadequate management, nutrition and health care may result delayed onset of puberty. Above all, compared with other genotype of the dam, Friesian cross-bred progenies have an earlier age at first service.
Service per conception
The mean service per conception (SPC) was 1.4±0.0 for the bathan CDC. This result was in line with Hossen et al. (2012) who reported that the SPC of the Friesian crossbred dairy cow was 1.4±0.02 under bathan system. Sarder et al. (2007) reported that neither genetic nor non- genetic factors influenced SPC in the CDC, rather, it was affected by the quality and quantity of semen used in AI, incorrect heat detection, failure to inseminate at the proper time and expertise of the inseminator. In fact, fertility is influenced by diseases, semen characteristics and environmental factors (Kabir & Kisku, 2013).
Gestation period
In the present study the mean gestation period of the CDC was 276.8±0.3 d. This result was in agreement with Kabir & Kisku (2013) who reported that the gestation length of the CDC was 277.8±2.5 d at central cattle breeding and dairy farm, Savar, Dhaka. The shortest (P<0.01) gestation period (274.9±0.6 d) was observed in cows inseminated with Holstein semen and the longest (278.0±0.4 d) was observed while inseminated with a Jersey sire (Scanavez &
Mendonça, 2018). Maternal variables were the primary contributors to the variations of gestation length within the species. Overall, the age of the dam, physical condition, twinning, hormonal processes, season, management and plane of nutrition may affect gestation period of the CDC (Kabir & Kisku, 2013).
25 | P a g e Dry period
In this study we found an average dry period (DP) of 67.1±0.6 d which ranged from 50 to 110 d. The result was supported by Adhikary et al. (2020) who reported that the average DP of the Friesian crossbred dairy cow was 78.0±2.1 d. Similar result was reported by Famous et al.
(2021) who found that the average DP of the Friesian CDC was 87±9 d. Atashi et al. (2013) reported that the DP varied from 71 to 85 d for the primiparous and multiparous dairy cows in Iran. In another study, the figure ranged from 60 to 80 d (Boujenane, 2019). It was reasoned that the CDC required a standard DP prior to the anticipated calving in order to regenerate their mammary glands and produce maximum milk for the next lactation. Several studies indicated that 60 d was optimum DP (Sawa et al. 2013) and a DP less than 50 d and more than 90 d reduced milk yield in the subsequent lactation (Atashi et al., 2013). According to O’Hara, (2019), cows with a short DP produce less milk because mammary gland is not given enough time during late gestation to encourage cell turnover and replace subsequent mammary epithelial cells.
Post-partum period
In this study the average post-partum period (PPP) of the CDC was 67.6±1.9 d. This result is supported by Adhikary et al. (2020) who found that the average post-partum period of the Friesian crossbred dairy cow was 64.5±1.5 d. We further observed that an increased PPP was associated with increased milk yield in the CDC. The result was supported by Antanaitis et al.
(2020) who reported that the post-partum cyclicity may be delayed as a result of increased milk yield.
Calving interval
The mean calving interval (CI) of the CDC was 354.8±2.2 d. Similar result was reported by A.
Islam et al., (2017) who mentioned that the average CI of the Friesian crossbred cow was 373.3±35.3 d. The length of CI depends on dry period (Lehmann et al., 2016), infertility (Walsh et al., 2011), nutrition (Ancker et al., 2006), parity and age (Wood et al., 1985). Too long CI was not profitable for the dairy farm. According to Gaines & Palfrey (1930), 350-370 d is the most typical CI. The cows have a usual tendency to freshen at yearly intervals. Nevertheless, optimum CI in the CDC affects profitability during the current and subsequent lactation.
26 | P a g e Fertility is the key factor which affects the CI. In the case of infertility problem, the intervals from calving to first service increases which simultaneously increases service per conception, days open and ultimately the CI (Slama et al., 1976; Temesgen et al., 2022).
Days open
The present study identified that the average days open (DO) of the CDC was 101.0±2.2 d.
Similar result was reported by Vargas et al. (1998) who found that the mean DO was 109.8 d in Costa Rica. In contrast, Sarder et al. (2007) reported that the mean DO of Friesian crossbred was 156±51 d under rural condition in Bangladesh. The DO is influenced by the insemination season, calving season, breeding system, calving to insemination interval and herd milk yield (Temesgen et al., 2022). Further, early lactational energy balance is important to overcome the anoestrus and thereby DO.
Effects of genotype
Effects of genotype on the milk yield of the CDC is a commonly accepted phenomenon (Talukder et al., 2001). Our study identified that the L×HF75% genotype had the highest milk yield. Similar results were reported in a series of previous studies (McDowell, 1985; Hossain et al., 2002; Tadesse & Dessie, 2003) where L×HF75% on the average had the best production performance. Bos taurus and Bos indicus crosses have the higher levels of heterosis (Cunningham & Syrstad, 1987). In Bangladesh, impact of heterosis on milk yield Local- Holstein crosses were reported by Hirooka & Bhuiyan, (1995). The HF is a well-known dairy breed with a reputation for their outstanding milk yield under intensive farming condition (Oltenacu & Broom, 2010). However, pure HFs are not heat tolerant (Tadesse & Dessie, 2003).
Hence, upgrading the native cattle by crossing with HF is a typical procedure in tropical environment (Barua, et al., 2021). Since the principal milk line of the CDC is the HF, the variations due to level and combination of the exotic blood (50%, 75%, 87.5% or 93.8% of HF) with the local zebu, Pabna milking cow, Sahiwal and Sindhi predominate productivity of the CDC. It was reported that PC×HF cross cows produced 2.67 times more milk than PC.
They studied that the HF cross ranked first in overall merit followed by SL cross under bathan rearing system (Hoque et al., 1999). Similarly the L×HF crosses produced 4.31 times higher milk than L under smallholder farming system (Rokonuzzaman et al., 2009). Accordingly, it
27 | P a g e was asserted that in the tropical climate zone, cows with 50% Bos taurus genes produced 2.6 times more milk, and cows with exotic inheritance of 75% Bos taurus genes produced 2.7 times more milk that of native cows (Galukande et al., 2013). Contrastingly, Kennedy et al. (2003) reported that decreasing milk yield and milk components may occur if increased metabolic and environmental demands are not met accordingly.
Effects of parity
Our study identified that, the highest milk yield was recorded in the 4th parity and the lowest in the 1st parity. Consistent with our study, Jingar et al. (2014) reported the highest milk yield in the 4th parity and the lowest in the 1st parity. The gradually increasing milk yield recorded in our study up to 4th parity were explained by the gradually increasing secretary cells of the mammary gland (Ihsanullah et al., 2020). According to Barua et al. (2021), the average milk yield in the 1st parity is lower than other parity because younger cows are not physically mature, rather, prone to less body weight and ongoing mammary tissue development (Pulina et al., 2005), hence, they need more dietary lipid and amino acids for body growth than for milk production (Senbeta & Abebe, 2021). Depending on parity, the ideal length of the dry period may be changed (Grummer & Rastani, 2004). For cows following the 4th lactation or later, the optimal DP was 27 d while for cows following the 1st lactation it was increased to 65 d (Dias
& Allaire, 1982) since older cows require less time for recovery and new cell regeneration than the younger cows. It was further reported that the highest milk yield was noted in the 3rd parity (Vijayakumar et al., 2017). In another study, Fadlelmoula et al. (2007) reported that the maximum milk yield was recorded in the 5th parity. In fact, after each pregnancy, there is an increase in the number of secretory cells which reach their peak around the 5th parity and then decline progressively (Fadlelmoula et al., 2007).
Effect of grazing time
In our study, the average milk yield of the CDC was positively influenced by the grazing time which is closely aligned with a previous study (Sairanen et al., 2006). Dillon et al. (2002) reported that part-time grazing enhanced milk yield by 0.31 kg for each additional grazing hour.
It was further reported that pasture dry matter intake (DMI) increased when grazing time increased (Sheahan et al., 2011). Low DMI significantly reduces productivity in the pasture-
28 | P a g e based dairy systems since it prevents animals from consuming enough nutrients to fully utilize their genetic potential for milk production (Kolver & Muller, 1998). Hence, Nassar, (2020) reported that reproductive efficiency of and production index of the dam were influenced by the grazing time. Bodla et al. (2017) reported that age at puberty was lower in heifers reared in pasture because of increased grazing time.
Marketing system of milk
In case of Milk vita, the price is based on the fat percent of milk. The standard rate is BDT 41.0 for a liter of milk having 4.0 per cent fat. Milk containing less than 3.5 percent is not accepted.
For every percentage point higher fat content, the price goes up by BDT 1. Ghosh, local customers, local goala and organized industries purchase milk from the farmers at BDT 50-60 per liter (1 $USD=100 BDT).
Prospects and constraints
The present study identified less cost of available seasonal roughage production, high production of raw milk, lower concentrate requirement, lower incidence of disease, lower number of worker requirement and reduced incidence of disease as the main prospects while high price of concentrate, low price of milk, high environmental temperature and problem of artificial insemination as the main constraints of bathan CDC production. Okkema & Grandin, (2021) reported that cows with high yields have a higher genetic risk of developing udder edema. Shanks et al. (1978) discovered that when compared to cows with low production pedigrees, those with high production pedigrees had an incidence of edema that was 11%
greater.
Conclusion
The bathan crossbred dairy cattle produces highest milk in the 4th parity which is influenced by their birth weight, live weight and body condition score. The age at puberty, age at first service, age at first conception, post-partum period, days open and calving interval principally control variability of their milk yield. An increased grazing time significantly reduces their age at puberty, age at first service, age at first conception, post-partum period, days open and calving
29 | P a g e interval. The less cost of available seasonal roughage production is the main prospects while high price of concentrate is the main constraints of bathan cattle production in the northern districts of Bangladesh.
Reference
Adhikary, K., Roy, K., Barua, K., Akter, N., Bhowmik, P., Sultan, N., & Hossain, M. E. (2020).
Performance of crossbred dairy cattle under commercial farming conditions in the Chattogram district, Bangladesh. Bangladesh Journal of Veterinary and Animal Sciences, 8(2), 141–150.
Ancker, S., Norberg, E., & Callesen, H. (2006). A synthesis of reproduction literature (Original Danish title: Vidensyntese Reproduktion. Rapport nr 113). Knowledge Centre for Agriculture, Skejby, Denmark.
Antanaitis, R., Malašauskienė, D., Televičius, M., Juozaitienė, V., Žilinskas, H., &
Baumgartner, W. (2020). Dynamic changes in progesterone concentration in cows’ milk determined by the at-line milk analysis system herd navigatortm. Sensors (Switzerland), 20(18), 1–11. https://doi.org/10.3390/s20185020
Atashi, H., Zamiri, M. J., & Dadpasand, M. (2013). Association between dry period length and lactation performance , lactation curve , calf birth weight , and dystocia in Holstein dairy cows in Iran. Journal of Dairy Science, 96(6), 3632–3638.
https://doi.org/10.3168/jds.2012-5943
Barua, K., Akter, N., Alam, M., Bari, M. S., Sultan, M. N., Islam, S., & Hossain, M. E. (2021).
Effects of genotype, parity, season and their interactions on milk yield in crossbred dairy cattle. Journal of Animal Physiology and Animal Nutrition, May 2022.
https://doi.org/10.1111/jpn.13666
Berry, D. P., Buckley, F., & Dillon, P. (2007). Body condition score and live-weight effects on milk production in Irish Holstein-Friesian dairy cows. Animal, 1(9), 1351–1359.
https://doi.org/10.1017/S1751731107000419
Bodla, M. T., Anwar, M., Ahmad, E., Naseer, Z., & Ahsan, U. (2017). Effect of two management systems and mineral feeding on age at puberty in Nili-Ravi buffalo heifers.
Buffalo Bulletin, 36(1), 27–33.
Boujenane, I. (2019). Factors Affecting the Dry Period Length and Its Effect on Milk Production and Composition in Subsequent Lactation of Holstein Cows. 9, 229–234.
Cunningham, E. P., & Syrstad, O. (1987). Crossbreeding Bos indicus and Bos taurus for milk
30 | P a g e production in the tropics.
Desselegn, G., Berhan, T., & Gebreyohanes, B. (2016). Study of productive and reproductive of cross breed dairy cattle under small holders management system in Bishoftu and Akaki Towns. International Journal of Agricultural Sciences ISSN2.
Dhakal, K., Maltecca, C., Cassady, J. P., Baloche, G., Williams, C. M., & Washburn, S. P.
(2013). Calf birth weight , gestation length , calving ease , and neonatal calf mortality in Holstein , Jersey , and crossbred cows in a pasture system. Journal of Dairy Science, 96(1), 690–698. https://doi.org/10.3168/jds.2012-5817
Dias, F. M., & Allaire, F. R. (1982). Dry period to maximize milk production over two consecutive lactations. Journal of Dairy Science, 65(1), 136–145.
Dillon, P., Crosse, S., O’brien, B., & Mayes, R. W. (2002). The effect of forage type and level of concentrate supplementation on the performance of spring‐calving dairy cows in early lactation. Grass and Forage Science, 57(3), 212–223.
Fadlelmoula, A. A., Yousif, I. A., & Abu Nikhaila, A. M. (2007). Lactation curve and persistency of crossbred dairy cows in the Sudan. Journal of Applied Sciences Research, 3(10), 1127–1133.
Famous, M., Aditya, A. C., Ahmed, S., & Sutradhar, S. (2021). Productive and reproductive performance of different crossbred dairy cattle at Kishoreganj, Bangladesh. Veterinary Sciences: Research and Reviews, 7(1), 69–76.
Gaines, W. L., & Palfrey, J. R. (1930). Length of Calving Interval and Average Milk Yield.
Journal of Dairy Science, 14(4), 294–306. https://doi.org/10.3168/jds.S0022- 0302(31)93474-7
Galukande, E., Mulindwa, H., Wurzinger, M., Roschinsky, R., Mwai, A. O., & Sölkner, J.
(2013). Cross-breeding cattle for milk production in the tropics: achievements, challenges and opportunities. Animal Genetic Resources/Resources Génétiques Animales/Recursos Genéticos Animales, 52, 111–125.
Gandhi, R. S., Gurnani, M., & Singh, A. (1995). Influence of non-genetic factors on some of the economic traits of Sahiwal cattle. Indian Journal of Dairy Science, 48, 605–606.
Grummer, R. R., & Rastani, R. R. (2004). Why Reevaluate Dry Period Length ?*. Journal of Dairy Science, 87(June 2003), E77–E85. https://doi.org/10.3168/jds.S0022- 0302(04)70063-6
Handcock, R. C., Lopez-Villalobos, N., McNaughton, L. R., Back, P. J., Edwards, G. R., &
Hickson, R. E. (2019a). Live weight and growth of Holstein-Friesian, Jersey and crossbred dairy heifers in New Zealand. New Zealand Journal of Agricultural Research, 62(2), 173–
31 | P a g e 183. https://doi.org/10.1080/00288233.2018.1465984
Handcock, R. C., Lopez-Villalobos, N., McNaughton, L. R., Back, P. J., Edwards, G. R., &
Hickson, R. E. (2019b). Positive relationships between body weight of dairy heifers and their first-lactation and accumulated three-parity lactation production. Journal of Dairy Science, 102(5), 4577–4589. https://doi.org/10.3168/jds.2018-15229
Hasan, M. K., Rahman, M. A., Mahbub, A. S. M., Belal, S. A., & Ahmed, T. (2014).
Performance of Different Crossbred Cattle At Comilla District of Bangladesh. J. Sylhet Agril. Univ., 1(2), 161–167.
Hirooka, H., & Bhuiyan, A. (1995). Additive and heterosis effects on milk yield and birth weight from crossbreeding experiments between Holstein and the local breed in Bangladesh. Asian-Australasian Journal of Animal Sciences, 8(3), 295–300.
Hoque, M. A., Amin, M. R., & Hussen, M. S. (1999). Dairy potential of Pabna cows and crossbreds with Sahiwal and Friesian and within-and between-breed sire effects. Asian- Australasian Journal of Animal Sciences, 12(2), 161–164.
Hossain, K. B., Takayanagi, S., Miyake, T., Bhuiyan, A. K. F. H., & Sasaki, Y. (2002).
Statistical genetic studies on cattle breeding for dairy productivity in Bangladesh: II.
Estimation of reciprocal and heterosis effects and optimum crossbreeding system between the local breeds and exotic breeds for milk performance. Asian-Australasian Journal of Animal Sciences, 15(6), 777–782. https://doi.org/10.5713/ajas.2002.777
Hossen, M. S., Hossain, S. S., Bhuiyan, A., Hoque, M. A., & Talukder, M. A. S. (2012).
Comparison of some important dairy traits of crossbred cows at Baghabarighat milk shed area of Bangladesh. Bangladesh Journal of Animal Science, 41(1), 13–18.
Huque, K. (2014). A performance profile of dairying in Bangladesh - programs, policies and way forwards. Bangladesh Journal of Animal Science, 43(2), 81–103.
https://doi.org/10.3329/bjas.v43i2.20662
Ihsanullah, Qureshi, M. S., Akhtar, S., & Suhail, S. M. (2020). Seasonal stress affects reproductive and lactation traits in dairy cattle with various levels of exotic blood and parities under subtropical condition. Pakistan Journal of Zoology, 52(1), 147–155.
https://doi.org/10.17582/journal.pjz/2020.52.1.147.155
İnal, F., Arslan, C., & Çelik, B. (2001). The Effect of Liquid Feed Additive, Uramel, on Milk Yield and Mil Composition in Dairy Cows. KAFKAS ÜNİVERSİTESİ VETERİNER FAKÜLTESİ DERGİSİ, 7(2).
Islam, A., Abmt, A., Hasan, M., Islam, S., Ma, S., Mm, R., Mm, H., & Km, I. (2017).
Productive and Reproductive performance of different breed and cross breds dairy cattle
32 | P a g e at Central Cattle Breeding and Dairy Farm , Savar , Dhaka , Productive and Reproductive performance of different breed and cross breds dairy cattle at Central Cattle B. January.
Islam, M. N., Bari, M. S., Habib, M. R., Sarkar, M. M., & Islam, M. A. (2020). Comparative economic analysis of dairy characteristics focused on repeat breeding losses in selected milk pocket areas of Bangladesh. Bangladesh Journal of Animal Science, 48(2), 145–154.
https://doi.org/10.3329/bjas.v48i2.46769
Islam, M. S., Deb, G., Nurunnahar, T., Ershaduzzaman, M., Habib, M., Ali, M. Y., Kabir, M.
H., Yousuf, M. A., Afroz, M. F., & Yeasmin, T. (2017). Identification of possible causes of repeat breeding in dairy cows at Baghabari milk shed areas, Sirajgonj, Bangladesh.
Asian Journal of Medical and Biological Research, 3(2), 186–190.
https://doi.org/10.3329/ajmbr.v3i2.33567
Jingar, S., Mehla, R. K., Singh, M., & Roy, A. K. (2014). Lactation Curve Pattern and Prediction of Milk Production Performance in Crossbred Cows. Journal of Veterinary Medicine, 2014, 1–6. https://doi.org/10.1155/2014/814768
Kabir, F., & Kisku, J. J. (2013). Reproductive performance of different crossbred cows of Bangladesh. African Journal of Agricultural Research, 8(9), 723–726.
https://doi.org/10.5897/AJAR2013.6722
Kennedy, J., Dillon, P., Delaby, L., Faverdin, P., Stakelum, G., & Rath, M. (2003). Effect of genetic merit and concentrate supplementation on grass intake and milk production with Holstein Friesian dairy cows. Journal of Dairy Science, 86(2), 610–621.
Khan, M. K. I. (2009). Development of models for the genetic improvement of dairy cattle under cooperative dairying conditions in Bangladesh. PhD, Massey University, Palmerston North.
Kiwuwa, G. H., Trail, J. C. M., Yousef, M. K., Worku, G., Anderson, F. M., & Durkin, J. W.
(1983). Crossbred dairy cattle productivity in Arsi region, Ethiopia. International Livestock Centre for Africa.
Kolver, E. S., & Muller, L. D. (1998). Performance and nutrient intake of high producing Holstein cows consuming pasture or a total mixed ration. Journal of Dairy Science, 81(5), 1403–1411.
Lamb, R. C., & Barker, B. O. (1975). Genetic relationship between birth weight and adult weight in Holsteins. Journal of Dairy Science, 58(5), 724–728.
Lawrence, D. C., O’Donovan, M., Boland, T. M., Lewis, E., & Kennedy, E. (2015). The effect of concentrate feeding amount and feeding strategy on milk production, dry matter intake, and energy partitioning of autumn-calving Holstein-Friesian cows. Journal of Dairy
33 | P a g e Science, 98(1), 338–348. https://doi.org/10.3168/jds.2014-7905
Lehmann, J. O., Fadel, J. G., Mogensen, L., Kristensen, T., Gaillard, C., & Kebreab, E. (2016).
Effect of calving interval and parity on milk yield per feeding day in Danish commercial dairy herds. Journal of Dairy Science, 99(1), 621–633. https://doi.org/10.3168/jds.2015- 9583
Mamun, M. J. A., Khan, M. A. S., Sarker, M. A. H., & Islam, M. N. (2015). Productive and reproductive performance of Holstein Friesian crossbred and indigenous cow under small holder farming system. Bangladesh Journal of Animal Science, 44(3), 166–170.
McDowell, R. E. (1985). Crossbreeding in tropical areas with emphasis on milk, health, and fitness. Journal of Dairy Science, 68(9), 2418–2435.
Miazi, O. F., Hossain, M. E., & Hassan, M. M. (1970). Productive and reproductive performance of crossbred and indigenous Dairy cows under rural conditions in Comilla, Bangladesh. University Journal of Zoology, Rajshahi University, 26(August 2016), 67–
70. https://doi.org/10.3329/ujzru.v26i0.702
Nassar, M. S. (2020). Effect of grazing time on productive performance of goat in Halaib–
Shalateen region. Egyptian Journal of Nutrition and Feeds, 23(1), 37–54.
Nikkhah, A., Furedi, C. J., Kennedy, A. D., Crow, G. H., & Plaizier, J. C. (2008). Effects of feed delivery time on feed intake, milk production, and blood metabolites of dairy cows.
Journal of Dairy Science, 91(11), 4249–4260.
Novaković, Ž., Sretenović, L., Aleksić, S., Petrović, M. M., Pantelić, V., & Ostojić Andrić, D.
(2011). Age at first conception of high yielding cows. Biotechnology in Animal Husbandry, 27(3), 1043–1050.
O’Hara, E. A. (2019). The effect of dry period length on milk production, health and fertility in two cow breeds. Ph. D. Thesis, Swedish University of Agricultural Sciences, Uppsala, Sweden ….
Okkema, C., & Grandin, T. (2021). Graduate Student Literature Review: Udder edema in dairy cattle—A possible emerging animal welfare issue. Journal of Dairy Science, 104(6), 7334–7341. https://doi.org/10.3168/jds.2020-19353
Oltenacu, P. A., & Broom, D. M. (2010). The impact of genetic selection for increased milk yield on the welfare of dairy cows. Animal Welfare, 19(1), 39–49.
Pulina, G., Nudda, A., Macciotta, N. P. P., Battacone, G., Fancellu, S., & Patta, C. (2005). Non- nutritional strategies to improve lactation persistency in dairy ewes.
Rahman, M. Z., Ali, M. Y., Sarker, N. R., Afroz, M. F., Rahman, M. O. A., & Karim, M. R.
(2015). Effect of modified feeding practice on milk production of cross bred dairy cows
34 | P a g e in Baghabari milk shed area, Sirajgonj. Asian Journal of Medical and Biological Research, 1(2), 254–258. https://doi.org/10.3329/ajmbr.v1i2.25619
Reid, J. T., Loosli, J. K., Turk, K. L., Trimberger, G. W., Asdell, S. A., & Smith, S. E. (1957).
Effect of nutrition during early life upon the performance of dairy cows. Effect of Nutrition during Early Life upon the Performance of Dairy Cows.
Reynolds, C. K. (2002). Economics of visceral energy metabolism in ruminants: Toll keeping or internal revenue service? Journal of Animal Science, 80(E-suppl_2), E74–E84.
Rokonuzzaman, M., Hassan, M., Islam, S., & Sultana, S. (1970). Productive and reproductive performance of crossbred and indigenous dairy cows under smallholder farming system.
Journal of the Bangladesh Agricultural University, 7(1), 69–72.
https://doi.org/10.3329/jbau.v7i1.4801
Saha, S. N., Alam, M. G. S., Shamsuddin, M., & Khatun, M. (2016). Effects of breed, management system, milk yield and body weight on onset of postpartum ovarian cyclicity
in cows. Bangladesh Veterinarian, 32(1), 27–34.
https://doi.org/10.3329/bvet.v32i1.29254
Sairanen, A., Khalili, H., Virkajärvi, P., & Hakosalo, J. (2006). Comparison of part-time grazing and indoor silage feeding on milk production. Agricultural and Food Science, 15(3), 280–292. https://doi.org/10.2137/145960606779216326
Sarder, M. J. U., Rahman, M. M., Ahmed, S., Sultana, M. R., Alam, M. M., & Rashid, M. M.
(2007). Consequence of dam genotypes on productive and reproductive performance of dairy cows under the rural condition in bangladesh. Pakistan Journal of Biological Sciences, 10(19), 3341–3349. https://doi.org/10.3923/pjbs.2007.3341.3349
Sawa, A., Bogucki, M., & Siatka, K. (2013). Effect of the first and next calvings of cows and their milk production level on the relationship between dry period length and milk yield and its composition in the subsequent lactation. Archives Animal Breeding, 56(1), 934–
942.
Scanavez, A. L., & Mendonça, L. G. (2018). Gestation length and overall performance in the subsequent lactation of dairy cows conceiving to Holstein, Jersey, or Angus semen: An observational study. Kansas Agricultural Experiment Station Research Reports, 4(10), 1–
9.
Senbeta, E. K., & Abebe, A. S. (2021). Effect of parity on lactation traits in crossbred Holstein Friesian in Ethiopia. Journal of Livestock Science, 12(3), 176–183.
https://doi.org/10.33259/jlivestsci.2021.176-183
Severino-Lendechy, V. H., Montiel-Palacios, F., & Pérez-Hernández, P. (2017). Age and