In this study, we assess the financial impact of the pandemic on SMEs in Bangladesh. In the second round, we found that average wages were only 4% lower than pre-pandemic levels, and the percentage of firms hiring was greater than that of firms laying off workers, indicating growing employment opportunities for workers in SMEs' is. However, companies are still concerned as the volume of orders is still lower than pre-pandemic levels and raw material costs rose from our first round of survey.
In the second round, we found that almost 40–50% of firms in all industries borrowed within this time to support their businesses, primarily to purchase raw materials, followed by paying rents and wages.
Introduction and Background
4 Our findings add to the recent growing body of literature on the impacts of COVID-19 on the economy, particularly in the SME sector. Findings from a World Bank survey of businesses in 13 countries also showed similar adverse effects of the pandemic on SMEs (Adian et al., 2020). Beglaryan and Shakhmuradyan (2020), on the other hand, used a labor force survey in Armenia and found that workers in SMEs were more affected by the pandemic, with higher rates of layoffs and wage cuts compared to workers in large companies.
Additionally, as we resurvey firms that were part of a randomized controlled trial (RCT), our findings also contribute to the literature on the broader effects of training on firms and workers in the informal sector (Brooks et al., 2016; DeMel et al. ., 2014; Fiala, 2013; Karlan et al., 2015; McKenzie & Woodruff, 2014; Valdivia, 2011).
The Survey
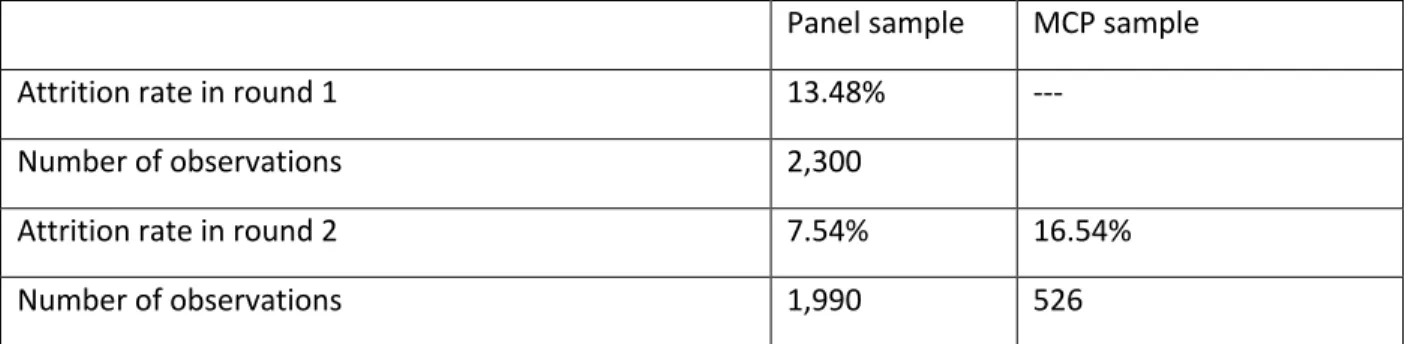
As mentioned earlier, in round 2, we also approached an additional 526 MCPs, and the attrition rate among MCPs was about 17%. We were unable to reach approximately 44% of affected firms 4 in the second round because respondents' phones were turned off. In this report, we consider the 1,840 firms that were successfully surveyed in both Round 1 and Round 2 for our panel analysis of firms' operational status.
We re-approached 1,570 youth in Round 2, including all those successfully interviewed in Round 1; this time we were able to successfully reach 951 youths.
Results From the Enterprise Owners' Survey
Enterprise Owners' Profile
We have categorized based on the companies that received the majority of our sample. As mentioned earlier, we also interviewed practitioners who received BRAC training for LE services and their non-RCT beneficiary counterparts. As we have examined both interns and their non-beneficiary counterparts, regardless of their employment status, these young people are indeed participants in the labor market.
Ninety-nine percent of the firms in our sample have fixed assets worth less than BDT 75,00,000.

Business Characteristics of the Firms Surveyed in Round 2
Analysis of Firms Surveyed in Both Rounds
- Business Operations, Sales, and Expenses
- Consequences of Workers
- Major Concerns of Firms
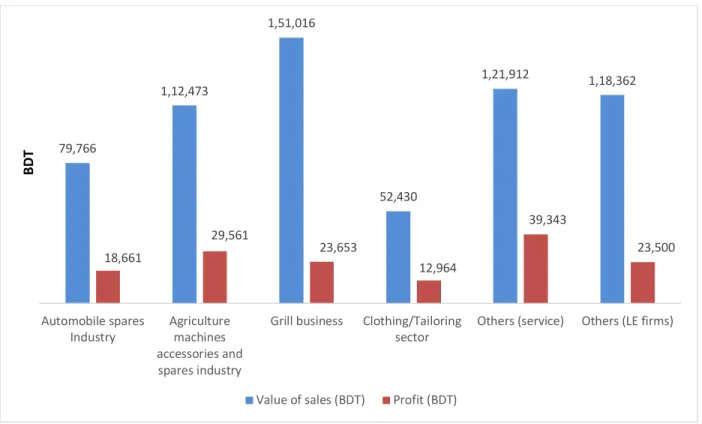
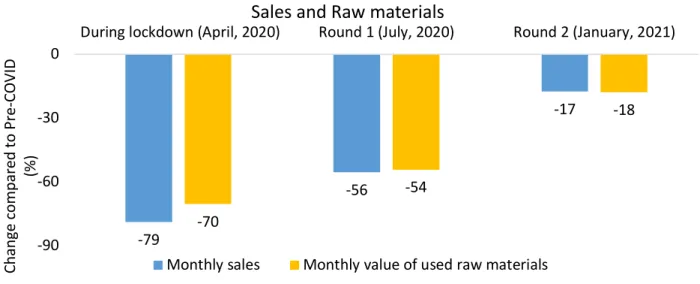
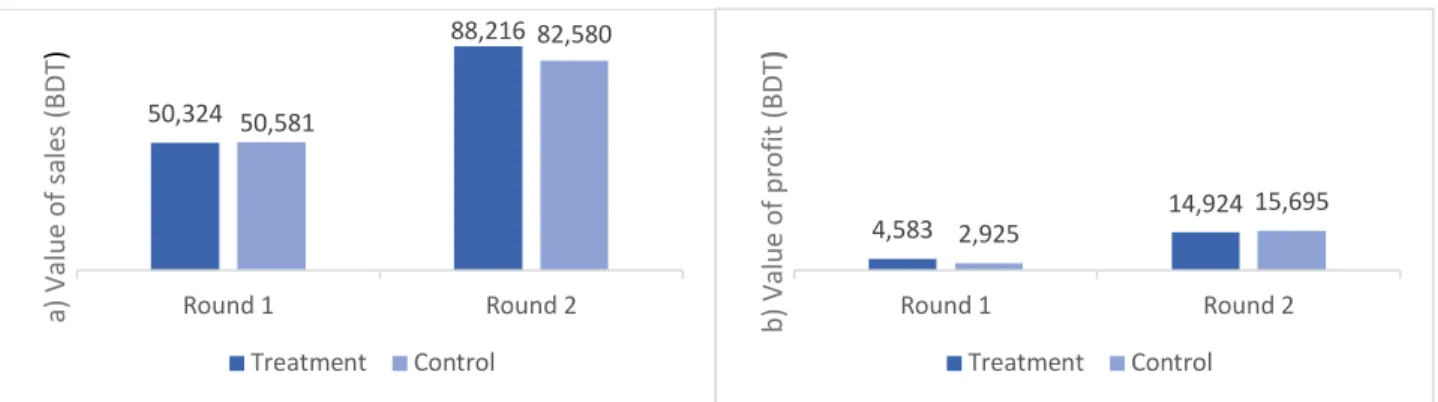
Average value of sales in the last month (BDT) Average value of profit in the last month (BDT). In addition, the fall in sales and value of used raw materials is approx. 39 and 36 percentage points lower in round 2 than in round 1 (figure 10). In round 2, monthly sales are about 17% lower and the value of raw materials used is about 18% lower compared to pre-COVID levels.
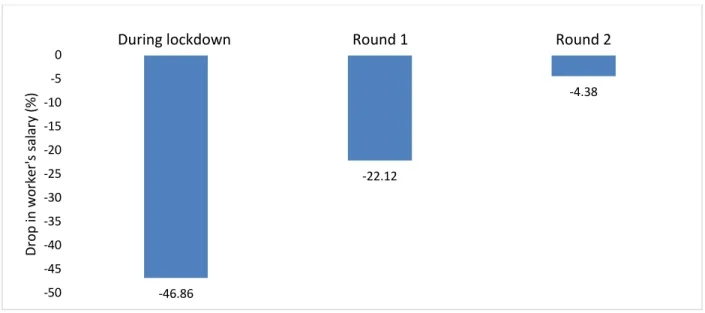
This data indicates that while companies are getting closer to pre-COVID conditions over time, they are not quite there yet. Comparing their wages to pre-COVID wages, we see that employees in Round 1 received 22.12% less average salary compared to pre-COVID levels. It can be suggested that despite the gradual increase in turnover and profits, companies are still paying their employees less than before six months after the end of the lockdown.
Also, companies that let go of workers in Round 2 had 29% lower sales than before COVID. We find that companies are still concerned about the reduced volume of orders six months after the lockdown. On the other hand, companies are now less concerned about paying their employees and maintaining business operations, credit related complexities and their customers not paying the bills.
The majority of the firms that are concerned about the rise in the price of raw materials are LE firms (56%) (Figure 14). Although concern about the price of raw materials is relatively low in the service sector, 56% of general shop owners have this concern.
Compliance With COVID-19 Safety Guidelines
Self-Reported Changes in Business in Firms Surveyed in Round 2
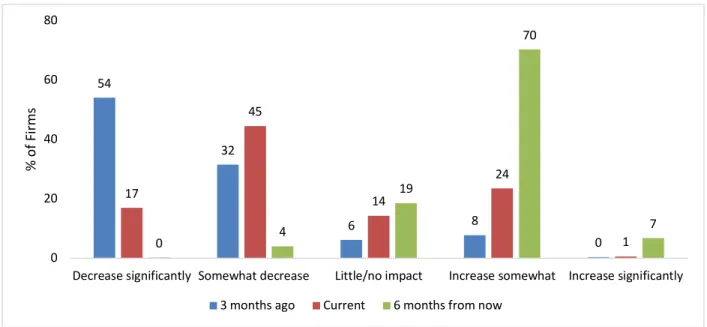
About 45% of firms said their sales were down compared to pre-COVID times, and 54% reported their sales had decreased significantly three months ago. Firms are also hopeful about the future, as 70% of firm owners expect their sales to increase in the next six months. We also asked firms whether they considered their current sales to be above or below normal.7 Figure 18.
Quite expectedly, the number of companies reporting below-normal sales is highest in the clothing and tailoring sector (86%). As we have already mentioned, their average value of sales and profit in the last month before the survey is also the lowest. When asked about any changes in selling prices, 37% said there are currently no changes, and 46% reported that their selling prices are now higher than pre-COVID levels (Figure 19).
In terms of future expectations, firms are hopeful, with 50% expecting an increase in selling prices in the next six months. In terms of supply chain, 36% reported that their supply chain has weakened, while 40%.
Access to Credit by Firms Surveyed in Round 2
As we mentioned earlier, most companies are concerned that raw materials will become expensive, which may indicate that companies now need to use external sources of funding to afford raw materials. The next key purpose of loans is to pay workers' salaries and pay rent.

Access to Stimulus Package by the Government
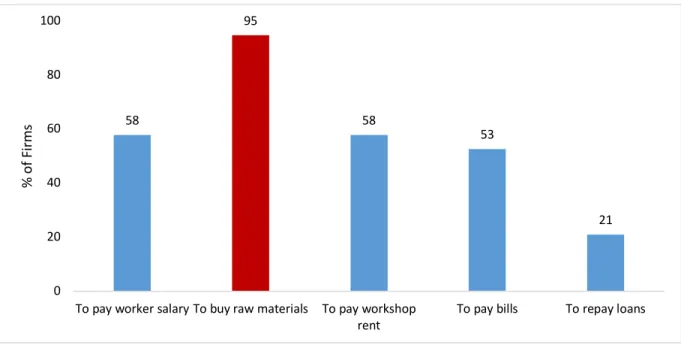
24 Ninety-five percent of the 16 companies that received the package in the 2nd round used it to purchase raw materials (Figure 25). Companies had to wait an average of 36 days after submitting their application to receive the package, and those that applied paid an average of 4.5 percent interest. Among the 16 companies that received a package in round 2, 53% reported a long process, and 37% cited bank-related barriers as the main problems in accessing the package (Figure 25).
How BRAC's Training Recipients Performed in Round 2 Compared to Their Counterparts
We also compared the working environment of LE companies surveyed in round 2 with their baseline status in 2017. Compared to the control group, the percentage of companies in the treatment group that use a waste bin is higher by almost 11 percentage points in 2021. Compared to the baseline reported a higher number of establishments cleanliness in both treatment and control groups.
However, we find that the percentage of firms that clean their workshop daily has slightly declined in both groups. Note: Figures in parentheses are standard errors and figures in square brackets are t-statistics. Almost 43% of firms in the treatment groups use an antiseptic liquid, such as Dettol/Savlon.
While 27% of the companies in the treatment group indicated that they did not use disinfectants, the percentage of companies that did not use disinfectants was much higher in the control group (37.5%). Our findings highlight the effectiveness of training in a decent working environment to ensure good hygiene in workplaces during a global pandemic.
Results From the Workers’ Survey
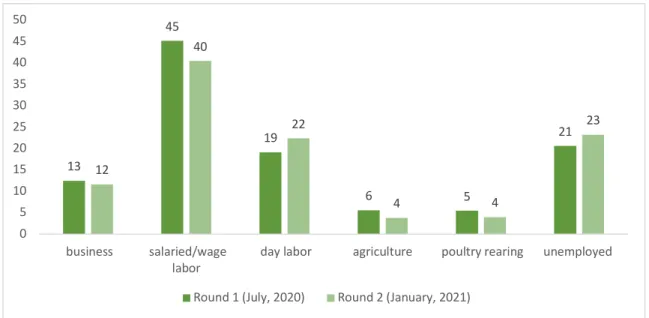
29 While only about 9% of men lost their jobs six months after the shutdown, the percentage of women losing their jobs is almost twice that, namely 28% (Table 5). The percentage of unemployed women finding new jobs is lower than the percentage of lost jobs. Despite starting to work at full scale, workers' incomes have increased only slightly in Round 2 and are still far from pre-COVID-19 income levels (Figure 32).
The overall drop in income compared to the pre-pandemic period was 39% in round 1 and now stands at 27%. Female workers are hit harder and saw no improvements in their income during the second round. Although women work more days per month compared to their male counterparts, their income remains lower.
While 83% of employees employed at the time of the surveys responded to wearing a mask while working in Round 1, only 67% wore masks to work in Round 2. This could be because female employees were financially are more vulnerable compared to their employees. male counterparts. 34 To assess how the pandemic may have affected employees' mental health, we calculated the perceived stress score.
We compare the outcome for employed and unemployed workers in both rounds and find that unemployed workers are more likely to be stressed in both rounds (Figure 37). Comparing male and female workers, we find that female workers are more likely to be stressed in both rounds (Figure 38).
Concluding Remarks
Bangladesh's informal sector is an important economic driver, employing more than 80% of the workforce. Small and medium-sized enterprises in the pandemic: Impact, responses and the role of development finance. Impact of COVID-19 on SMEs in Armenia: evidence from a labor force survey.
Business training and women business start-ups, growth and dynamism: Experimental evidence from Sri Lanka. The impact of the COVID-19 pandemic on small and medium enterprises in Bangladesh [Working paper]. https://bigd.bracu.ac.bd/publications/the-impact-of-covid-19-pandemic-on-small-and-medium-enterprises-in-bangladesh/. Consulting and capital experiments with micro-enterprise tailors in Ghana. Exploring the impact of Covid-19 on small and medium enterprises: early evidence from Sri Lanka. https://pesquisa.bvsalud.org/global-literature-on-novel-coronavirus-2019-ncov/resource/en/covidwho-665263.
The Impact of COVID-19 on Closed Micro, Small and Medium Enterprises: Evidence from a Rapid Survey in the Philippines. https://www.adb.org/publications/covid-19-impact-msme-under-. lockdown-evidence-rapid-survey-philippines.