A Survey of the Bangladeshi People
The State of Bangladesh's Political Governance, Development and Society:
According to Its Citizens
2022 Edition
The State of Bangladesh's Political Governance, Development and Society:
According to Its Citizens
A Survey of the Bangladeshi People
2022 Edition
The State of Bangladesh’s Political Governance, Development and Society: According to its Citizens
A Survey of the Bangladeshi People Editor
Tabasum Akseer Authors
Mirza M. Hassan, Syeda Salina Aziz, Tanvir Ahmed Mozumder, Rafsanul Hoque, Sumaiya Tasnim, Raeesa Rahemin, Izlal Moin Husain, Ainee Islam Design
Ainee Islam, Tabasum Akseer, A G Mutasim Islam Photographer
Mahmud Hossain Opu Design & printing PATHWAY
© 2023 The Asia Foundation
The Asia Foundation is a non-profit international development organization committed to improving lives across a dynamic and developing Asia. Informed by six decades of experience and deep local expertise, our work across the region addresses five overarching goals—strengthen governance, empower women, expand economic opportunity, increase environmental resilience, and promote regional cooperation. Headquartered in San Francisco, The Asia Foundation works through a network of offices in 18 Asian countries and in Washington, DC. Working with public and private partners, the Foundation receives funding from a diverse group of bilateral and multilateral development agencies, foundations, corporations, and individuals. For more information: www.asiafoundation.org.
x xii 1
Table of Contents
Preface
Acknowledgements Executive Summary
1. Demographic and Socio-Economic Profile 2. Perceptions of Society, Politics and Economy
2.1 The direction of the country 2.1.1 Social direction
2.1.2 Political direction 2.1.3 Economic direction
2.2 The major problems faced by the country 3. Politics and Elected Leaders
3.1 Awareness and expectations of national representatives 3.2 Awareness of and expectations from local representatives
3.3.1 Political identity, loyalty, and attitude towards political parties 28 3.3.2 Deciding to vote
3.4 Political violence 4. Citizenship
4.1 Citizens’ relationship with the government 4.2 Living with dignity
4.3 Living with freedom 5. Democracy
5.1 Understanding of democracy in Bangladesh 5.2 Election and voting behaviour
7 11 12 12 14 18 20 21 22 26
30 31 32 33 33 36 37 38 40
40 41 43 45 5.3 Democratic practices in Bangladesh
5.4 Impact of the dominant party system 5.5 Discussing and expressing political views
5.6 Deliberative democracy and rural justice forums: Awareness and effectiveness
5.6.1 Social safety net 5.7 Gender and governance 5.8 Trust in institution
6. Digitalized Bangladesh, Social Media, and Policy Influence 6.1 Access to mobile phones and the internet
6.1.1 Communicating through the Internet 6.2 Use of Facebook
6.2.1 Ensuring governance through Facebook 6.2.2 Ensuring accountability through Facebook 6.3 Posting opinions on Facebook
6.4 Freedom of speech & press 6.4.1 Trust in media
6.4.2 Freedom of media 7. Inclusive Development
7.1 Understanding development
7.2 Perceptions regarding inclusive development 8. Social Cohesion, Trust and Rohingya Issues
8.1 Trust
8.2 Attitudes towards Rohingya’s
46 48 50 53 54 55 57 57 58 58 59 59 61 63 64 65 67 68 72
80 81 84 84 84 9. Contemporary Issues
9.1 Padma bridge 9.2 Price hike
9.2.1 Fuel price hike 9.2.2 Commodity price hike
9.3 Production of electricity and nationwide electrification 9.4 Covid-19 mass vaccination drive
9.5 Women empowerment 9.6 Religious tolerance Appendix 1: Survey Methodology Appendix 2: Bibliography
Appendix 3: Survey Questionnaire
85 86 87 92 95 98 100
2 8 9
List of Figures
Figure 1.1: Summary of response to what direction the country is heading.
Figure 1.2: Respondents’ age and gender Figure 1.3: Respondents’ education (by gender).
Figure 1.4: Respondents’ occupation (by strata).
Figure 1.5: Household monthly income (by strata).
Figure 2.1: Do you think Bangladesh is going in the right direction socially? (by
area) 12
Figure 2.2: Do you think Bangladesh is going in the right direction socially (by
income)? 12
Figure 2.3: Do you think Bangladesh is going in the right direction socially (by
division)? 14
Figure 2.4: Do you think Bangladesh is going in the right direction politically (by
strata)? 15
Figure 2.5: Do you think Bangladesh is going in the right or wrong direction
politically (by income)? 15
Figure 2.6: Do you think Bangladesh is politically going in the right direction (by
division)? 17
Figure 2.7: Do you think Bangladesh is going in the right direction economically? (by area)
Figure 2.8: Do you think Bangladesh is going in the right direction economically (by income)?
Figure 2.9: Do you think Bangladesh is going in the right direction economically (by division)?
Figure 3.1: Can you name your MPs correctly (by year)?
Figure 3.2: Did your MP visit the locality in recent years (by year)?
9 10
18
18
20 22 23
25 25 26 Figure 3.3: Do you agree or disagree MPs care about general citizens (by
division)? 24
Figure 3.4: What MPs do and what they should do (These were multiple choice questions).
Figure 3.5: How satisfied are you with your MP’s work (by year)?
Figure 3.6: How satisfied are you with your MP’s work (by division)?
Figure 3.7: Did you contact your local representatives and local administration
in the last year? 27
Figure 3.8: Did you contact your local representatives and local administrates in
the last year (by income)? 27
Figure 3.9: Did you contact your local representatives and local administrates in
the last year (by gender)? 28
Figure 3.10 Will you vote for a candidate you have voted for before if he changes his party or contests individually/ for a new party whose ideology is
similar to yours? 29
Figure 3.11: Will you vote for a candidate you have voted for before in case he changes party or contests individually for a new party whose ideology is similar
to yours (by age)? 29
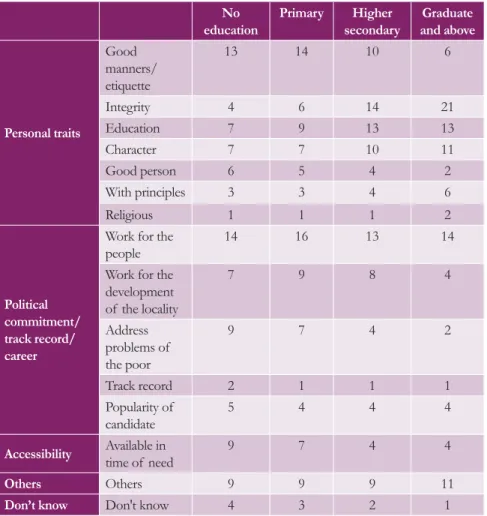
Figure 3.12: Most important attribute for individuals to get elected (by education).
Figure 4.1 What are the three most important things that you need to have a
dignified life? 34
Figure 4.2: What is the first thing that you need to have a dignified life (by education groups)?
Figure 4.3: What are the three most important things required to live freely (by education)?
Figure 5.1: When a country is called democratic, what do you understand by that? Multiple responses. (by income).
Figure 5.2: At present, one can observe a dominant role of one party in politics/governance (by income).
31
35
36
39
41
42
43
44 Figure 5.3: Impact of a dominant party system on politics (by income).
Figure 5.4: How often do you discuss political affairs with friends (by education, and income)?
Figure 5.5: To what extent do the people of your locality feel free to express their political opinions (by education and income)?
Figure 5.6: Knowledge about Ward Shobha and open budget forums (by education and income).
Figure 5.7: Sufficiency and distribution of social safety nets (by year).
Figure 5.8: Fairness of distribution of social safety nets (by income).
Figure 5.9: Support for female leadership in different institutions.
Figure 5.10: Support for female leadership in various institutions (by gender). 49 Figure 5.11: Irrespective of the qualification of a man, woman, or third gender, who would you prefer to vote for in your constituency in the national election?
(by gender). 50
Figure 5.12: Trust in different institutions.
Figure 5.13: Trust in institutions (by education).
Figure 6.1: Mobile phone ownership (by education).
Figure 6.2: Access to the internet (by education).
Figure 6.3: Communication platforms (by gender).
Figure 6.4: Communication platforms (by region).
Figure 6.5: Can citizens ensure the responsiveness of the state through Facebook (by education)?
Figure 6.6: Can citizens ensure the accountability of the state through Facebook (by education)?
Figure 6.7: Do you feel safe posting opinions regarding the political governance of the country on Facebook (by education)?
Figure 6.8: Do you feel safe posting opinions regarding social issues of the country on Facebook (by education)?
46 47 47 48
51 52 55 55 56 56
57
58
58
59
60
62
65 Figure 6.9: Preferred media sources for news (by education).
Figure 6.10: Trust in different media sources (by education, location, and
overall). 61
Figure 6.11: Freedom of media.
Figure 7.1: Do you believe the current development outcomes are beneficial for all income classes (by education)?
Figure 7.2: Do you believe the current development outcomes are beneficial for
all income classes (By income)? 66
Figure 8.1: Attitudes toward trust (by gender and education).
Figure 8.2: Trust toward neighbors.
Figure 8.3: Trust toward neighbors (by income).
Figure 8.4: Trust toward neighbours (by education).
Figure 8.5: Trust toward community members (by gender and education)? 71 Figure 8.6: Trust in toward community leader (by income).
Figure 8.7: Trust in community groups/organizations (by income).
Figure 8.8: Trust in community groups/organizations (by education).
Figure 8.9: Will you welcome Rohingya refugees into your community (by
region)? 74
Figure 8.10: Is the Bangladesh government doing enough to support the Rohingya refugees or not(by year)?
Figure 8.11: Is the Bangladesh Government doing enough to support the Rohingya refugees (by income)?
Figure 8.12: Is the Bangladesh Government doing enough to support the Rohingya refugees (by region)?
Figure 8.13: Is the International Community doing enough to support the Rohingya refugees (by education)?
Figure 8.14: Do you think that the International Community is doing enough to support the Rohingya refugees or not (by region)?
68 69 70 70
71 72 72
74
75
76
77
77
78
79
79 Figure 8.15: In your opinion, how long should Rohingya refugees be allowed to stay in Bangladesh?
Figure 8.16: In your opinion, how long should Rohingya refugees be allowed to stay in Bangladesh (by education)?
Figure 8.17: What kind of immediate effect did the Rohingya refugees entering Bangladesh bring (by strata and year)?
Figure 9.1: The opening of Padma Bridge for public use (by age).
Figure 9.2: The opening of Padma Bridge for public use (by income).
Figure 9.3: The opening of Padma Bridge for public use (by region).
Figure 9.4: Effect of recent commodity price hike (by income).
Figure 9.5: Government’s success regarding the Covid-19 mass vaccination drive (by education).
Figure 9.6: Support for women’s participation in economic activities (by strata,
education, and gender). 88
Figure 9.7: Support for women working outside of the home (by education). 88 Figure 9.8: Support for men to be prioritized over women in case of
employment (by education).
Figure 9.9: Both men and women should have an equal share of the father’s
property (by education). 89
Figure 9.10: Females can dress as they like (by age and education).
Figure 9.11: Unacceptable dress for women (by strata and gender).
Figure 9.12: Unacceptable dress for women (by education).
Figure 9.13: Relationship with people from different religious communities in the local area (by education and gender).
Figure 9.14: Relationship with people from different religious communities in Bangladesh (by education and gender).
Figure 10.1: Sampling Design Flowchart.
82 82 83 85
86
89
90 91 92
93
94 96
List of Abbreviations
BIGD BRAC Institute of Governance and Development IRB Institutional Review Board
MP Member of Parliament UNO Upazila Nirbahi Officer UP Union Parishad
RAB Rapid Action Battalion BDT Bangladeshi Taka
CI Corrugated galvanized Iron BNP Bangladesh Nationalist Party DC District Commissioner OBM Open Budget Meetings
OECD Organisation for Economic Co-operation and Development
BTV Bangladesh Television
NGO Non-Governmental Organization
TK Taka
UNHCR United Nations High Commissioner for Refugees COVID-19 Coronavirus Disease-19
MW Megawatts DE Design Effect
Preface
The Asia Foundation in Bangladesh and BIGD of BRAC University jointly conducted the second Citizens’ Perceptions Survey on Governance, Development, and Society: A Survey of the Bangladeshi People – produced by The Asia Foundation since 2014. This latest report uses a divisionally representative survey, with fieldwork conducted from November 2022 to January 2023 in all 64 districts of Bangladesh with a sample of 10,240 men and women.
Principal themes covered in the survey include citizens’ perception of Bangladesh’s society, politics, and economics articulated through perceptions of political governance and representation, citizenship, democracy, and inclusive development. Perceptions on cross-cutting issues such as social cohesion and trust are also included. Contemporary issues ranging from perceptions about digitalized Bangladesh, and social media’s role in influencing policymaking to perceptions of what should women wear are also covered.
This survey creates a longitudinal series of respondent perceptions of the political, economic, and social atmosphere of the country. In an effort to ensure the relevance and timeliness of the survey, the instrument is updated annually. While some of the questions are kept to ensure longitudinal comparability, a large set of questions are added or modified to capture the recent changes in the governance environment of the country. Regarding the survey method, we attempt to record citizens’ views as accurately as possible. None of the open-ended survey options are read out loud. All the standard monitoring protocols are strictly followed to ensure data quality.
Data safety and privacy protocols are strictly upheld.
Monitoring citizens’ perceptions over time and on emerging issues is important for developing a culture of deliberative democracy. This needs to be rigorously designed, contextualized, implemented, and analyzed Inclusive and innovative dissemination of the results to create public discourse on issues is critical. We hope to continue working on these challenges.
We are grateful to the Australian High Commission in Bangladesh for supporting this survey. We are also thankful to the editor of the report, Dr. Tabasum Akseer. The Institutional Review Board provided ethical clearance and guidance to the survey, which enhanced the survey quality.
Finally, we would like to acknowledge the respondents across the country who willingly took the time to answer our questions on critical issues and collectively contributed to a richer understanding of the perspectives of the Bangladeshi people.
Dr. Imran Matin Kazi Faisal Bin Seraj
Executive Director Country Representative
BRAC Institute of Governance and The Asia Foundation
Development (BIGD), BRAC University Bangladesh
Acknowledgements
The state of Bangladesh’s Political Governance, Development and Society : According to its Citizens Survey is a collaborative product of The Asia Foundation and BRAC Institute of Governance and Development (BIGD). This is the product of numerous contributions from the partners and staff of The Asia Foundation.
The survey report was produced under the guidance of Bangladesh Country Representative Mr. Kazi Faisal Bin Seraj and led by a team working under the direction of Ms. Ainee Islam, Director of Program Development.
Additional editorial support was provided by Dr. Tabasum Akseer, Senior Advisor, Program Specialists Group, The Asia Foundation.
The Asia Foundation thanks Md. Abdul Awal (Coordinator), Zaima Sultana Promy (Data Associate), and Syed Mafijul Islam (Field Associate) of BIGD for their contribution to the data collection process.
The Institutional Review Board (IRB) provided valuable assistance in securing permission to conduct fieldwork, while the Bangladesh Bureau of Statistics provided population estimates used for the formulation of survey weights.
The Asia Foundation is grateful to the respondents who took the time to participate in this survey.
The Asia Foundation thanks the Australian High Commission in Bangladesh for their financial assistance that enabled the survey to take place.
Bangladeshi students during a protest for removing or reforming a quota system in government jobs in Dhaka, Bangladesh.
Executive Summary
In this year’s The state of Bangladesh’s Political Governance, Development and Society: According to its Citizens survey, a total of 10,240 respondents are surveyed across the country from November 13, 2022, to January 26, 2023.
The final sample size was 50% men and 50% women. All respondents are aged 18 years and above, the majority between 18 and 30 years old (46%), 39% aged 31 to 50 years, and 15% over 50 years old. More than half, 64%
of the sample are from rural areas, and 36% from urban.
Perceptions of Society, Politics, and Economy
Respondents are asked about the political direction of the country, and if they think Bangladesh is heading in the right or wrong direction. Almost half of respondents (48%) say Bangladesh is heading in the wrong direction, an increase from 31% in 2019.
Figure 1.1: Summary of response to what direction the country is heading.
Focus Area Social Political Economical
Year 2019 2022 2019 2022 2019 2022
Right direction (%) 77.0 57.5 63.6 39.1 70.3 25.2 Wrong direction (%) 21.9 38.7 30.7 47.5 28.0 69.7
* The table doesn’t include “no response “and “don’t know” responses
The proportion of respondents who believe Bangladesh is moving in the right direction socially dropped from 77% in 2019 to 58% in 2022, a decrease of 19 percentage points.
From an economic perspective, 70% of respondents in 2019 thought the country was heading in the right direction, however, this dropped to 25% in 2022.
Seventy-one percent of respondents can accurately name their Members of Parliament (MPs), a relative decrease from the highest recorded in 2017 with 86%. Under half (45%) say their MPs have visited their local areas in 2022.
More than half of respondents (64%) are satisfied with their MPs’ work, compared to 27% who are dissatisfied or very dissatisfied with their MP’s work. A majority (86%) can accurately identify their local chairperson/
mayor.
Less than half (44%) are very satisfied with the UP chairperson/
municipality mayor, while 31% are somewhat satisfied. A similar proportion (46%) are unlikely to vote for a candidate if he/she changed their political party. Almost half (49%) consider the personal traits of candidates the most important factor for being elected.
Respondents are asked to report any types of political violence they have observed in Bangladesh. A quarter did not want to provide an answer.
Among the remaining, 24% say political conflicts between parties or factions are the major types of violence they observe, followed by onesided politics (7%), mastani1 (4%), revenge (3%), and corruption (3%).
Citizenship
Respondents are asked to identify three things they would need as a citizen to live with dignity: 27% cite money as the primary factor for a dignified life, followed by education (13%), good manners (10%), and food (8%).
The Survey asks what is most required to live freely, similar responses are captured with almost a third cite money (32%), freedom of movement (9%), education (8%), safety (5%), food (5%), employment (4%) and freedom of expression (4%). As education levels increase, there is a decrease in the proportion of respondents who cite money, 40% among those with no formal education compared to 13% of those with graduate and above.
Democracy
More than a third of respondents admit they “don’t know” (36%) what is meant when a country is called democratic. Nearly one-fifth said “equal rights for all” (18%), people’s freedom (17%), government by the people (15%), the opportunity to vote freely (15%), freedom of speech (11%), and public participation in all activities (7%) are the most popular response fiftieth selected “other” responses (20%), and 4% did not provide an answer. The proportion of respondents who “don’t know” what is meant by democracy increased from 5% in 2019 to 36% in 2022.
More than half of respondents say they voted in the previous UP/
Municipality/City Corporation (69%) and national parliamentary elections (52%). Findings show 96% intend to vote in the upcoming elections. A majority (72%) strongly or mostly agreed with the statement: “One can observe a dominant role of one party in politics/governance,” a decrease from 86% in 2019. The proportion of respondents who say the dominant party system has a positive impact on politics, decreased from 45% in 2019 to 19% in 2022. In governance, the percentage of respondents who say the impact of the dominant party system is positive also dropped from 47% in 2019 to 22% in 2022.
When asked if people in their locality felt free to express their political opinions, 43% feel free, an increase from 37% in 2019.
A majority, 96% are aware of the different cards and allowances distributed by the government, similar to the 99% in 2019. More than half 59% said they are sufficient, an increase compared to 48% in 2019. When asked about fairness in distribution, an increased percentage felt that the social safety net distribution is done “fairly,” from 20% in 2019 to 32% in 2022.
When asked about women’s engagement in politics and leadership, the strongest support is for women’s participation in the national parliament (53%), Zila Parishad (48%), and Upazila Parishad (47%), Pouroshabha/
City Corporation (46%), and Union Parishad (44%). More than half said they would vote for a man (58%), 18% said woman, 4% said transgender, 3% said either man or woman but not transgendered person and 16% said gender did not matter.
Among the institutions, elected offices and officials are highly trusted.
People also have trust in the military. In contrast, 67% of the respondents felt that political parties are trustworthy. Interestingly, compared to 2019, the trust in institutions didn’t change much but close examination suggests that for some institutions, the percentage of people expressing high trust has decreased. For instance, trust in army and RAB has decreased by 11 and 14 percentage points. A similar trend is noted with respect to political parties and parliament.
Digitalized Bangladesh, Social Media, and Policy Influence
A majority of respondents, 82%, have their own mobile phones. Nearly half use the internet at 47%. A majority who have access to the internet use Facebook (85%), Messenger (72%), and IMO (71%). Almost a third of respondents who use Facebook, do so to obtain national news (28%, 21% for entertainment purposes, 16% use Facebook to share news/ideas/
concerns with friends and family, 10% use the platform to communicate with family and friends, and 6% use the platform to watch movies.
Half of the respondents say Facebook cannot be used to ensure
responsiveness of the state (not very often and never). More than half, 55%
say Facebook cannot be used to ensure accountability of the state (not very often and never). Seventy-three percent say it is never or not very often safe to post political opinions on Facebook. Sixty-three percent believe it
is never or not very often safe to post opinions about social issues in the country. A majority follow news through Facebook (73%), 60% watch private channel news, and 25% read the newspaper. Bangladesh television (60%) and print media (50%) are the most trusted as they are viewed as very and mostly free.
Inclusive Development
More than half of respondents consider the development of infrastructure to be the ‘development’ of the country, at 67%. For 52%, the development of everything was needed as a precursor to ensuring the development of the country, 36% said the development of education (36%), development of electricity, water, and gas (17%), poverty reduction (12%), development of religious infrastructure (11%), and employment generation (11%), price control (10%), development of environment (10%), law and order (8%), other (6%) and political development (5%). Minor differences emergeamong urban and rural respondents.
Social Cohesion, Trust and Rohingya Issues
In 2018, 34% of respondents said they would welcome Rohingya in their communities, this dropped to 15% in 2019, and again to 13% in 2022.
Asked if the Bangladesh government was doing enough for the Rohingya refugees, 85% feel the government is either doing enough or a lot for the refugees.
Forty percent of respondents say the international community is doing enough for the Rohingya, 19% say the international community is doing a lot, and 13% say the international community is not doing enough. Almost a quarter (23%) don’t know if the international community is doing enough or not. In 2018, 45% said Rohingya should stay until it is safe to return, in 2022 this dropped to 14%. A majority believe the Rohingya refugees have brought about negative effects, 81%. Only 8% say the changes have been positive, while 6% say they don’t know, and 4% say there are no effects.
Contemporary Issues
A majority say the opening of Padma Bridge for public use is the most important success at 72%, and 20% identified it as an important positive event, 4% are concerned about its cost or implementation, 3% are concerned about the benefit compared to the cost, and 1% did not know about the bridge. Nearly half (47%) credit the bridge’s construction to the Prime Minister or Sheikh Hasina, while 28% credit the Bangladesh government. When asked if they can think of any benefit the bridge may bring, 89% responded affirmatively, 8% said no and 3% did not know.
Asked if the recent fuel price hike affected their lives, 81% say their lives are severely affected, and 15% are somewhat affected. Similarly, 84%
say the recent commodity price hike severely affected their lives, for 13% it has somewhat affected their lives. More than half, 62% said the increased electricity production and nationwide electrification is the most important success, while 19% say it is an important positive event. A similar percentage say the government’s vaccination drive was very successful 62%, 19% somewhat successful, 13% unsuccessful and 5% consider the drive very unsuccessful.
A majority (83%) support women’s participation in earning activities, 70%
agree both men and women should have an equal share of their father’s property, 69% support women working outside of the home, 62% say men should be prioritized over women for employment opportunities, and 40%
agree women should dress how they prefer. More than half (53%) says western dresses are unacceptable for women, followed by 23% who say sleeveless dresses are unacceptable, and 16% who say indecent dresses.
When asked what kind of relationship they have with people from different religious communities, 55% have a good relationship, and 41% have a very good relationship. When asked what kind of relationship people from different religious communities in Bangladesh have with one another, 63%
say the relationships are good, and 21% say very good.
Workers gather in the morning at a boat terminal waiting to cross the Mongla River in Khulna, Bangladesh.
01 Demographic and Socio-Economic Profile
Bangladesh is a rapidly developing country with a young and growing population. While the nation has made significant progress in reducing poverty and improving its economy, challenges such as inequality and the need for sustainable development, remain.
Perceptions, challenges, and experiences of the Bangladeshi people are explored in this year’s The State of Bangladesh’s Political Governance, Development and Society: According to Its Citizens. A total of 10,240 men and women are surveyed across the country from November 13, 2022, to January 26, 2023. The final sample size is 50% men and 50% women. Nearly half of respondents are aged between 18 and 30 years old (46%), 39% are aged 31 to 50 years, and 15% are over 50 years old. More than half (64%) of respondents are from rural areas and are 36% from urban.
Figure 1.2: Respondents’ age and gender
Category Percentage (%) Sample size (n)
Gender Male 50 5,120
Female 50 5,120
18-35 58.89 6,030
Age group 36-55 30.32 3,105
55 and up 10.79 1,105
A lower-middle-income country, the nation’s economy has proliferated in recent years, with an average annual growth rate of around 6% over the past decade (Asian Development Bank, 2023). The country still faces significant challenges, such as high poverty rates and inequality. Around 10.44% of the population lives below the poverty line (Poverty and Equity Brief, South East Asia, Bangladesh, 2023), disproportionately affecting rural areas. The country has made significant progress in reducing poverty in recent years, and the government has set a target of eradicating extreme poverty by 2030 (UN, n.d.).
Less than a fifth of respondents have no formal education (18%), this proportion is slightly higher among men (19%) compared to women (14%). Nearly half have up to primary education 45%, 30% up to higher secondary, and 8% have a bachelor’s degree or higher. A slightly higher proportion of women (9%) completed higher education compared to men (6%).
Figure 1.3: Respondents’ education (by gender).
Bachelors & above 8 10 6
Up to higher secondary 29 30
31
Up to primary 41 45
49
No education 16 19
14
0 10 20 30 40 50
Overall Male Female
In both urban and rural areas, the majority of female respondents are housewives. In rural areas, the majority of male respondents identify as farmers, being involved in business or job holders. However, occupational variations are not very pronounced among rural and urban areas.
Figure 1.4: Respondents’ occupation (by strata).
Urban Rural
Occupation Male Female Male Female
Farmer 20 9 30 11
Transport worker 6 0 5 0
Job holder 19 11 13 8
Housewife 0 67 0 66
Student 13 9 13 10
Not working 11 2 11 2
Business 18 1 15 1
Other 13 2 14 2
The average household has approximately 5 members, consistent for both urban and rural households. Respondent’s income levels are varied. Almost a third (27%) report a monthly household income of 10,000 TK or under.
60
Household income distribution
Almost half of report earning between 10,000 to 20,000 TK per month (49%). Approximately 27% of households report less than 10,000 TK per month, while only 3% of households reported around 40,001 to 50,000 TK per month. On average, households report spending about 18,470 TK per month. Notably, households from rural areas reported spending approximately 1,871 TK less per month compared to households in urban areas.
Figure 1.5: Household monthly income (by strata).
40001-50000Tk 3 3 2 30001-40000Tk 44
3
20001-30000Tk 16 17 14
10001-20000Tk 4951
48
>10000Tk 26 27
35
0 10 20 30 40 50 60 70 80 90 100
Overall Urban Rural
Half of the households are built with brick (50%) or Corrugated galvanized Iron (CI) sheet, tin, or wood (43%). Only 7% of the households are built with other elements.
An employee of a fuel station fills petrol in a vehicle in the Paribagh area in Dhaka.
02 Perceptions of
Society, Politics and
Economy
2.1 The direction of the country 2.1.1 Social direction
Respondents are asked if they think the country is socially heading in the right or wrong direction. The proportion who say the country is socially heading in the right direction dropped from 77% in 2019 to 58% in 2022, a decrease of 19 percentage points. Those who say the wrong direction increased from 22% in 2019 to 39% in 2022. Urban respondents are somewhat more likely to say things are heading in the wrong direction (39%) than rural respondents (35%).
Figure 2.1: Do you think Bangladesh is going in the right direction socially? (by area)
Overall Urban Rural
3 1 58 39
4 1 57 39
4 1 60 35
0 10 20 30 40 50 60 70 80 90 100
Percentage of cases
Don’t know No response Right direction Wrong direction
By income, some differences arise. More than half of respondents earning less than 10,000 TK per month believe Bangladesh is going in the right direction socially, 61%. However, as income increases, so does pessimism among respondents who think Bangladesh is going in the wrong direction socially. Over half of those who make between 40,001 TK to 50,000 TK say Bangladesh is going in the wrong direction socially (51%).
Figure 2.2: Do you think Bangladesh is going in the right direction socially (by income)?
40001-50000 TK 30 51 46
30001-40000 TK 20001-30000 TK 10001-20000 TK Less than 10000 TK
0 10 20 30 40 50 60 70 80 90 100
4 0 61 34
5 0 58 37
5 1 53 41
10 57 41
Percentage of cases
Don't know No response Right direction Wrong direction
ss•3o'0"E go•o·o"E 91•3o'0"E
~
.... ____
..___________
..___________
.__________ __
p ....
N
z b
b "'
:,,
N
;z b p
;:!;
;z b b
"'
;.,,
N
z b p ....
N
India
India
•
brae institute of governance &
development 88°30'0"E
Percentage of respondents stating Bangladesh is going to the right direction socially
(Percentage of responses in support of this statement) Legend
- 60-80%
- More than 80%
Bay of Bengal
0 40 80 160
Kilometers
Cartography: Raihan Ahamed, 2023
Data source: Democracy Perception Suivey, 2022
go•o·o"E 91°30'0"E
;z b p ....
N
z b
b l"
"'
N
;z b p
;:!;
;z b b
"'
;.,,
N
z b p ....
N
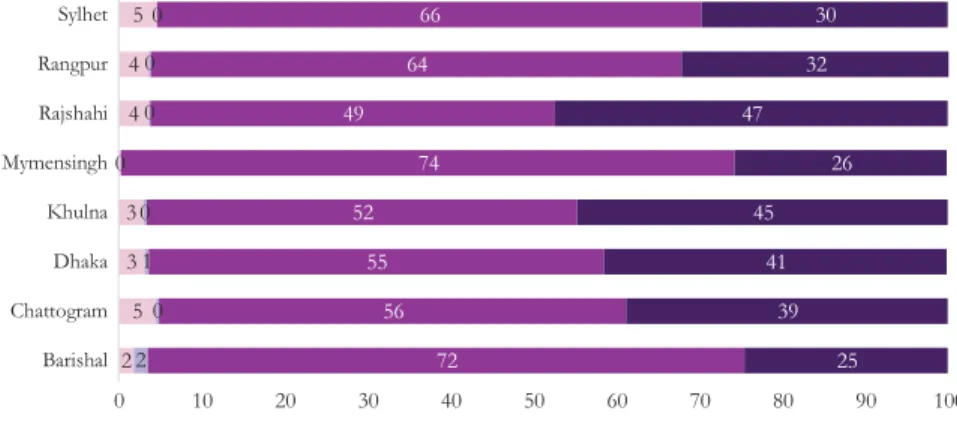
By division, respondents in Mymensingh are most optimistic (74%) the country is going in the right direction. Barishal, Sylhet, and Rangpur divisions also had more than 60% of respondents share this opinion.
Figure 2.3: Do you think Bangladesh is going in the right direction socially (by division)?
Sylhet Rangpur Rajshahi Mymensingh Khulna Dhaka Chattogram
Barishal 2 2 1
0 0
0 0 0
5 3 3 0
4 4 5
72 56 55 52
74 49
64 66
25 39 41 45
26 47
32 30
0 10 20 30 40 50 60 70 80 90 100
Don't know No response Right direction Wrong direction
Among respondents who say Bangladesh is socially heading in the right direction, the main reasons for optimism are; people are working for society (48%), security is good (39%), there is law and order (30%), good education quality (13%), everyone can practice their religion (11%), good governance (8%), and 11% cited other reasons.
Among the 39% who say the country is socially heading in the wrong direction, the top cited reasons are: deterioration of law and order (64%), increase in corruption (23%), bad education system (16%), increase in drug use (16%), innocent people are being tortured (11%), increased violence against women (9%), rich people have more power (7%), boys/girls are getting spoiled (6%), women have no freedom (6%), increase in rape (5%), and 11% cited other reasons.
2.1.2 Political direction
Politics in Bangladesh are dominated by two major parties, the Awami League and the Bangladesh Nationalist Party (BNP). The former, the Awami League has been in power since 2009, led by Prime Minister Sheikh Hasina. In recent years, the nation’s economy has grown steadily, with a focus on exports and the garment industry. The country has made significant progress in poverty reduction, and the poverty rate has decreased from over 40% in 2005 to less than 20% in 2021 (Ministry of Finance,
2022). However, Bangladesh still faces challenges including corruption, poor infrastructure, and climate change. Despite the political and economic challenges, the country has shown resilience and progress in recent years.
Respondents are asked about the political direction of the country, and if they think Bangladesh is heading in the right or wrong direction. Just under half (48%) say Bangladesh is heading in the wrong direction, an increase from 31% in 2019. More than one-third (39%) say the country is heading in the right direction, a decrease from 64% in 2019. The percentage of respondents uncertain about the direction of the country also increased from 5% in 2019 to 11% in 2022.
Findings are somewhat consistent among urban and rural populations, with the latter being more optimistic things are politically heading in the right direction (42%) than urban respondents (38%). (Figure 2.4).
Figure 2.4: Do you think Bangladesh is going in the right direction politically (by strata)?
Overall Urban Rural 0
11 3 39 48
11 3 38 47
11 3 42 43
10 20 30 40 50 60 70 80 90 100
Don’t know No response Right direction Wrong direction
Interestingly respondents with a lower monthly household income are more likely to say the country is going in the right direction. The reverse is also true as respondents reporting the highest monthly income are more likely to say Bangladesh is going in the wrong direction (Figure 2.5).
Figure 2.5: Do you think Bangladesh is going in the right or wrong direction politically (by income)?
40001-50000 Tk 31 57
30001-40000 Tk 42 46
20001-30000 Tk 38 47
10001-20000 Tk 39 46
Less than 10000 Tk 44 43
0 9 3 9 3 11 4
12 3 11 3
10 20 30 40 50 60 70 80 90 100
Don't know No response Right direction Wrong direction
ss•3o'o"E 90•0°0"E 91•3o'o"E
b.-____ ..., ___________ .._ __________ _. __________ ...
b 1--
N
z b
lil ::n
N
;z b p ....
N
India
India
■brae institute of
governance &
development 88°30'0"E
Percentage of respondents stating Bangladesh is going to the right direction politically
(Percentage of responses in support of this statement) Legend
-60-80%
- More than 80%
Bay of Bengal
0 40 80 160
Kilometers
Cartography: Raihan Ahamed, 2023
Data source: Democracy Perception Survey, 2022
go•o·o"E 91°30'0"E
z b b 1--
N
z b
lil ::n
N
Higher levels of optimism are among respondents from Mymensingh (54%), Barishal (51%), and Rangpur (48%) who say things are politically heading in the right direction. Lower optimism levels are among those in the capital, Dhaka (35%), Sylhet (35%), and Rajshahi (36%).
Figure 2.6: Do you think Bangladesh is politically going in the right direction (by division)?
Sylhet Rangpur Rajshahi Mymensingh Khulna Dhaka Chattogram
Barishal 6 11
12 8 7 10
8 17
10 2 3 4 2
2 1
1
51 39
35 39
54 36
48 35
34 49 50 49
37 52
42 47
0 10 20 30 40 50 60 70 80 90 100
Don't know No response Right direction Wrong direction
Among the 39% of respondents who say Bangladesh is moving in the right direction, in a follow-up question they provide reasons why. Just over half, 51% cite political stability as a reason why Bangladesh is moving in the right direction. Other reasons include: the development of the country (22%), improved human rights situation (20%), reduced political violence (15%), reduced terrorism activities (10%), and infrastructure development (2%).
Among the 48% who say Bangladesh is politically heading in the wrong direction, top cited reasons ranged from instability (46%), the dominance of one political party (25%), price hikes (20%), 12% stated their vote was cast without their consent, increase in terrorist activities (11%), a lack of discipline (11%), no democracy (10%), one-sided politics (10%), and a lack of opportunity to express opinion (9%).
2.1.3 Economic direction
Respondents are asked if, from an economic perspective, the country is heading in the right or wrong direction. Findings are dramatically different than in 2019, when 70% said the country is heading in the right direction, this dropped to 25% in 2022. In 2019, 28% said the country was heading in the wrong direction, this increased to 70% in 2022. Rural respondents are more optimistic about the direction of the country than urban respondents (30% rural compared to 25% urban respectively).
Figure 2.7: Do you think Bangladesh is going in the right direction economically? (by area) Overall
Urban Rural
4 1 25 70
4 1 25 70
4 1 30 65
0 10 20 30 40 50 60 70 80 90 100
Percentage of cases
Don’t know No response Right direction Wrong direction
Interesting variations emerge by income. While the majority of respondents across all income groups say Bangladesh is going in the wrong economic direction, however respondents among the highest income group are the most pessimistic, with 87% who say Bangladesh is going in the wrong direction. The lowest income group was slightly less negative, with 64%.
Figure 2.8: Do you think Bangladesh is going in the right direction economically (by income)?
40001-50000 TK 30001-40000 TK 20001-30000 TK 10001-20000 TK Less than 10000 TK
0 10 20 30 40 50 60 70 80 90 100
Percentage of cases
Don't know No response Right direction Wrong direction
0 12 87
29 68
21
4 1 22 72
24 71
4 2
4 1 31 64
By division, the highest levels of pessimism were among respondents in Sylhet with 76% who say Bangladesh is going in the wrong direction, while the lowest levels are in Mymensingh at 49%.
ss•3o'o"E 90•0°0"E 91 •3o'0"E
b _____ ..., ___________ .._ __________ _. __________ ~b
0 0
~ Percentage of respondents stating Bangladesh is ~
'!!!:
0 0 m :,.,
N
z b
0 ~ N
z b 0 m ;,,
N
z b
~ N
India
India
II
brae institute governance of &development ss•3o'o"E
going to the right direction economically (Percentage of responses in support of this statement)
Legend
-60-80%
- More than 80%
Bay of Bengal
0 40 80 160
Kilometers
Cartography: Raihan Ahamed, 2023
Data source: Democracy Perception Survey, 2022
go•o·o"E 91°30'0"E
z b
0 ~
z b 0 m ;,,
N
z b
~ N
4
Figure 2.9: Do you think Bangladesh is going in the right direction economically (by division)?
Sylhet Rangpur Rajshahi
Mymensingh 2 49 49
Khulna
Dhaka 4 19 75
Chattogram
Barishal 3 40 52
0 10 20 30 40 50 60 70 80 90 100
6 4 3 3
26 21
69 25
37
72 19
75 60 76
Don't know No response Right direction Wrong direction
Among the quarter of respondents who say the country is heading in the right direction, the top reasons include: good economic condition (46%), overall development (36%), good infrastructure (27%), increased employment (16%), increased quality of life (14%), there is no shortage (14%), improved business (11%), offering of various government allowances (10%), communication system improvements (9%), improved electricity system (7%), salary increases for government jobs (4%), and 9%
cited other reasons.
Among the 70% who say Bangladesh’s economy is heading in the wrong direction, the most frequently cited reasons are the high price of products (84%), poor economic conditions (35%), increased scarcity of necessary goods (25%), lack of employment opportunities (16%), pay is less compared to workload (10%), decent employment opportunities (8%), business is down (8%), and 6% cite other reasons.
2.2 The major problems faced by the country
The respondents were asked to identify the major challenges currently faced by the country, and about 44% said that the main problem in Bangladesh is
‘price hike’. Other significant issues mentioned by the respondents include business downturn (11%), unemployment (10%), political instability (8%) and corruption (3%).
After casting vote, a voter displays the indelible ink mark on her finger.
03 Politics and Elected Leaders
Chapter 3 explores citizens’ perceptions of politics, political parties, elected representatives, and respondents’ awareness and expectations of elected leaders. This chapter also explores citizens’ perceptions of political identity, loyalty towards political parties, and the political process.
In Bangladesh, political polarisation is typical, and political views can be influenced by factors such as religion, ethnicity, educational background, political affiliation, and socioeconomic status. Perceptions of politicians and elected leaders vary. As findings demonstrate, some view leaders as effective and honest, while others view leaders as corrupt and unresponsive to their needs. While some respondents may be actively engaged in politics and hold strong opinions therein, others are apathetic. Amid positive developments, such as the emergence of civil society groups and the growth of a vibrant media sector, concerns about the lack of transparency and accountability in government, allegations of electoral fraud and human rights abuses exist. Political perceptions in Bangladesh remain complex and multifaceted, reflecting its citizens’ diverse experiences and perspectives.
3.1 Awareness and expectations of national representatives
When asked, 71% of respondents can correctly name their Members of Parliament (MPs). While this percentage is high, it is relatively lower than in previous years, the highest recorded was in 2017 with 86%, followed by 81% in 2018, and 82% in 2019.
Notable differences emerge by gender, 90% of men compared to 61% of women can correctly identify their MP. Rural respondents are only slightly more informed compared to urban respondents (77% compared to 71%).
Figure 3.1: Can you name your MPs correctly (by year)?
100 86
90 81 82
80 70 60 50 40 30 20 10
0 2
12 5 14
4 14 71
6 23
2017 2018 2019 2022
Correctly said Incorrectly said Don’t know
A majority (90%) of respondents with higher levels of education can accurately identify their MP, whereas this percentage drops to 71% among those with no formal education.
By income, only 62% of respondents reporting less than 5000 TK per month are accurate, compared to 90% of respondents earning more than 50,000TK.
As age increases, so does the ability to identify their MPs. Among those aged 55 years and above, 84% can identify their MP, higher than 70% of those aged 18–25 years.
Interestingly, by division respondents in Dhaka are much less able to accurately identify their MP (65%) than those in Barishal (80%), the highest among all divisions.
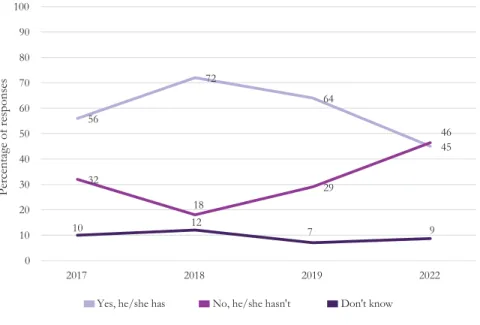
Respondents are also asked if their MPs have visited their local areas. In 2017, 56% said their MP had visited, however after an upward spike to 72%
in 2018, this decreased to 45% in 2022.
Figure 3.2: Did your MP visit the locality in recent years (by year)?
100 90 80
56
72
64
45 32
18
10 12
7 9
29
46
10 20 30 40 50 60 70
Percentage of responses
0
2017 2018 2019 2022
Yes, he/she has No, he/she hasn't Don't know
Similar responses are recorded when asked if respondents remember any specific task or initiative their MP took last year, 30% said yes, and 70%
could not remember any specific task.
Respondents are asked if they agree or disagree with the statement: “MPs care about general citizens.” More than half (55%) completely or somewhat agree MPs care about their constituencies, a decrease from 64% in 2019.
Forty-two percent disagree that MPs care about general citizens.
Interesting trends emerge with respondents in Dhaka, Sylhet, and
Chattogram more likely to disagree with the sentiment that MPs care about general citizens.
Figure 3.3: Do you agree or disagree MPs care about general citizens (by division)?
Mymensingh Rangpur Barishal Rajshahi Chattogram
Sylhet
40 34 31 31 22 20 17 16
30 27 32 31 28
32 27
35
5 15 7 6 9
20 18
7
24 22 26 28 38
26 35 35
1 2 3 4 3 2 4 7
0 10 20 30 40 50 60 70 80 90 100
Khulna
Dhaka
Completely agree Somewhat agree Disagree Strongly disagree No response
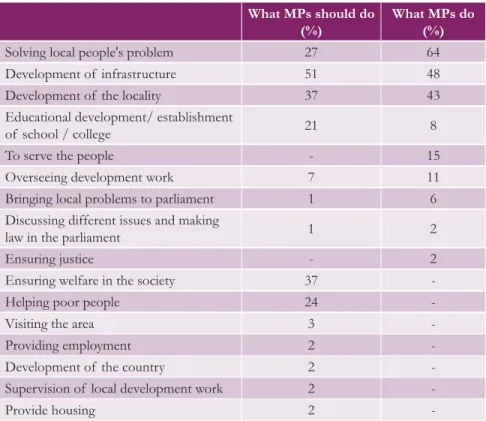
The Survey also explores citizens’ perceptions of what MPs currently do and what they should do. Responses to both open-ended questions are aligned, the top responses in both categories are solving local people’s problems, development of infrastructure, and development of locality. A notable difference emerges as more respondents say MPs should ensure welfare in society (37%) while this did not emerge at all for what MPs do. (Figure 3.4).
Figure 3.4: What MPs do and what they should do (These were multiple choice questions).
What MPs should do
(%) What MPs do
(%)
Solving local people's problem 27 64
Development of infrastructure 51 48
Development of the locality 37 43
Educational development/ establishment
of school / college 21 8
To serve the people - 15
Overseeing development work 7 11
Bringing local problems to parliament 1 6
Discussing different issues and making
law in the parliament 1 2
Ensuring justice - 2
Ensuring welfare in the society 37 -
Helping poor people 24 -
Visiting the area 3 -
Providing employment 2 -
Development of the country 2 -
Supervision of local development work 2 -
Provide housing 2 -
More than half of respondents (64%) are satisfied or somewhat satisfied with their MP’s work, compared to 27% dissatisfied or very dissatisfied.
Compared with 2019, there is a proportional decrease in those stating they are very satisfied and an increase among those who are very dissatisfied.
Figure 3.5: How satisfied are you with your MP’s work (by year)?
100 90 80 70 60
50 39
Very satisfied Somewhat Dissatisfied Very Don't know
satisfied dissatisfied
34
14 10
4
31 34
8
19
9 0
10 20 30 40
Percentage of responses
2019 2022
There are no notable differences in responses by income, education, gender, and strata. By division, some variances emerge for example the highest levels of satisfaction in Mymensingh and Barishal, compared to the lowest in Khulna and Dhaka.
Figure 3.6: How satisfied are you with your MP’s work (by division)?
Mymensingh Barishal Rangpur Rajshahi Chattogram Sylhet Dhaka Khulna
39 35 33 31 31 30 29 29
29 32 35 29
39 24
37 31
4 6
12 7
5 17
5 17
25 24
17 26
20 24 17
14
4 4 4 7
7 5 13
9
0 10 20 30 40 50 60 70 80 90 100
Very satisfied Somewhat satisfied Dissatisfied Very dissatisfied Don't know
3.2 Awareness of and expectations from local representatives
Respondents are asked about their local representatives. A majority, 86%
can accurately identify their local chairperson/ mayor. This is a decrease of 5 percentage points compared to 2019. Rural respondents are slightly more informed about their local representation than urban respondents (92% vs 88%).
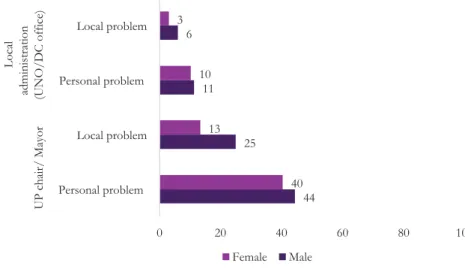
Seeking support for local and personal problems from local government representatives is much more prevalent than seeking help from the local administration: 40% sought help from UP Chairperson/MP for a personal matter, compared to 8% who sought help from UNO/DC office.
Figure 3.7: Did you contact your local representatives and local administration in the last year?
Seeking help from 40 UP chairperson/ mayor
Seeking help from UNO/ DC office
8 18
4
0 20 40 60 80
Personal problem Local problem
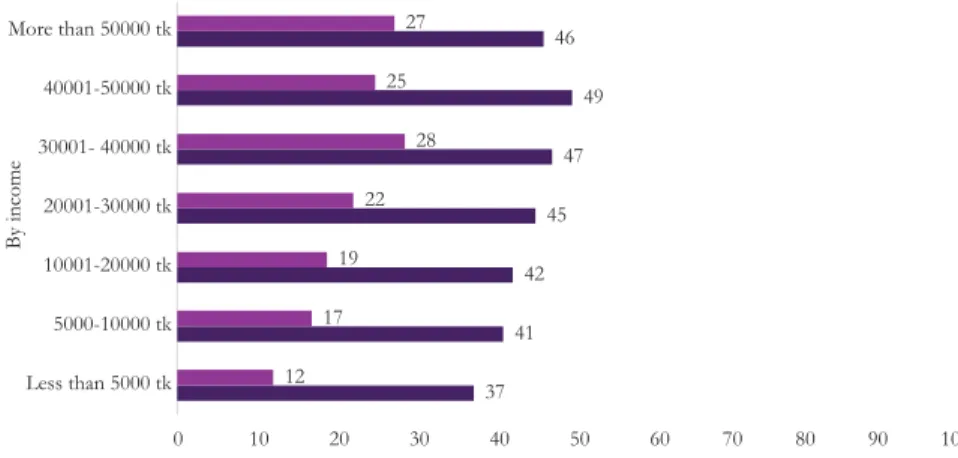
Respondents with higher levels of income and education are more likely to contact their local government for both personal issues and local problems.
Figure 3.8: Did you contact your local representatives and local administrates in the last year (by income)?
More than 50000 tk 27 46
40001-50000 tk 25 49
30001- 40000 tk 28
47
20001-30000 tk 22
45
10001-20000 tk 19
42
5000-10000 tk 17
41 Less than 5000 tk 12
37
0 10 20 30 40 50 60 70 80 90 100
Meeting local government for local problem Meeting local government for personal reasons
Across all categories, women are slightly less likely than men to seek help from local representatives and administrators for personal and local issues.
By income