It will help both in increasing their employment opportunities and in better O&M work. ANNEXURE-E Approved Copy of Thesis Proposal ANNEXURE-F Erosion Prediction Model CD.
Background
About 80% of the highlands have already been eroded by the river, which causes serious problems in the relocation of residents. The tidal flow of the river has a strong influence on the erosion of the river bank.
Objectives of the Study
For small rivers like the Nabaganga, the empirical image an analysis may not be as accurate. In this case, prediction taking into account the velocity and characteristics of river sediment transport can be useful.
Structure of the Report
Limitations of the Study
Introduction
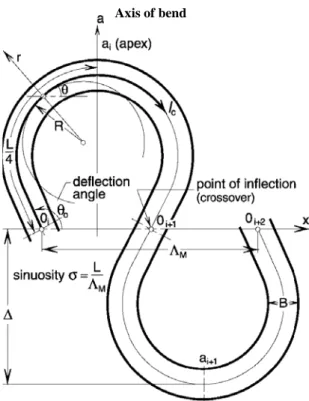
Geometric Characteristics of Meandering Stream
Effect of Centrifugal Force on Meander Bends
The water therefore plunges in, from above at the concave point, and moves below to the convex point.
Causes of Meandering
Meander Wavelength
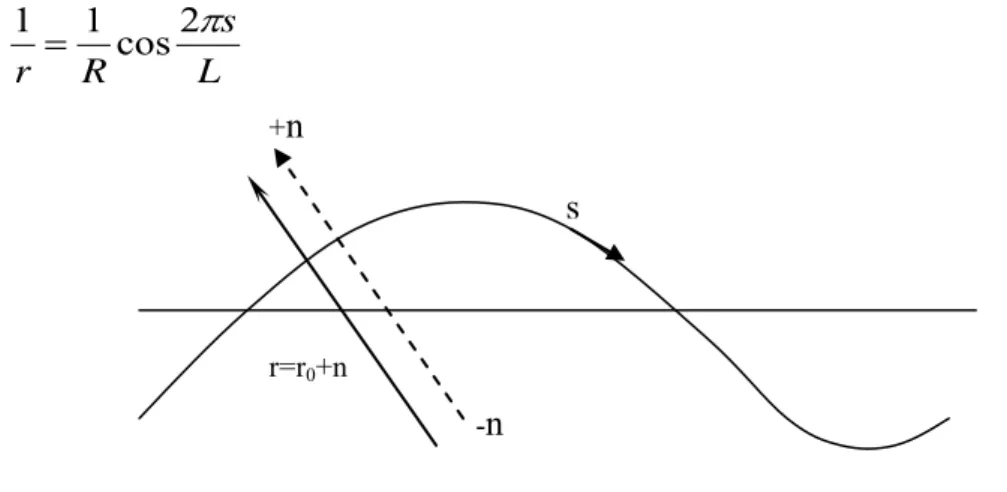
It should be clear from the equation that the fundamental property of sinusoidally generated channels is that they exhibit a continuous variation of central curvature 1/R(=−d• /dlc) along the flow direction. lc: at the intersections Oi, where lc = 0, L/2, L,.
According to da Silva (2006), the largest values of (dimensionless) curvature occur at the top at intermediate values of. For any given value of •0 and for the range of B/havg values, the location of erosional deposition z one is not affected by variation in B /havg. For a given value of •0, the largest • M /B and (cf)avg is the further upstream the erosional depositional zones will be.
Bed Topography and Velocity Variation in Bends
In this case, the s-coordinate is the distance along the center line of the channel, defined as the curve. The transverse component of the flow equation is assumed as .. where V equals the mean velocity.
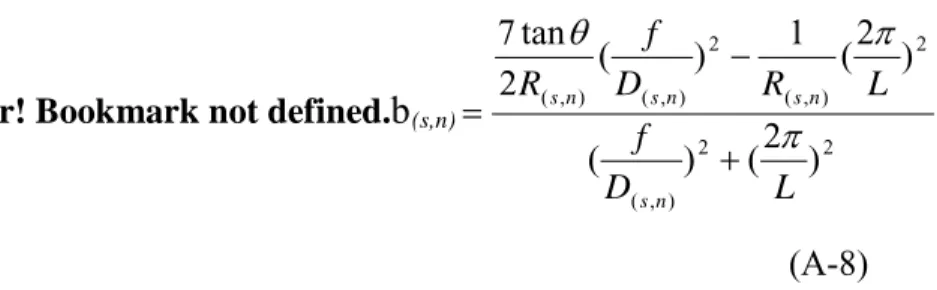
Erosion Estimation at the Bend of a River
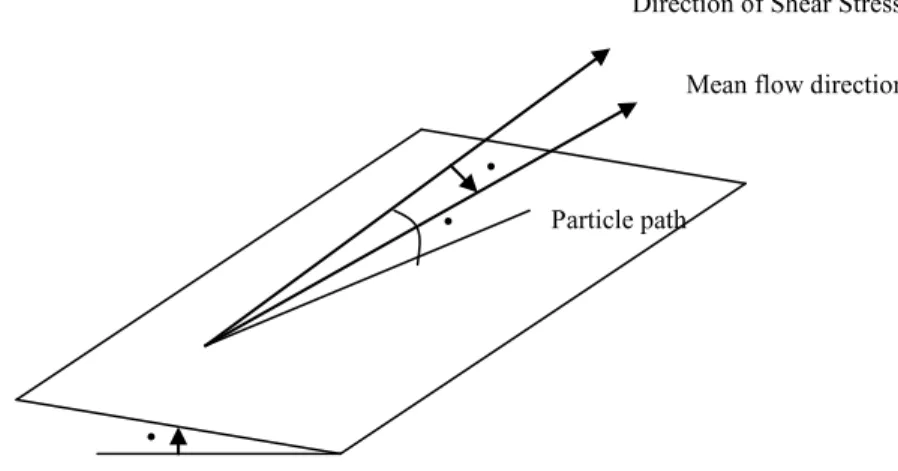
A check on the validity of the solution can be obtained by calculating the corresponding listening voltage distribution, τ. F or constant friction values of the actor tensile stress is proportional to the square of the speed so that.
Rural Livelihood Strategies
Poverty and Vulnerability
Access to social capital is limited to the poorer households because they cannot reciprocate - the inability to entertain guests limits social contact. Poorer households do not have good access to health care - they rely on local village doctors.
Indicators of Livelihood Security
Wealthy households' ability to secure long-term leases for common property (water bodies, marshland). The ability of wealthy households to use the police to harass poorer households to gain access to resources.
Topography
The study area was selected based on the deteriorating socio-economic condition of the location due to perpetual bank erosion of the river N abaganga.
Climate
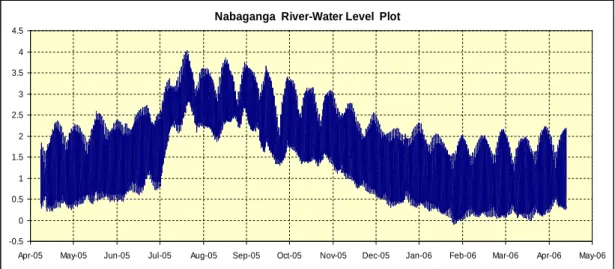
Hydrology
Demography
Infrastructure
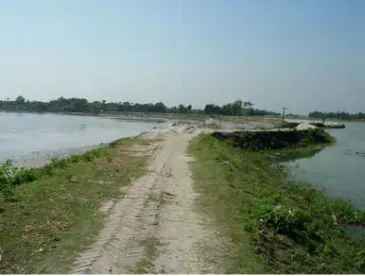
Bank Erosion Situation
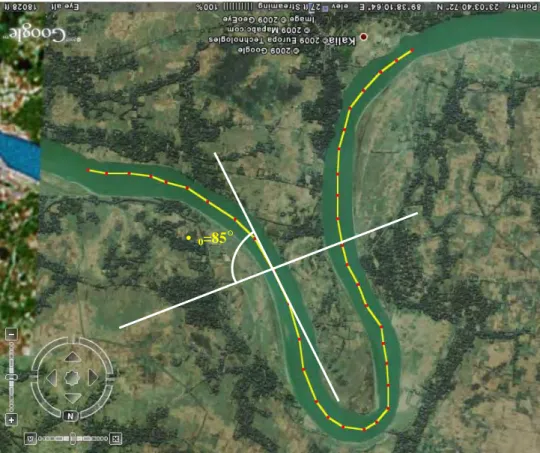
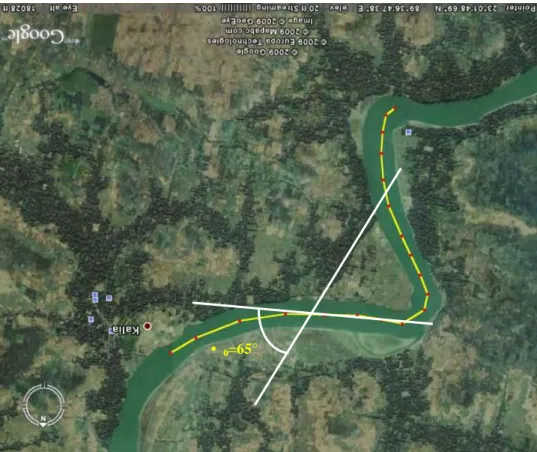
Potential erosion along the bank of B WDB has caused flood water to enter the agricultural land and destroy the Aman crop which greatly affects the livelihood as well as the socio-economic condition of the area. According to the information of the Union Parishad chairman as well as the common people of Noagram, 25% of the total people, who were landless, left the town. During the field in mid-December 2007, the high amplitude meander at Chander Char and a moderate amplitude meander at Noagram were selected as the study reach for comparative analysis.
At chander C, the river is eroding its bank at the head of the bend, and the bend becomes large in amplitude, while a N oagram tends to move downstream. Interviews were conducted with BWDB officials and local people to identify the study area.
Data Collection
Primary Data Collection (a) Selection of Sample Household
Most of the rusted people (about 2000 villagers) moved to the upstream and downstream of the erosion section of the bend. Maximum of the twins left for the city, some also left the country to earn their living as a labor in foreign countries. Position of the massive erosion spots for both Chander Char and Noagram, broken part of the flood embankment and other important structures were determined in the field with hand-held GPS.
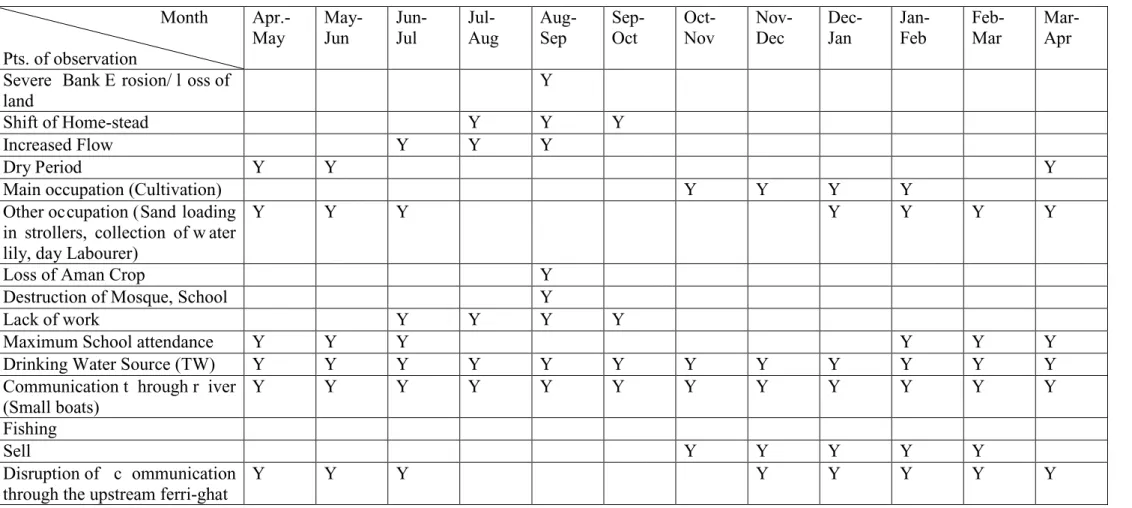
The subsistence activities of the local people in different months of the year were collected to prepare the seasonal calendar. Interviews were conducted in light of the objectives to collect qualitative information about bank erosion of the Nabaganga River and its impact on the livelihood of the local people.
Secondary Data Collection
Soil type, river width, serpentine length, embankment height, distance of the retired embankment from the old one and many other technical data were extracted from the field observation. Six FGDs were conducted with farmers, day laborers, women's groups and mixed community groups. It is prepared on the basis of information from endless armed workers, women's groups, vendors, school teachers and students.
Both structured and non-structured interviews were conducted with landless farmers, landless women, chairpersons of Union Parishad, primary and secondary school teachers, shopkeepers, daily wage workers, senior citizens and officials of BWDB.
Data Analysis
Analysis of data includes both the technical aspect and the socio-economic aspect. The technical data has been verified based on the information of local people, and the analysis has been carried out on both a social and technical level.
Technical Analysis
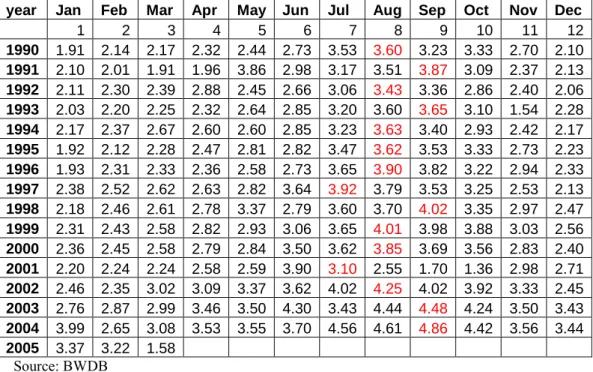
- Discharge and Water Level
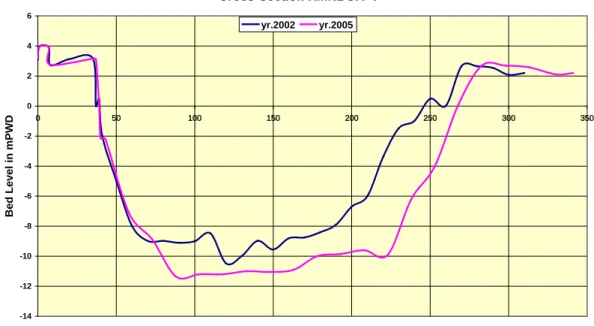
- Cross-Sectional Data
- River Bed Material
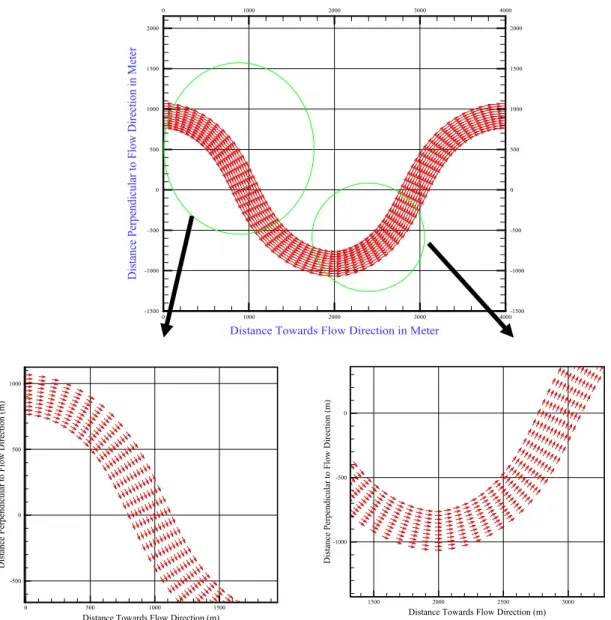
- Model Representation of the Study Reach
The cross-sectional data from 2002 and 2005 were compared and the erosion rate on the study reach was calculated (Figure). The average channel velocity, i.e. the centerline velocity of the channel for each time point, is calculated based on the load crossing a channel cross-section at that specific time point and the associated water level. The generated velocities at the grid points of Chander Char and Noagram Bend are shown in Figures 5.9 and 5.10 respectively.
The average shear stress in the centerline of the channel has been calculated by the equation 0.97wys (Chow, 1973). O n the other hand, the point shear stress at the Chander Char bend only crosses the allowable value near the top of the b end (Figure 5.14).
Socio-economic Analysis .1 Position in the Poverty Index
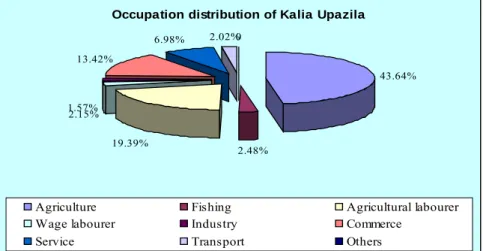
Present Occupational Status
The land control scenario in Kalia Thana which may also represent the study area is shown in Table 5.7 and Figure 5.18.
Analysis Based on Affected People’s Information
Furthermore, that land is under the control of the people who lived on that side of the river. During the rest of the year they earn their living by loading trollers with sand, collecting and selling water lilies and serving as day laborers. Most houses consist of one room and are made of hay and bamboo shoots.
Looking for opportunities to earn a living, most students after primary school do not go to secondary school. People in these locations are losing their land due to both bank erosion and dike retreat.
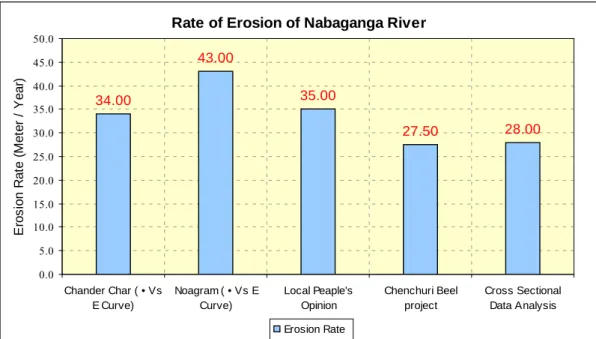
Bank Erosion Rate
Impact of Erosion on Livelihood of the Local People .1 Direct Economic Loss
- Access to Natural Capital
- Access to Human Capital
- Access to Social Capital
- Access to Political Capital
- Access to Physical Capital
- Access to Economic Capital
The average literacy rate of the area (31.9%) gives an idea of the people's poor access to education. They are poorly able to borrow money from households with better financial conditions for consumption and dowry. There is less practice among wealthier households to enter into long-term leases for common properties such as water bodies and wetlands.
In most of the houses of the affected people living on the dike, a house consists of one room, made of straw and bamboo. Since Kalia Upazilla is on the other side of the Nabaganga, they are dependent on water transport.
Discussion on Results
In real scenario, the sediments carried by backflow of water into the reach cause sedimentation and decrease the erosion rate. No discharge station is available within the study for each, as the model simulated discharge data from IWM was used for the analysis. The hydrological data collected for the model development was for the year 2005, but the image collected from the Internet is from the year 2008.
Smaller flow pattern size would give better result. The socio-economic survey and an analysis to determine the impact on the livelihoods of local people focused particularly on groups of landless farmers (partially or fully), who are directly affected by land loss and are now landless by moving to other places. some generative activities.
Conclusion
The natives, who are losing their lands, are being deprived of their livelihood security and are thus becoming poorer day by day. They are creating an access to all kinds of capital that they need to sustain their livelihood.
Recommendation
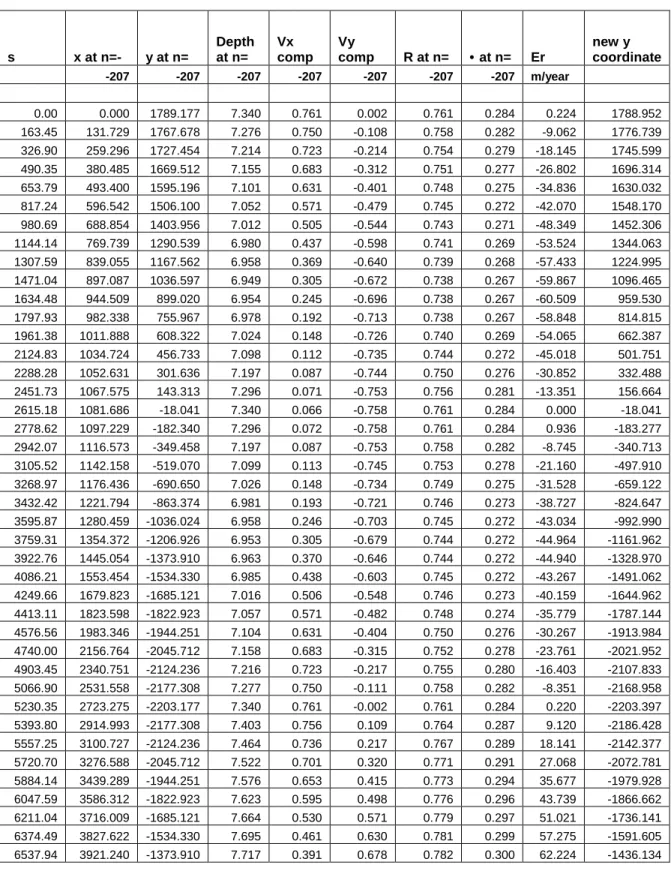
Local people can be motivated and made responsible for the maintenance of the reserves by the Ministry of Fisheries so that they will be the beneficiaries of the reserves. In this case, the s-coordinate is the distance along the centerline of the channel, defined as the curve where the depth is equal to the mean depth, while the coordinate, n, is perpendicular to the channel defined by the curvature relationship. The local depth y, i.e. the actual y at the (s,n) coordinates, is calculated with the equation.
The maximum traction force in the bottom of the trapezoidal channel is very close to wyS, and on the sides it is close to 0.76wyS (Chow, 1973). Thus, the average value of τ in the cross-section can be considered the average of the two, i.e. 0.88wyS.
Model Generated Data
For constant values of friction factor f, the tensile stress is proportional to the square of the velocity, so that.
Impact of River Erosion
Knowledge ability
Villagers’ Dealing Strategy with River Bank Erosion
General Comments and Opinion
Tentative Title: Investigating Bank Erosion and Its Impact on Local Livelihoods: A Case Study Along the Nabaganga River. Beneficiaries propose loop cutting of the Nabaganga to prevent erosion of the dam near N oagram instead of withdrawing the dam (BWDB, 1997). To study the effect of such erosion and channel shifting on the livelihood of the people living there.
Geographical location of the two highly erosive sites was determined using hand-held GPS. Thus, the impact of channel changes on the livelihood of the people will be assessed with the help of Social survey as well as available secondary data from the selected websites.