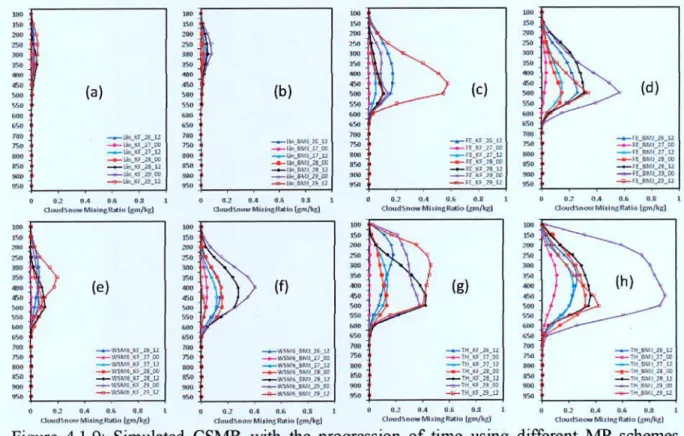
4.1 .9 Simulated CSMR with time progression using different MP 48 schemes coupled with KF and BMJ schemes of TC 'Mala' in region D5. 4.1 .11Simulated WVMR with time using different MP 52 schemes coupled with KF and BMJ schemes of TC 'Mala' in region D4.
Nomenclature
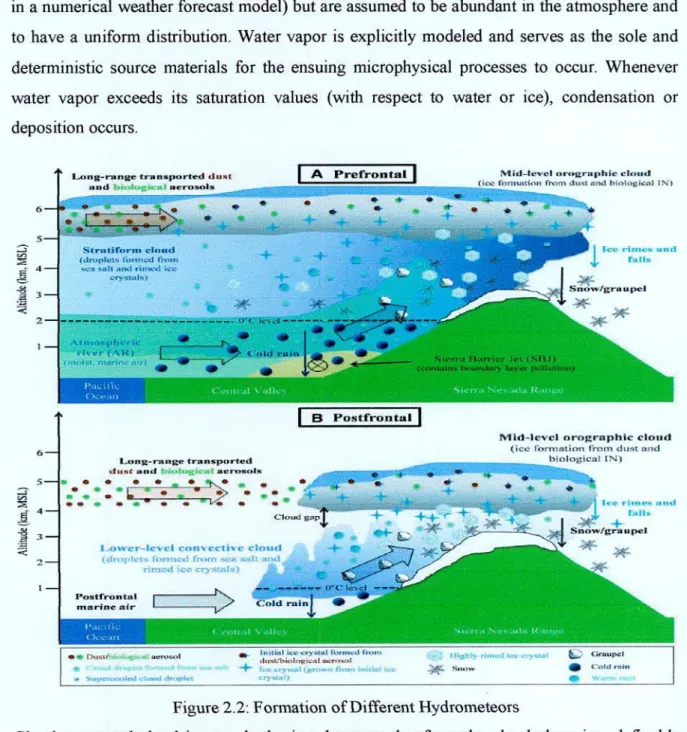
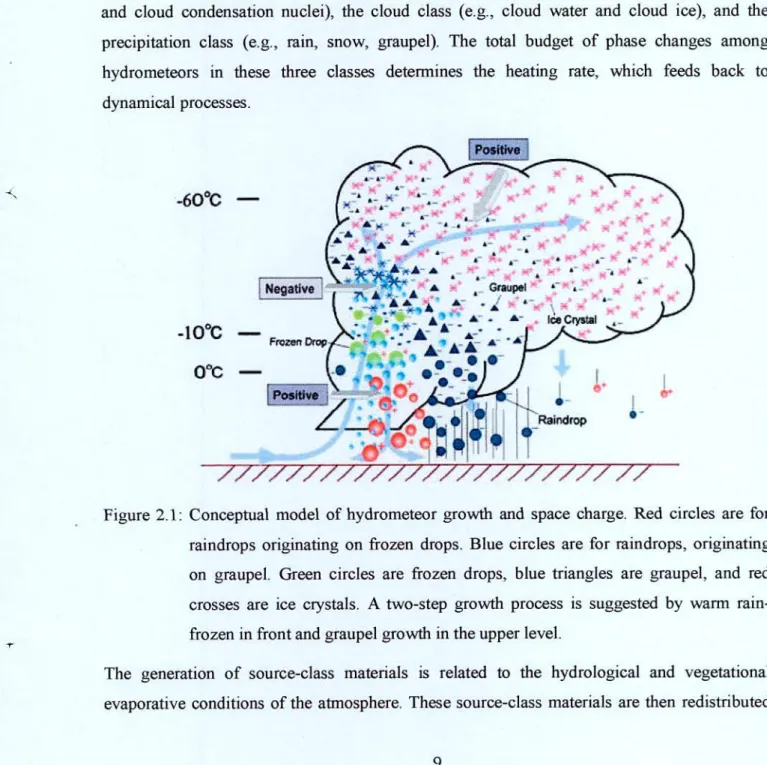
The hydrometeors are cloud water, rainwater, graupel, snow, ice and water vapor mixture. Water vapor mixing ratios have not changed significantly during the period of movement of tropical cyclones.
Introduction
Tropical Cyclone
In meteorology, a cyclone is an area of closed, circular fluid motion that rotates in the same direction as the Earth. Upper-level cyclones can exist without the presence of a surface low, and can squeeze off from the base of the tropical upper-tropospheric trough during the Northern Hemisphere summer months.
Classification of Tropical Cyclones
- Surface Pressure
This is usually characterized by inward spiral winds that rotate counterclockwise in the Northern Hemisphere and clockwise in the Earth's Southern Hemisphere. Unusual pressure drop over 24 hours of 2 - 3 hPa or more takes place in the center of the vortex concentration.
Hydrometeors
- Cloud Water Mixing Ratio
- Cloud Ice Mixing Ratio
- Cloud Graupel Mixing Ratio
- Cloud Water Vapor Mixing Ratio
- Relative Humidity
- Microphysics schemes in WRF-ARW Model
- Kessler Scheme
- Lin et aL Scheme
- WSM 3-class scheme
- Ferrier scheme
- WRF Single-moment 6-class (WSM6) microphysics scheme
- Thompson Scheme
- Kain-Fritsch (KF) scheme
- Planetary Boundary Layer (PBL) Parameterizations
- Yonsei University (YSU) scheme
Satellites can measure water vapor from the top of the atmosphere in the 6.7 mm water vapor absorption channel. The mixing ratio is the ratio between the mass of water vapor in the air and the mass of dry air.
Model Description
Model configuration
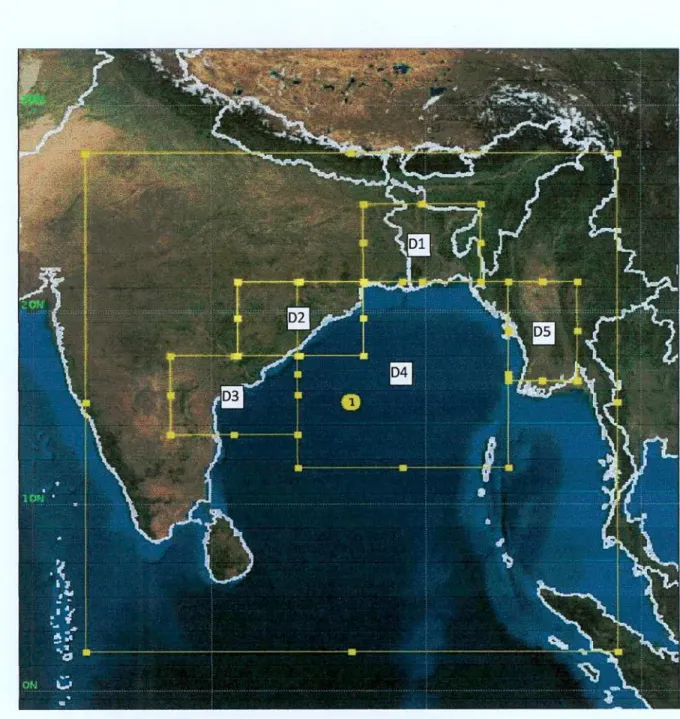
The model simulated MSLP, maximum wind at 10 m level, track, cloud water mixing ratio (CWMR), cloud ice mixing ratio (CIMR), cloud graupel mixing ratio (CGMR), cloud snow mixing ratio (CSMR), rainwater mixing ratio (RWMR), cloud vapor mixing ratio (CVTVIR), Relative Humidity (RI -I) and Vorticity were analyzed. We divided the model domain into different regions Dl in the northern side of BoB, D2 in the northwestern side of BoB, D3 in the western side of BoB, D4 in the Oceanic area and D5 in the northeastern side of BoB. In this research, the hydrometeors of TC Mala (2006), TC Sidr (2007) and TC Phailin (2013) were simulated using the WRF-ARW model and were discussed in the following subsections.
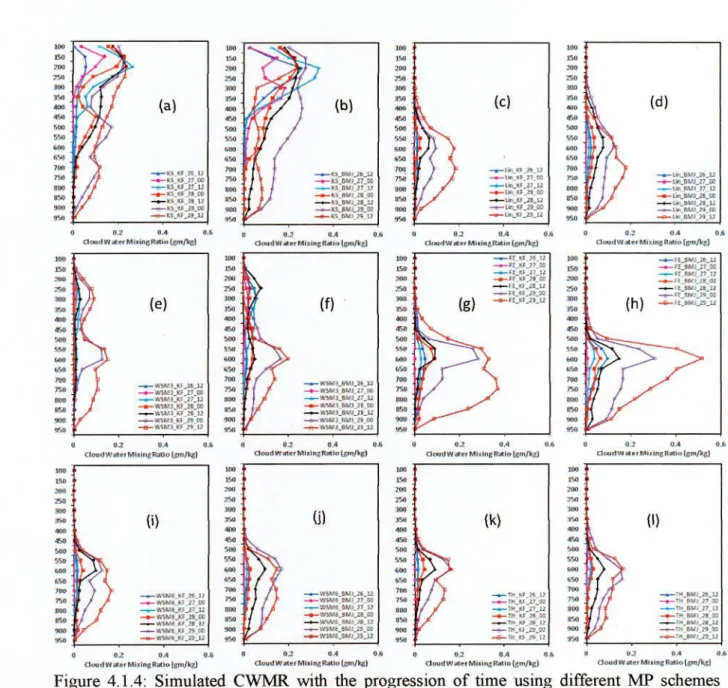
Cloud water mixing ratio, rainwater mixing ratio, ice mixing ratio, snow mixing ratio, graupel mixing ratio, water vapor mixing ratio, relative humidity, and vorticity simulated by six MPs coupling with two CPs are plotted and discussed. To examine the differences in the simulated track and intensity of tropical cyclones, spatial averages and time averages of vertical profiles of cloud water, rainwater, graupel, snow ice and water vapor mixing ratio (g/kg), relative humidity and vorticity were obtained. calculated once every three hours but plotted once every six hours for TCs Mala, TC Phailin and TC Sidr.
Tropical Cyclone Mala
- Synoptic situation of Tropical Cyclone Mala
- Intensity of TC Mala
- Track of TC Mala
- Cloud Water Mixing Ratio (CWMR)
- Cloud Rain Water Mixing Ratio (RWMR)
- Cloud Ice Mixing Ratio
- Cloud Snow Mixing Ratio
- Cloud Graupel Mixing Ratio
- Cloud Water Vapor Mixing Ratio
- Relative Humidity
The Kessler and WSM3 schemes coupled with the KF and BMJ schemes have simulated CWMR down to 100 hPa. The Kessler and WSM3 schemes coupled to the KF and BMJ schemes have simulated CWMIR down to 100 hPa. All other MPs joining the KF and BMJ schemes have simulated CWMR down to the 400 hPa level.
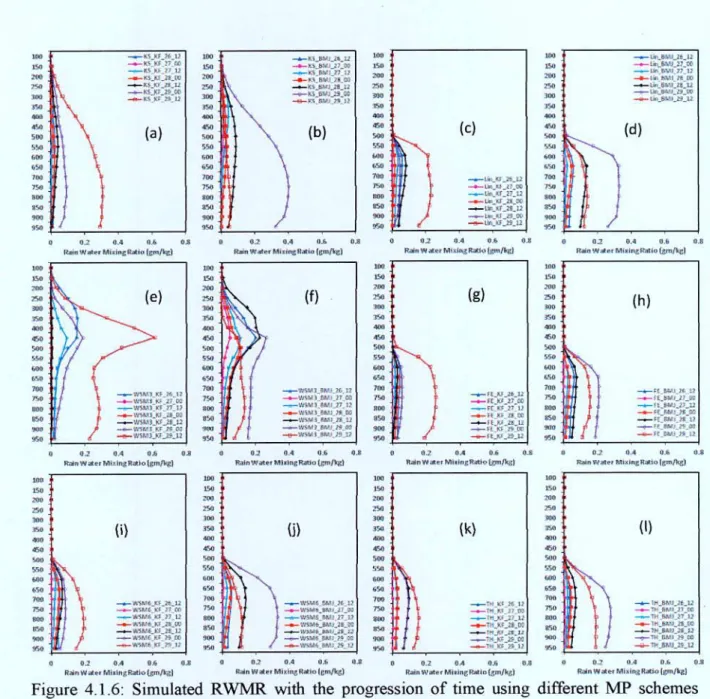
All other v1Ps associated with KF and BMJ schemes simulated RWMR up to a level of 500 hPa. The CSMR simulated schemes for Lin ci al., Ferrier, WSM6 and Thompson, linked to KF and BMJ schemes.
Tropical Cyclone Phailin
- Synoptic situation ofTropical Cyclone Phailin
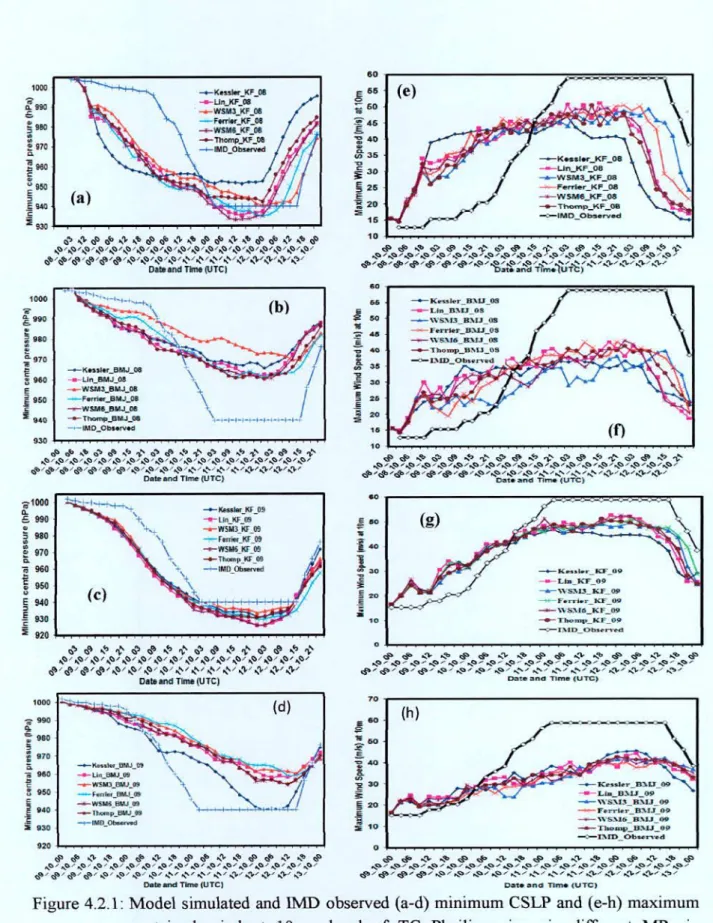
- Intensity of TC Phailin
- Track of TC Phailin
- Cloud Water Mixing Ratio
- Rain Water Mixing Ratio
- Cloud Ice Mixing Ratio
- Cloud Snow Mixing Ratio
The simulated track for all MP schemes associated with KF and BMJ schemes is found parallel to the observed track until 0000 UTC of October 12. Ferrier, WSM6 and Thompson schemes in combination with KF and BMJ schemes simulated CWIv1R up to 350 hPa. Kessler and WSM3 schemes, coupled with KF and BMJ schemes, simulated RWMR up to 150 hPa.
All other MPs associated with the KF and BMJ schemes simulated the RWMR down to the 450 hPa level. RWMR is reduced after 0000 UTC 12 October for all MPs connecting to the KF and BMJ schemes.
NNE,
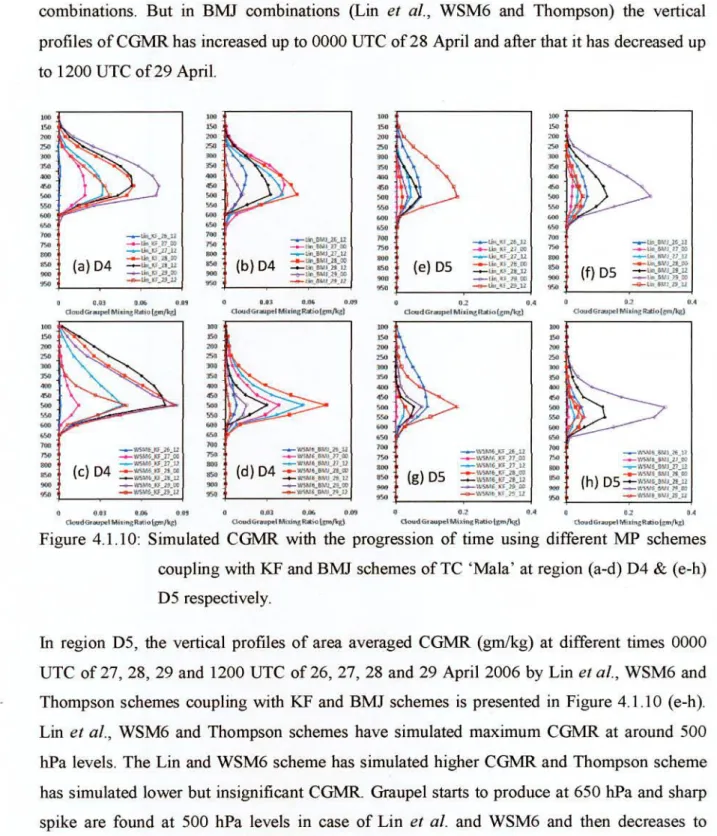
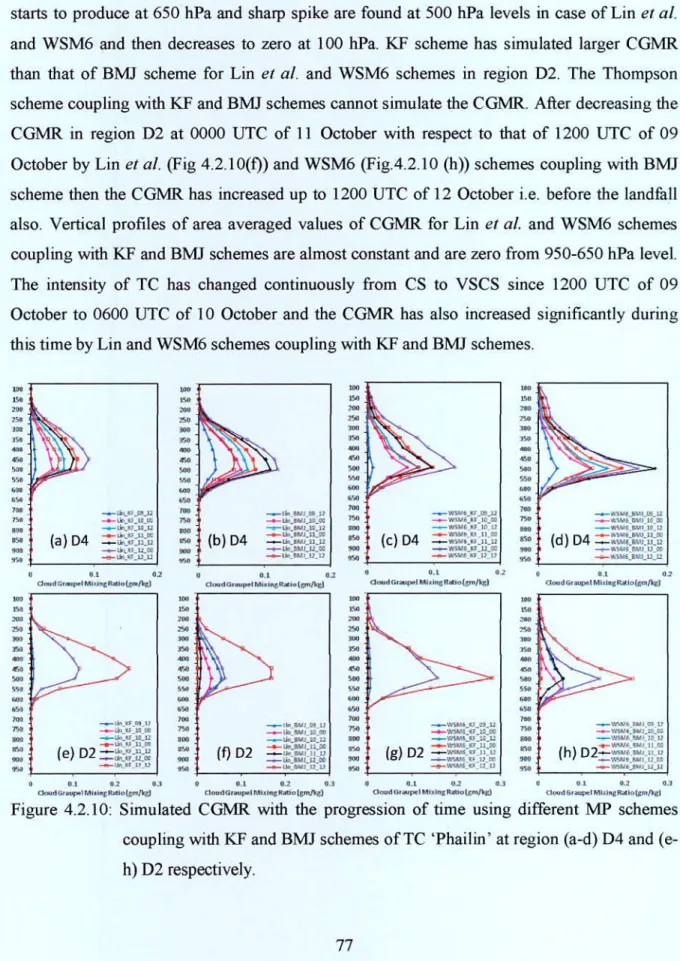
Cloud Giaupel Mixing Ratio
The TC intensity has continuously changed from CS to VSCS since 1200 UTC 9 October to 0600 UTC 10 October, and the CGMR has also increased significantly during this time as the simulated Lin and WSM6 schemes have merged with the KF and BMJ schemes. The cloud graupel profile patterns are similar to the upper level with the Lin and WSM6 schemes coupled with the KF and BMJ schemes. In the D4 region, the Thompson scheme coupled with the KF and BMJ schemes cannot simulate the CGMR.
The intensity of TC has been continuously changing from CS to VSCS since 1200 UTC of October 9 to 0600 UTC of October 10 and the CGMR has also increased significantly during this period by Lin and WSM6 schemes coupled with KF and BMJ schemes . The simulated CGMR was not significant for the Lin, WSM6, and Thompson schedules coupled to the KF schedule in regions DL D3 and D5.
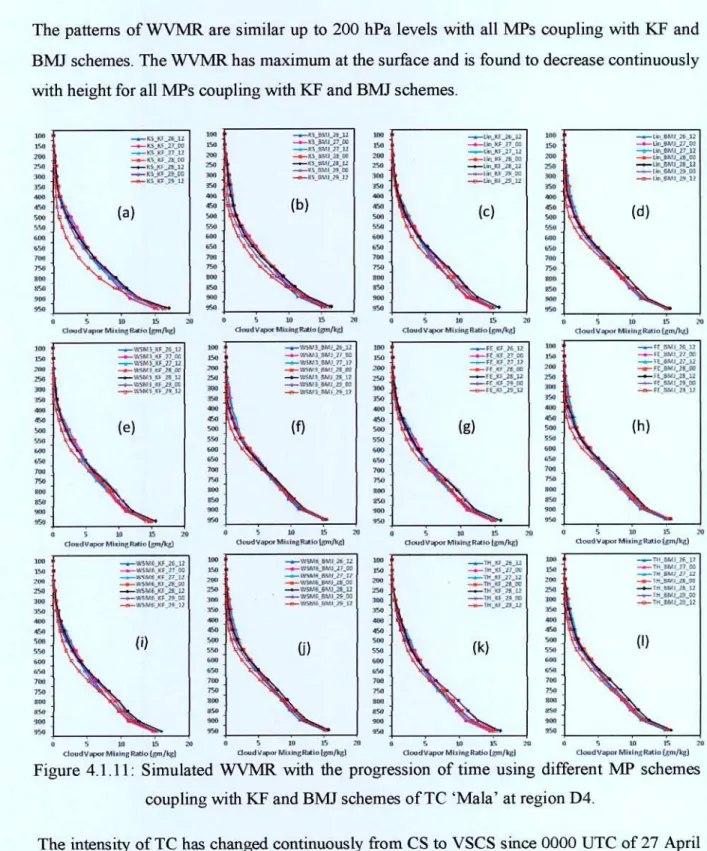
Water Vapor Mixing Ratio
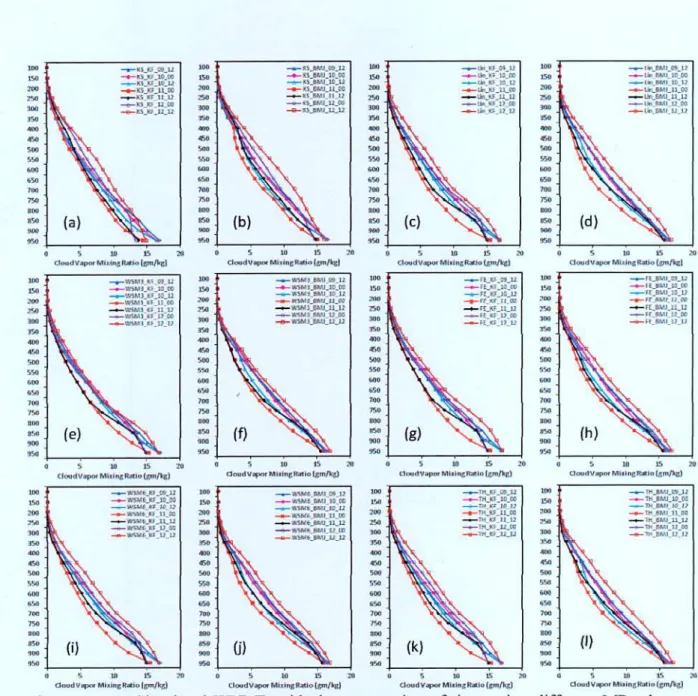
The WVMR is similar up to the 200 hPa level with all MPs associated with the KF and BMJ schemes. The simulated WVIvIR has a maximum value at the surface and decreases continuously with height for all MPs associated with the KF and BMJ schemes. The simulated WVMR is approximately the same for all MPs connecting to the KF and BMJ schemes.
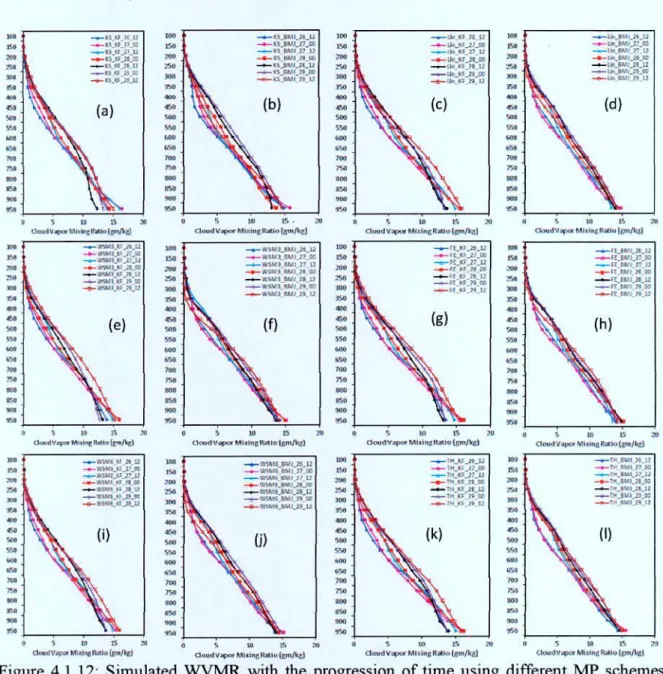
The WVMR is similar up to 250 hPa levels, with all MPs associated with KF and BMJ schemes in regions D1, D3 and D5. The simulated WVMR has a maximum at the surface (about 10 g/kg) and has continuously decreased with height for all MPs associated with KF and BMJ schemes.
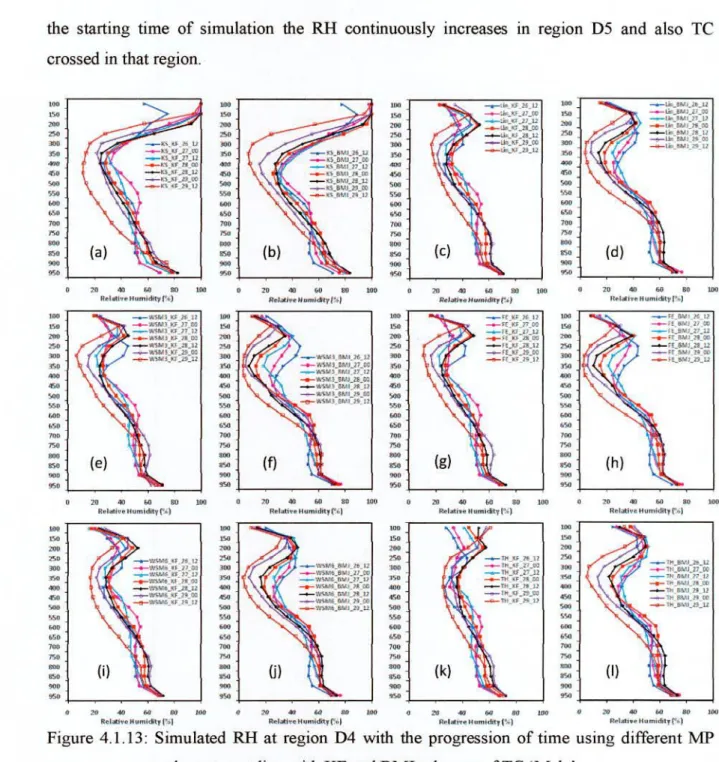
Relative Humidity
As time progresses, the TC moves towards the northwest direction and the WVrvIR has no significant changes (Figure not shown) in the Dl, D3 and D5 regions, so the cyclone has not moved in those directions. The simulated RH is maximum (above 80%) in the upper level (100 hPa) for coupling the Kessler scheme with the KF and BMJ schemes in the Dl, D3, and D5 regions, but is below 80% in the upper-middle troposphere for all MPs joining. with KF and BMJ schemes (Fig. not shown). In the D3 region, RH (%) is decreased relative to the initial model run time for six different MPs associated with the KF and BMJ schemes.
In the D5 region, relative humidity (%) increased until 1200 UTC 12 October 2013 at the surface to midlevel and decreased at the upper level for the six different IviPs associated with the KF and BMJ schemes with initial conditions at 0000 UTC on the day. In Dl, D3 and D5, the cyclone did not move and the RH also decreased in these directions.
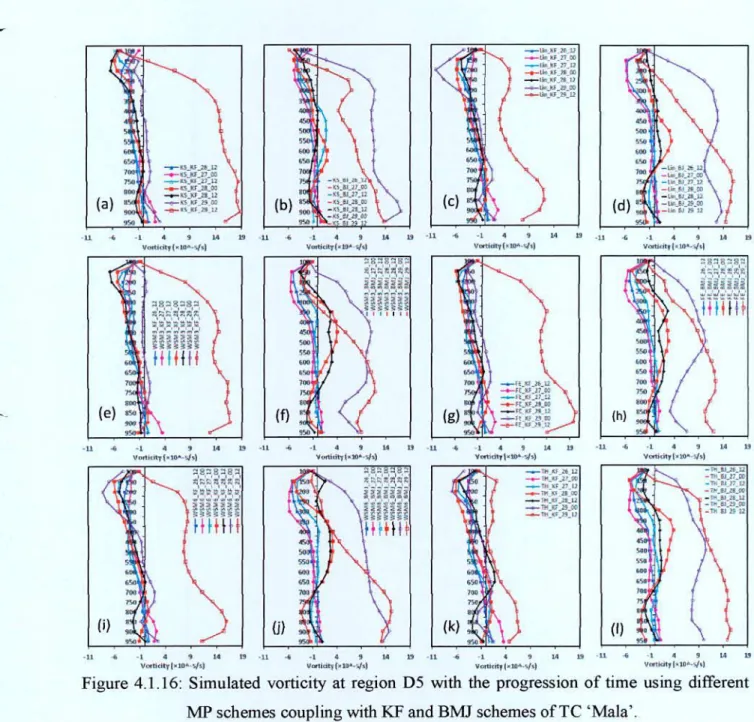
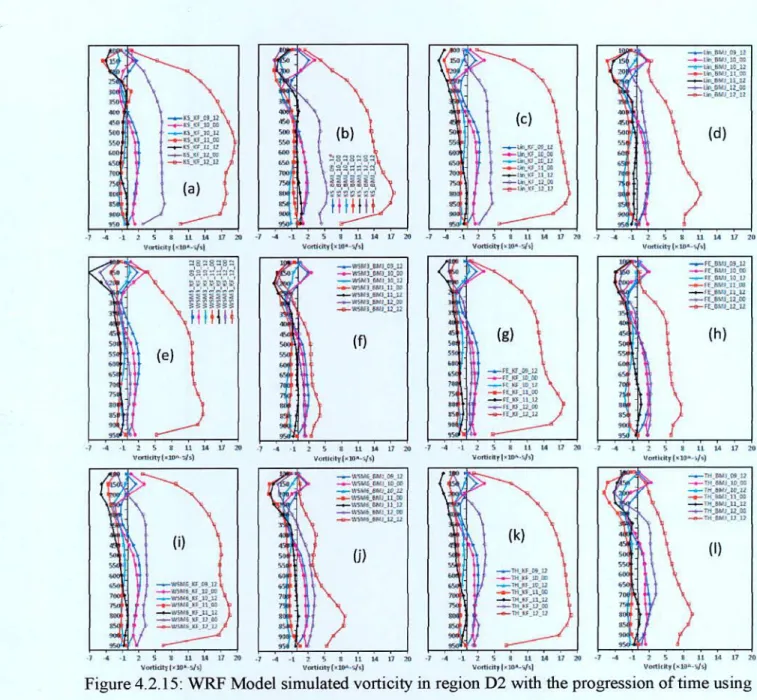
Vorticity
The simulated eddy current has been positive from surface to mid-troposphere and negative from mid-to-upper troposphere for all MPs coupling with KF and BMJ schemes in region D3 (figure not shown). The eddy current has increased at 0000 UTC 11 October to 1200 UTC 12 October in region D3 for all MPs connecting to KF and BMJ schemes. The simulated eddy current has been nearly negative for all MPs coupling with KF and BMJ schemes in region D5 (figure not shown).
All MPs associated with KF and BMJ schemes simulated a single peak of vorticity at approximately 400 hPa in region D5. As time progresses, the TC moves to area D2 and the vorticity in area D5 has continuously decreased.
Synoptic situation of Ti opical Cyclone Sidr
- Track of TC Sidr
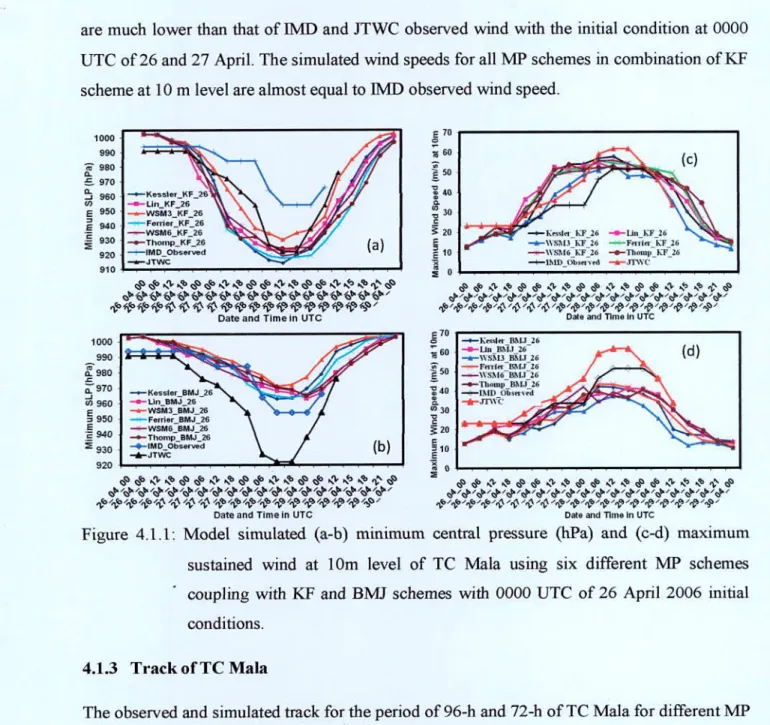
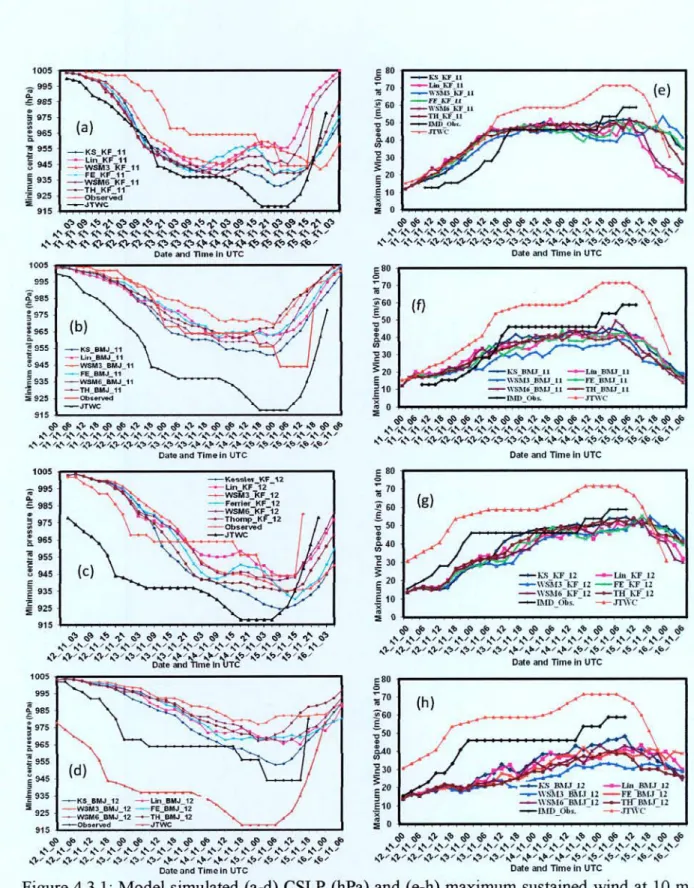
Simulated pressure drop with initial conditions at 0000 UTC 11–12 November Lin et al. The simulated MSLP for all other MP schemes combined with the KF scheme is between the observed ITv1D and JTWC results with 0000 UTC initial conditions on 11 and 12 November. Significant track deviations are observed between the different microphysical schemes combined with the CP scheme with 0000 UTC 11 and 12 November initial conditions.
There is no TC Sidr landing until the simulation time for the WSM3 scheme combined with the KF and BMJ schemes with initial conditions of 0000 UTC 11 and 12 November 2007. The CWMR simulated maximum at the 900–500 hPa level for the Lin, Ferrier, WSM6, and Thompson schemes combined with the KF and BMJ schemes.
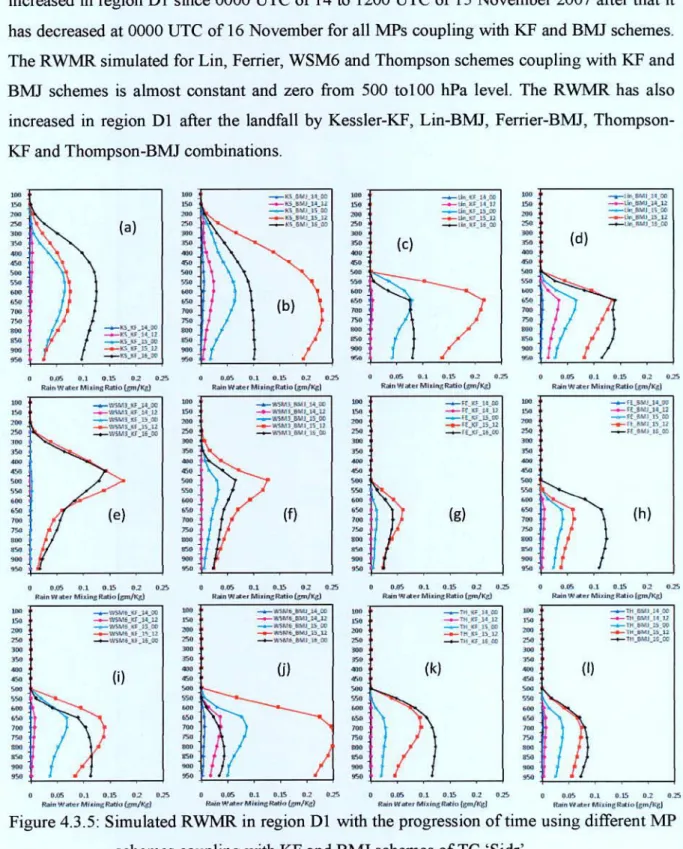
Rain Water Mixing Ratio
- Cloud Ice Mixing Ratio
- Cloud Snow Mixing Ratio
- Cloud Graupel Mixing Ratio
- Relative Humidity
- Vorticity
CIMiR falls after 12:00 UTC on 14 November using Lin, WSM6 and Thompson schemes coupled with KF and BMJ schemes. The WSM6 scheme has simulated higher C1MR than the Lin and Thompson scheme coupled to KF and BMJ schemes in regions D2, D3 and D5. In regions D2, D3 and D5, CGMR has simulated minimums for Lin, WSM6 and Thompson schemes coupled with KF and BMJ schemes.
The W\TMR is similar up to 200 hPa levels with all MP schemes coupled to KF and BMJ schemes. The simulated vorticity is negative from 300 to 100 hPa for all MPs connecting to KF and BMJ schemes.
Summary and Conclusions
The simulated areal average of RWMR has increased continuously before landfall in region D5 of TC Mala, D2 of TC Phailin, and Dl of TC Sidr for all MPs connecting with CPs. The average RWMR area is found minimum and decreased in areas where the cyclones did not cross. The simulated pattern of area-averaged CWMR is similar to the RWMR for all the cyclones.
The area mean WVMR is nearly constant for all cyclones in the Oceanic region and has increased in a region where all TCs have crossed. CLMR, CGMR and CSMR have increased in region D4 for TC Mala, Sidr and Phailin.
N., 2011: influence of humid processes on track and intensity forecast of cyclones over the North Indian Ocean. Adaptation of the WRF-ARW model with physical parameterization schemes for the simulation of tropical cyclones over the North Indian Ocean. C., 2008: A comparative study on the performance of MMS and WRF models in the simulation of tropical cyclones over the Indian Sea.
C., 2011: Sensitivity of physical parameters in forecasting Tropical Cyclone Nargis over the Bay of Bengal using the WRF model. Tropical cyclone forecasts over the Bay of Bengal using the Advanced Research and Forecasting Weather (ARW) high-resolution model.