YIELD LOSS ASSESSMENT OF MUSTARD FOR GREY BLIGHT DISEASE CAUSED BY Alternaria spp.
By
MD. GAZIUL HAQUE Reg. No. 10-04233
DEPARTMENT OF PLANT PATHOLOGY FACULTY OF AGRICULTURE
SHER-E-BANGLA AGRICULTURAL UNIVERSITY DHAKA -1207
December, 2012
YIELD LOSS ASSESSMENT OF MUSTARD FOR GREY BLIGHT DISEASE CAUSED BY Alternaria spp.
By
MD. GAZIUL HAQUE Reg. No. 10-04233
DEPARTMENT OF PLANT PATHOLOGY FACULTY OF AGRICULTURE
SHER-E-BANGLA AGRICULTURAL UNIVERSITY DHAKA -1207
December, 2012
YIELD LOSS ASSESSMENT OF MUSTARD FOR GREY BLIGHT DISEASE CAUSED BY Alternaria spp.
By
MD. GAZIUL HAQUE Reg. No. 10-04233
DEPARTMENT OF PLANT PATHOLOGY FACULTY OF AGRICULTURE
SHER-E-BANGLA AGRICULTURAL UNIVERSITY DHAKA -1207
December, 2012
YIELD LOSS ASSESSMENT OF MUSTARD FOR GREY BLIGHT DISEASE CAUSED BY Alternaria spp.
BY
MD. GAZIUL HAQUE REGISTRATION NO. 10-04233
A Thesis
Submitted to the Faculty of Agriculture, Sher-e-Bangla Agricultural University, Dhaka,
In partial fulfillment of the requirements For the degree of
MASTER OF SCIENCE IN
PLANT PATHOLOGY
SEMESTER: JULY-DECEMBER, 2012 Approved by:
Dr. Md. Rafiqul Islam Professor
Department of Plant Pathology Sher-e-Bangla Agricultural University
Supervisor
Nazneen Sultana Professor
Department of Plant Pathology Sher-e-Bangla Agricultural University
Co-supervisor
Nazneen Sultana Professor & Chairman Examination Committee Department of Plant Pathology Sher-e-Bangla Agricultural University
Dr. Md. Rafiqul Islam Professor
Department of Plant Pathology Sher-e Bangla Agricultural University
Dhaka-1207, Bangladesh Mob: +88 01554925573
Ref:- Date:…………..
CERTIFICATE
This is to certify that thesis entitled, “YIELD LOSS ASSESSMENT OF MUSTARD FOR GREY BLIGHT DISEASE CAUSED BY Alternaria spp.”
submitted to the Faculty of Agriculture, Sher-e-Bangla Agricultural University, Dhaka, in partial fulfillment of the requirements for the degree of MASTER OF SCIENCE IN PLANT PATHOLOGY, embodies the result of a piece of bona fide research work carried out by Md. Gaziul Haque, Registration No.
10-04233 under my supervision and guidance. No part of the thesis has been submitted for any other degree or diploma in any institute.
I further certify that such help or source of information, as has been availed of during the course of this investigation has duly been acknowledged.
..….………
Dated: (Dr. Md. Rafiqul Islam)
Place: Dhaka, Bangladesh
Supervisor Dr. Md. Rafiqul Islam
Professor
Department of Plant Pathology Sher-e Bangla Agricultural University
Dhaka-1207, Bangladesh Mob: +88 01554925573
Ref:- Date:…………..
CERTIFICATE
This is to certify that thesis entitled, “YIELD LOSS ASSESSMENT OF MUSTARD FOR GREY BLIGHT DISEASE CAUSED BY Alternaria spp.”
submitted to the Faculty of Agriculture, Sher-e-Bangla Agricultural University, Dhaka, in partial fulfillment of the requirements for the degree of MASTER OF SCIENCE IN PLANT PATHOLOGY, embodies the result of a piece of bona fide research work carried out by Md. Gaziul Haque, Registration No.
10-04233 under my supervision and guidance. No part of the thesis has been submitted for any other degree or diploma in any institute.
I further certify that such help or source of information, as has been availed of during the course of this investigation has duly been acknowledged.
..….………
Dated: (Dr. Md. Rafiqul Islam)
Place: Dhaka, Bangladesh
Supervisor
ACKNOWLEDGEMENT
All praises are due to the “Almighty Allah” who enabled the author to pursue higher education in Plant Pathology and to submit the thesis for the degree of Master of Science (M.S.) in Plant Pathology.
The author wishes to express his profound sense of appreciation and heartiest gratitude to his Supervisor, Dr. Md. Rafiqul Islam, Professor , Department of Plant Pathology, Sher-e-Bangla Agricultural University, Dhaka for his help, scholastic supervision, continuous encouragement and constructive suggestion throughout the period of research and for taking immense care in preparing this manuscript.
The author expresses his immense gratitude to his Co-supervisor, Nuzneen Sultana, Professor and Chairman, Department of Plant Pathology, Sher-e- Bangla Agricultural University, Dhaka for his valuable advice and constructive criticism during the critic period of research work.
The author is grateful to Dr. Shahidur Rashid Bhuiya, Professor, Department of Genetics and Plant Breeding and Pro-Vice Chanchellor, Sher- e-Bangla Agricultural University, Dhaka for providing necessary facilities and conducive atmosphere to accomplish this research work.
The author would like to extend his appreciation to all teachers and staffs, the Department of Plant Pathology, Sher-e-Bangla Agricultural University, Dhaka for their co-operation and encouragement during the study period.
The author feels proud to express his sincere appreciation and gratitude to all of his friends especially A. Matin Sarkar, Farida Yeasmin, Habibullah, Atik, Shammi, Prokash and younger brother Uttam, Torun, Saikot, Mizan for their help and encouragement.
The author can never repay the debt of his heavenly grandfather, grandmother and beloved parents, uncle, aunty, sisters, brothers and well wishers for their inspiration, constant encouragement and sacrifice for his higher education.
The author expresses his immense gratefulness to all of them who assisted and inspired him to purse higher education and regret for his inability for not to mention every one by name.
Dated: December, 2012 The Author Place: SAU, Dhaka
YIELD LOSS ASSESSMENT OF MUSTARD FOR GREY BLIGHT DISEASE CAUSED BY Alternaria spp.
By
MD. GAZIUL HAQUE
ABSTRACT
The experiment was conducted in the farm of Sher-e-Bangla Agricultural University and in the Seed Health Laboratory Department of Plant Pathology, Sher-e-Bangla Agricultural University, Dhaka-1207 during the period from November 2011 to July 2012. Multiple treatments viz. T1 (No field spraying), T2(One field spraying with Rovral 50 WP @ 0.2%), T3 (Two field spraying with Rovral 50 WP@ 0.2%), T4 (Three field spraying with Rovral 50 WP @ 0.2%), T5 (Four field spraying with Rovral 50 WP @ 0.2% ), T6 (Five field spraying with Rovral 50 WP @ 0.2% ), T7(Six field spraying with Rovral 50 WP @ 0.2% ), T8 (Seven field spraying with Rovral 50 WP @ 0.2% ), T9 (Eight field spraying with Rovral 50 WP @ 0.2%), T10 (Nine field spraying with Rovral 50 WP @ 0.2%) were exposed in the experiment, to make variation in the disease severity and respective yield of treated plot. Different treatments comprising different number of spraying had remarkable influence the disease severity of grey blight, yield and yield contributing characters of mustard. The lowest (0.0%) Percent Disease Index (PDI) and the highest yield (1882.50 kg/ha) was recorded in case of treatment T10where 9 spraying were done with Rovral 50 WP @ 0.2%. The highest PDI (80%) and the lowest yield (1266.55 kg/ha) was counted in case of treatment T1 (control). The disease severity (PDI) and yield were varied in case of other treatments on the basis of number of spraying. Using the varied disease severity (PDI) and corresponding, yield the mathematical yield loss assessment model was constructed as Y = 0.32 + 0.38Xi using the regression equation.
CONTENTS
SL NO. TITLE PAGES
ACKNOWLEDGEMENT i
ABSTRACT ii
CONTENTS iii
LIST OF TABLES vi
LIST OF PHOTOGRAPHS vii
LIST OF APPENDICES vii
1. INTRODUCTION 1
2. REVIEW OF LITERATURE 3
3. MATERIALS AND METHODS 8
3.1 Experimental site 8
3.2 Experimental period 8
3.3 Soil type 8
3.4 Weather 8
3.5 Variety 8
3.6 Treatments of the experiment 9
3.7 Experimental design and layout 9
3.8 Land Preparation 9
3.9 Application of manure and fertilizers 9
3.10 Intercultural operation 10
3.11 Preparation and application of spray solution 10
3.12 Tagging and data collection 11
3.13 Isolation and identification of pathologens from leaf 11
3.14 Harvesting of crops 11
3.14 Collection of data 11
3.15 Procedure of data collection 12
SL NO. TITLE PAGES
3.15.1 Percent leaf infection 12
3.15.2 Percent leaf area diseased 12
3.15.3 Percent pod infection 12
3.15.4 Percent pod area diseased 12
3.15.5 Number of leaves per plant 13
3.15.6 Number of branch per plant 13
3.15.7 Plant height 13
3.15.8 Number of pod per plant 13
3.15.9 1000-seed weight (g) 13
3.15.10 Yield (kg/ha) 13
3.15.11 Estimation of percent disease index (PDI) 13
3.16 Germination and seed health test 14
3.17 Statistically analysis 15
4. RESULTS 16
4.1. Percent leaf infection 16
4.2 Percent leaf area diseased 16
4.3 Percent pod infection 19
4.4 Percent pod area diseased 19
4.5.1 Number of leaf per plant 22
4.5.2 Number of branches per plant 22
4.5.3 Plant height 22
4.6.1 Number of pods per plant 22
4.6.2 1000-seeds weight 22
4.6.3 Yield kg/ha 22
SL NO. TITLE PAGES
4.7.1 Percent seed germination 25
4.7.2 Percent seed infection 26
4.8 Estimation of mathematical model for yield loss assessment
27
5. DISCUSSION 32
6. SUMMARY AND CONCLUSION 34
REFERENCES 36
APPENDICES 39
LIST OF TABLES
TABLE NO. TITLE PAGES
1 Details of Fungicide 10
2 Effect of different treatments on percent leaf infection of mustard at different days after sowing (DAS)
17
3 Effect of different treatments on percent leaf area diseased (%LAD) of mustard at different days after sowing (DAS)
18
4 Effect of different treatments on percent pod infection of mustard at different days after sowing (DAS)
20
5 Effect of different treatment on percent pod area diseased (%PAD) of mustard at different days after sowing (DAS)
21
6 Effect of different treatments on growth parameters of mustard.
23
7 Effect of different treatments on yield and yield contributing characters of mustard.
24
8 Predicted yield loss calculated by percent disease index (PDI) and corresponding yield loss from multiple treatment experiment.
27
LIST OF PHOTOGRAPHS
FIG. SL NO. TITLE PAGES
1 Effect of different treatments on percent seed germination of mustard.
25
2 Effect of different treatments on percent seed infection of mustard.
26 3 Mathematical model point for estimation of yield loss of
mustard due to grey blight disease caused by Alternaria brassiciae and Alternaria brassicicola.
29
4 Field view of flowering stage of mustard 30
5 Field view of fruiting stage of mustard 30
6 Infected (Grey blight diseases) leaves of mustard 31 7 Infected (Grey blight diseases) pods of mustard 31 8 Conidia of Alternaria spp. under stereo microscope at 50x
LIST OF APPENDICES APPENDICES
NO.
TITLE PAGES
I Experimental location on the map of agro-ecological zones of Bangladesh
39
II Monthly mean weather 40
III Layout of the field experiment 41
IV Some commonly used abbreviations and symbols 42
V ANOVA table of the experiment 44
VI Particulars of the Agro-ecological Zone of the Experimental site
50
CHAPTER 1 INTRODUCTION
There are many oil seed crops like mustard, sesame, groundnut, linseed, niger, safflower, sunflower and soybean which are being cultivated in Bangladesh.
Among these, mustard is considered as the major oil crop.
Mustard (Brassica spp.) is one of the major oil seed crops in Bangladesh which is widely cultivated during the winter season 5(October- February) and its contribution in total oil seed production is approximately 70%. The crop is well adapted to almost all agro-climatic zones of the country. Yield of mustard is very low in Bangladesh in comparison to other countries. About 598254 acres of land were used for mustard cultivation which produced 221928 metric tons of mustard. But the average mustard production was only 387kg /acre in the year 2009-2010 (BBS, 2010). Almost two-third of the edible oil consume annually in Bangladesh is imported and foreign exchange spent for the year 2004 about 690 millions US dolor (BBS, 2004). The per capita consume of edible oil in the country is 10-12gm/head/day. The seeds of Brassica spp.
contain 42% oil and 25% protein (Khaleque, 1985).
Mustard oil plays a vital role in human nutrition. It is also an important row material for industrial use such as; soaps, paints, varnish, hair oil, lubricants, etc. Mustard oil cake used as animal feeds also as manure. Many factors are associated with the poor yield of mustard in Bangladesh. Diseases have been identified as one of the major causes (Ahmed, 1992). Rapeseed mustard suffers from about 14 diseases (Fungi 9, Virus -2, Bacteria-1, Nematode-1, and parasitic plant-1) in Bangladesh. Among these diseases, leaf blight disease caused by Alternaria brassicae is widely distributed and the most serious and devastating disease of rapeseed mustard. The characteristic symptom is the development of circular spots on leaves and pods with concentric ring. Later on spots coalesce and ultimately affected leaf and pod become blighted. The disease may cause 25% yield reduction at severe condition of infection (Anonymous, 2001).
Grey blight (Alternaria brassicae) (Bark) Sace causes blight of leaf, pod and stem (Meah et al., 1988) and seed abnormalities (Howlider et al., 1991). It appears as endemic disease in Bangladesh and all the cultivated B. campestris and B. napus varities are suceptible to the disease. This disease causes an average yield loss of 40-70% in India and 30-60% in Bangladesh (Meah et al.,
1988). In addition to direct yield losses, the disease adversely affects the seed quality reducing seed size, seed discoloration and reduction in oil contents (Howlider et al., 1991; Kaushik et al., 1984). Seed cleaning before sowing has recently been proved effective in reducing infection of seed-borne pathogens and increasing production of healthy seeds (Hossain and Doullah, 1998)
The yield losses of mustard due to grey blight disease affect the market price of edible oil in the country. The market price closely depend on the local oilseed production. Thus, for the national import policy of edible oil in the country, simulation of crop loss assessment model is essential. But for such as important disease, the crop loss assessment model is not yet been construced. Thus, the present study was undertaken to estimate the yield losses of grey blight of mustard caused by Alternaria spp
Objectives:
1. To calculate the disease severity in the critical disease stage.
2. To calculate yield loss of mustard for grey blight disease caused by Alternaria spp.
3. To develop a mathematical model for yield loss of mustard due to grey blight disease.
CHAPTER 2
REVIEW OF LITERATURE
Gray blight disease of mustard caused by Alternaria spp. is a common and most important disease in our country. This disease causes serious yield loss of the crop. Researchers all over the world have carried out intensive investigation on the gray blight of mustard. Literature in relation to management, severity and yield loss assessment of gray blight of mustard is reviewed and presented below.
Akhter et al. (2012) reported that, eight mustard varieties (SAU-1, BINA-6, TORI-7, BARI-9, BARI-6, SOFOL, AGRANI and SS-75) were evaluated for their reaction against Alternaria blight (Alternaria brassicae) under natural condition at the experimental field of Sher-e-Bangla Agricultural University, Dhaka during winter season from November 2007 to February 2008. At 60 days after sowing (DAS) disease severity did not exceed 5% and no symptoms were observed in the siliqua. Results revealed that, among the varieties the lowest disease severity was observed in Agrani in all stages of plant growth.
Maximum disease severity (97.17%) was found in SAU Sarishsa 1 giving lowest yield (1266.55kg/ha).
Kumar (2008) conducetd field resistance/partial resistance to Alternaria blight (Alternaria brassicae) was assessed in nine genotypes of Indian mustard under field conditions. Three genotypes viz. PR 8988, PR 9024 and Kranti exhibited partial resistance and had lowest severity. The yield potential of the genotypes was negatively correlated with the disease severity.
Alam (2007) evaluated the efficacy of some selected fungicides and plant extracts against Alternaria brassicae and Alternaria brassicicola causing grey blight of mustard (var. SAU Sarisha-1, Brassica campestris). Experiments were conducted at the Farm of Sher-e-Bangla Agricultural University, Dhaka and in the laboratory of Regional Agricultural Research Station, Bangladesh Agricultural Research Institute, Rahmatpur, Barishal during rabi season during the month of November, 2006 to February, 2007. Four fungicides viz. Rovral 50 WP (0.2%), Dithane M-45 (0.3%), Ridomil 68 WP (0.2%), Bavistin DF (00.15 and two plant extracts viz. Garlic clove extract, Allamanda leaf extract were employed in the experiment. Among the fungicides and plant extracts tested, Rovral WP (0.2%) showed the best performance in reducing disease incidence and disease severity as well as increasing seed yield against gray
blight of mustard. Seed infection by Alternaria spp. was reduced by 64.90%
and seed yield was increased by 48.19% over control by the application of Rovral 50 WP.
Singh et al. (2006) reported that, six seed dressing fungicides, i.e. Metalaxyl, Carbendazrm, Mancozeb, Thiophanate-methyl, Iprodione and BAS 38601 F (a seed dressing fungicide containing 40% Carbendazim + 32% Mancozeb), in combination with spray of Mancozeb (0.25%) were tested for the control of foliar diseases, Alternaria leaf spot (Alternaria brassicae) and white rust (Albugo candida) of Indian mustard. All the seed treatments improved germination and reduced disease intensity. Seed treatment with Mancozeb and spray of same fungicide was most effective against Alternaria leaf spot controlling up to 58.8 to 74.7 % disease. The highest yield was recorded with Iprodione (16.0-17.36 q/ha) and Mancozeb (26.0-31.12 q/ha).
Shrestha et al. (2005) reported that mancozeb and iprodione had effectively reduced grey blight disease in the sprayed plots and increased seed yield by 48% and 130%, respectively. The correlation between disease severity and yield, and yield components was negative and highly significant. Average yield loss was estimated to be in the range of 32 to 57%. Seed infection was also significantly higher in non sprayed treatment than sprayed one. The disease showed a negative effect on oil content causing losses on oil between 4.2 to 4.5%.
Mukherjee et al. (2003) studied the efficiency of iprodione against Alternaria blight (Alternaria brassicae) infecting Indian mustard cv. Pusa Bold in New Delhi, India, during 1998-2000. Iprodione was sprayed to plants at 500 g a.i.
/ha during the early pod stage. Iprodione was more effective than mancozeb (control) in the reduction of Alternaria blight incidence. The increase in Indian mustard yield in iprodione-treated plots was higher by 24-59% than that in the control plots.
Chattopadhyay and Bhunia (2003) studied with seven fungicides viz;
mancozeb 0.2%, captan 0.2% metalaxyl M.Z 0.25%. iprodione 0.2%, bayletan 0.05% (triadimefon), copper oxychloride 0.3% and antracol 0.2% (propineb) aganist Alternaria leaf blight of rapseed-mustard (Brassica campestris cv.
Yellow Sarson) caused by Alternaria brassicae. Best control of the disease was observed by iprodione followed by mancozeb. Higher seed yield and significant increase of 1000-seed weight were also recorded from single spray of iprodione followed by mancozeb. Highest seed yield and significant increase
of 1000-seed weight were also recorded from single spray of iprodione at post flowering stage. But maximum economic return was obtained from two spraying of mancozeb at 45 DAS and 60 DAS.
Ferdous et al. (2002) conducted an experiment to investigate the effect of three plant extracts and one fungicide on the incidence of Alternaria blight (caused by Alternaria brassicae) of mustard (Brassica sp.) cv. Sonali Sarisha under neutral field conditions in Gopalgonj, Bihar, India, during 1997-98. Young leaves of neem (Azadirachta indica), mustard (Brassica sp.) cv. Sambal (30-35 days old) and garlic cloves were macerated in tap water and 1% spray solution was prepared using the crude extracts. The fungicide Rovral (iprodione) at 0.1% was also used. All the 4 treatments were used at 1 litre/10m2areas. Two sprays at flowering (35-45 days) and fruiting (45-55 days) were given at 7 days interval. The fungicide treatment was the best in reducing Alternaria blight intensity and in increasing yield. Among the non- fungicidal treatments, the spray of garlic and neem leaf crude extracts proved promising. Spray of these 2 extracts at flowering stage suppresed disease incidence and increased yield.
Singh and Singh (2002) investigated on timely sown (15-20 october) of mustard crops during 1995/96-2001-02 revealed Alternaria blight (AB- Alternaria brassicae), white rust (WR-Alugo candida), downy mildew (DM- Peronospora parasitica) were the major mustard diseases in mid eastern India and together caused 44.06% avoidable yield loss. In trails conducted in the same field during 2001-02 and 2002-03 crop seasons, 3 spray of Iprodione 50 WP (Rovral @ 0.20%). Follwed by mancozeb 75 WP (Indofil M 45 @ 0.2%) and propineb 70 WP (Antracol @ 0.2%) gave the most effective AB control and yield gain. Significantly superior WR control was obtained by 2 sprays of metalaxyl+ mancozeb 72 WP (Ridomil MZ @ 0.25%) followed by 3 sprays of captan 50 WP (Captaf @ 0.20%).
Godika et al. (2001) conducted a fiefd experiment from 1994/95 to 1996/97 in Rajasthan, India to evaluate the efficacy of different fungicides, named Mancozeb, Ridomil MZ, (mancozeb+metalaxyl), Captan, Rovral (iprodione), Bayletan (tridimefon), and copper oxycloride, against Alternaria blight (Alternaria brassicae) and white rust (Albugo candida) of Indian mustard. All the fungicides significantly controlled both diseases, but their efficacy varied.
Rovral was the most effective in controlling of Alternaria blight; mean disease intensity in leaf and pod was 8.75 and 5.6%, respectively. On the other hand, Ridomil MZ was the most effective in controlling white rust; mean disease intensity in leaves and staghead were 8.5 and o.5 %, respectively. Yield was
highest with Rovral (2.1 t/ha), followed by Mancozeb and Ridomil MZ, each recording a yield of 1.9 t/ha.
A field experiment was conducted at Joydebpur and Jessore during Rabi 1996- 97 season. The treatment T6 was modified at Jessore with an additional spray i.e. Rovral 50 WP (0.2%) was sprayed once at disease initiation stage. Control plots were sprayed with plain water. Results showed that, leaf blight incidence were the lowest in the plot sprayed at pod formation and seed formation stage in both the locations. The highest seed yield was also recorded from the same treatment in both locations (Anonymous, 1997).
An experiment was conducted at BARI, Joydebpur; RARS, Ishurdi and RARS, Jessore during the Rabi season of 1991-92 using mustard variety Tori-7. Rovral 50 WP @ 0.2% was sprayed at an interval of 10 days starting from initiation of leaf blight disease. It was observed from the field test that, the increases in number of Rovral spray had significant effect in reduction of Alternaria leaf blight disease and increases in seed yield and 1000 grain weight. The disease reduction was observed from 37.5 to 74.3% over control at the three locations for three times sprayed that influenced the increaase in yield from 40.5 to 60.3%. But the maximum yield increase 62.8% observed in case of four time spray at Joydebpur. The 1000 grain weight was also increased 21.9 to 44.9 % over control at three times spray and maximum increase of 1000 grain weight (47.8%) was found in four times spray at Ishurdi ( Anonymous, 1992).
An experiment with cv. SS-75(HYV) was conducted at ORC, BARI, Joydebpur. Seed health test was carried out after harvest of the crops at the laboratory to evaluate the seed-borne infection using standard blotter method.
Seed germination on the top of the blotter was also recorded and expressed in percentage. In the laboratory test it was observed that the Rovral spray reduced the seed-borne pathogen infection and incresed the germination percentage of mustard seeds. Seed-borne Alternaria spp. Infection was reduced above 90%
and germination increase was above 9% over the control. Seed infection was reduced up to 18.8% with three times Rovral spray (Anonymous, 1992).
Meah et al., (1992) observed the effects of frequencies, doses and time of application and their combination in controlling Alternaria blight of mustard in two consecutive cropping seasons under natural conditions. They found Rovral (1.0 Litre/ha) significantly reduced disease severities and incresed seed yield by 147% over control when applied two times commencing from fruiting stage(50 days age) at 10 days intervals.
Humpherson and Maude (1983) suggested three sprays of Rovral at 0.5-10.0 kg/ha applied in Brassica oleracea seed crops at three-week intervals from the young green siliqua stage to control pod infection caused by A. brassicicola.
Their findings demonstrated that seed yield was increased and spray improved the seed germination. They reported that Bordeaux mixture was also as effective as Rovral when disease levels were low but inffective when infection pressure was severe.
CHAPTER 3
MATERIALS AND METHODS
The details of the materials and methods of this research work were described in this chapter. The experimental materials, site, climate and weather, land preparation, experimental design, layout, data collection on disease incidence and severity, growth parameters, yield and yield contributing characters etc. are discussed under the following headings and sub-headings:
3.1 Experimental sites
The experiment was conducted in the farm of Sher-e-Bangla Agricultural University, Dhaka. The location of the site was 23o74 N latitude and 90o 35 longitude with an elevation of 8.2 meter from sea level.
3.2 Experimental period
The experiment was carried out during the Rabi season from November 2011 to February 2012. Seeds of mustard were sown on 1stNovember 2011 and were harvested on 2ndFebruary 2012.
3.3 Soil type
The experimental site was situated in the subtropical zone. The soil of the experimental site lies in agro-ecological regions of “Madhupur Tract” (AEZ No. 28). Its top soil is clay loam in texture and olive gray with common fine to medium distinct dark yellowish brown mottles. The pH 4.47 to 5.63 and organic carbon contents is 0.82 (Appendix I).
3.4 Weather
The monthly mean of daily maximum, minimum and average temperature, relative humidity, monthly total rainfall and sunshine hours received at the experimental site during the period of the study have been collected from Bangladesh Meteorological Department, Agargaon, Dhaka (Appendix II)
3.5 Variety
The mustard (Brassica campestries) variety SAU Sharisha 3 released from Sher-e- Bangla Agricultural University was used for the experiment. Seed was collected from Department of Genetics and Plant Breeding, Sher-e- Bangla Agricultural University, Dhaka.
3.6 Treatments of the experiment
Multiple treatments were applied in the experiment. Altogether 10 tretments were applied comprising different number of sprays as follows:
T1= No field spraying
T2= One field spraying with Rovral 50 WP @ 0.2%
T3= Two field spraying with Rovral 50 WP @ 0.2%
T4= Three field spraying with Rovral 50 WP @ 0.2%
T5= Four field spraying with Rovral 50 WP @ 0.2%
T6= Five field spraying with Rovral 50 WP @ 0.2%
T7= Six field spraying with Rovral 50 WP @ 0.2%
T8= Seven field spraying with Rovral 50 WP @ 0.2%
T9= Eight field spraying with Rovral 50 WP @ 0.2%
T10= Nine field spraying with Rovral 50 WP @ 0.2%
3.7 Experimental design and layout
Field layout was done after final land preparation. The experiment was laid out in Randomized Complete Block Design (RCBD) with four replications. The whole plot was divided into four blocks each containing ten (10) plots of 3m x 2m size, giving 40 unit plots. The space was kept 1.5 m between the blocks and 1m between the plots , 30 cm from row to row and 10 cm from plant to plant where maintained. Seeds were sown in lines in the experimental plots. The seeds were placed at about 1.5 cm depth in the soil. (Appendix III)
3.8 Land Preparation
The experimental field was thoroughly ploughed and cross ploughed and cleaned prior to seed sowing and application of fertilizers and manure was done in the field. The experimental field was prepared by thorough ploughing followed by laddering to have a good tilth. Finally the land was properly leveled before seed sowing. Finally plots were prepared as per the design.
3. 9 Application of manure and fertilizers
Manure and fertilizers were applied as per standard recommendation. The following doses were used for carrying out the field study (Anonymous, 2001)
Manure and fertilizers Rate/ha
Cow dung 10000 kg
Urea 250 kg
TSP 170 kg
MP 85 kg
Gypsum 150 kg
Zinc oxide 5 kg
Boric acid 10 kg
Urea was applied by two installments. Half of Urea, full dose of TSP, MP, Gypsum, Zinc oxide, Boric acid and Cow dung were applied at the time of final land preparation as a basal dose. Remaining half of Urea was applied at the time of flower initiation.
3.10 Intercultural operation
Intercultural operations, such as weeding, thinning, irrigation, pest management, etc. were done uniformly in the plots. One post sowing irrigation was given by sprinkler after sowing of seeds to bring proper moisture condition of the soil to ensure uniform germination of the seeds. A good drainage system was maintained for immediate release of rainwater from the experimental plot during the growing period. The first weeding was done at 15 days after sowing.
During the same time, thinning was done for maintaining a proper distance.
Second weeding was done after 35 days after sowing. The crop was protected from the attack of aphids by spraying Ektara @ 2 ml/litre of water. The insecticide was applied for the first time 15 days after sowing and it was applied with a regular interval. The insecticides were applied in the evening and not spray in same days of fungicide spray.
3.11 Preparation and application of spray solution
The fungicidal suspension was prepared by mixing with required amount of fungicide (Rovral 50 WP @ 0.2%) with tap water. 20 g Rovral 50 WP was mixed in 10 L water for preparing 0.2% spray solution. Total numbers of sprays were nine. The first spray was done at 7 days after sowing and others were sprayed with 7 days interval. The last spray was done at 63 days after sowing. Every time the fungicide was freshly prepared prior to application and the spray tank was thoroughly cleaned before filling with new materials. The insecticides were applied in the evening and not spray in same days of insecticide spray. Special attention was given to complete coverage of the growing plants with the fungicides. Adequate precaution was taken to avoid drifting of spray materials from one plot to neighboring ones.
Table 1: Details of Fungicide Common
name
Chemical name Active
ingredients
Doses used Rovral 50
WP
3- (3, 5 dichlorophenyl)- N- (methylethyl)-2,4
dioxoimidazolidene
carboxamide(C3H13)3N3Cl2
Iprodione (50%)
0.2% of the commercial formulation
3.12 Tagging and data collection
Randomly ten plants were selected from each plot and tagged for data collection and mean values were determined to get rating score of each treatment.
3.13 Isolation and identification of pathogens from leaf
From experimental plot, diseased leaves were collected and cut into pieces (4 diameter) and surface sterilized with HgCl2(1:1000) for 30 seconds. Then the cut pieces were washed in sterile water thrice and then blot dry and placed into acidified PDA media in petridish. The plates containing leaf pieces were placed at room temperature for seven days for incubation. When the fungus grew well and sporulated, then the slide was prepared from the pure culture and was identified under microscope with the help of relevant literature.
3.14 Harvesting of crop
When 80% of the plants showed symptoms of maturity i.e. straw coloured leave, stem, siliquae was noticed the crop was harvested as seed yield taken. At maturity, ten plants were harvested by uprooting and then they were tagged properly. Data were recorded on different parameters from these harvested plants.
3.15 Collection of data
The following parameters were considered for data collection.
Disease incidence and severity a. Percent leaf infection
b. Percent leaf area diseased (% LAD) c. Percent pod infection
d. Percent pod area diseased (% PAD) Growth parameters
a. Number of leaf/plant b. Number of branches/plant c. Plant height (cm)
Yield and yield contributing characters a. Number of pods/plant
b. 1000-seed weight (g) c. Yield (kg/ha)
Harvested seed
a. Percent seed germination b. Percent seed infection
3.16 Procedure of data collection 3.16.1 Percent leaf infection
Ten plants per plot were selected and tagged for collection of data. Data on percent leaf infection were recorded at 65, 75 and 85 days after sowing by visual observation of symptoms. Percent leaf infection was calculated by the following formula.
Number of infected leaf
% leaf infection =————————————— x 100 Number of total inspected leaf
3.16.2 Percent leaf area diseased
Data on percent leaf area diseased (LAD) were recorded at 65, 75, and 85 days after sowing by visual observation of symptoms. Percent leaf area diseased was calculated by the following formula.
Infected leaf area
% leaf area diseased =————————————— x 100 Total leaf area
3.16.3 Percent pod infection
Data on percent pod infection were recorded at 70, 80 and 90 days after sowing by visual observation of symptoms. Percent pod infection was calculated by the following formula.
Number of infected pod
% pod infection =————————————— x 100 Number of total inspected pod
3.16.4 Percent pod area diseased
Data on percent pod area diseased were recorded at 70, 80, and 90 days after sowing by visual observation of symptoms. Percent pod area diseased was calculated by the following formula.
Infected pod area
% Pod area diseased = ————————————— x 100 Total pod area infested
3.16.5 Number of leaves per plant
Number of leaves per plant data was also recorded at before and after flowering from the randomly selected 10 (ten) plants of each plot.
3.16.6 Number of branch per plant
Number of branch per plant data was also recorded at before and after flowering from the randomly selected ten (10) plants of each plot.
3.16.7 Plant height
Plant height was measured in centimeter by a meter scale at vegetative and reproductive stage and their average data was recorded per replication. Data were also recorded as the average of randomly selected ten (10) plants from each plot. For plant height the ground surface to the top of the main shoot and the mean height were expressed in cm.
3.16.8 Number of pod per plant
Number of pod per plant data was recorded as the average of randomly selected ten (10) plants from each plot.
3.16.9 1000 seed weight (g)
One thousand grains were randomly counted and selected from the stock seed and weighed in gram by digital electric balance. It was expressed as 1000-seed weight in gram (g).
3.16.10 Yield (kg/ha)
Seed yield were recorded from each plot. After harvesting the plot was sun- dried and threshed. Seed were properly sun-dried and their weights recorded.
Seed yield was then converted to kg/ha.
3.16.11 Estimation of percent disease index (PDI)
Percent disease index is the measurement of the amount of a disease in a population. It is also named as percent disease index (PDI) and measured by the following formula-
Sum of total disease ratting
Percent disease index (PDI) =————————————— x 100
Total no. of observation X Maximum grade in the scale
Disease severity scale:
Disease severity was calculated by using “0-5” scale (Harsfall and Barnet, 1945), is given bellow-
% Leaf Area Diseased (LAD)
Grade No. of
observation
Disease rating
(No. of observation X Grade)
0 0
0.1-5 1
5.1-12 2
12.1-25 3
25.1-50 4
>50 5
Total Total No. of
observation =
Total sum of disease ratting =
Regression equation:
For simulation of mathematical point model for estimation of yield loss, regression equation was used as bellow
Y= Y + b (Xi- X) (working formula) Here, Y = Predicted yield loss (%)
Y = Estimated yield loss (%)
Xi= Disease severity (i = 1, 2, 3,………n) b = Regression value
X = ∑ (n= No. of observation) Y = ∑ (n= No. of observation)
=∑∑( ∑ ∑)
3.17 Germination and seed health test
For germination and seed health testing 400 seeds randomly drawn from each sample were tested in the standard technique (ISTA, 2000). Seeds were placed on three layers of moist blotting paper (Whatman no. 1) contained in petridishes. In each petridish, 25 seeds were placed in equidistace. All the plates with seeds were incubated at room tempareture (25± 20C) under 12 hours cycle of alternate Near Ultra Violet (NUV) light and darkness. Watering was done as and when required. Germination of seedling and seed infection by
Alternaria spp. were recorded. Results were expressed as percent seed germination. After 7-10 days of incubation, each seed was observed under sterio-binocular microscope to detect the presence of Alernaria spp.
3.18 Statistical analysis
The collected data for different parameters were compiled and tabulated.
Appropriate statistical analysis was made by MSTAT-Computer package program. The treatment means were compared by Duncan's Multiple Range Test (DMRT). ANOVA table was shown in appendix V.
CHAPTER 4 RESULTS 4.1 Percent leaf infection
The effect of different treatments on leaf infection of mustard at different days after sowing (DAS) summarized and presented in Table 2. Different treatments had significant influence on percent leaf infection of mustard (SAU Sharisha 3) at different days after sowing (DAS). Percent leaf infection of mustard increased gradually with the advancement of crop growth. At 85 days after sowing (DAS), the highest percent leaf infection (60.76%) was found in T1 (control) and no leaf infection (0.00%) was recorded in treatment T10 where nine spraying were done with Rovral 50 WP (0.2%). The inhibition of leaf infection was 100% in case of T10where 9 sprays were applied. The inhibition of leaf infection gradually decreased with the decrease of number of sprays.
(Table 2)
4.2 Percent leaf area diseased
The effect of different treatments on leaf area diseased (LAD) of mustard at different days after sowing (DAS) summarized and presented in Table 3.
Different no. of spray had significant influence on percent leaf area diseased of mustard (SAU Sharisha 3) at different days after sowing (DAS). Percent leaf area diseased of mustard increased gradually with the advancement of crop growth. At 85 days after sowing (DAS), the highest percent leaf area diseased (24.42 %) was found in T1 (control) and the lowest percent leaf area diseased (0.00%) was recorded in treatment T10 where nine field spraying applied with Rovral 50 WP (0.2%). The reduction of leaf area diseased (LAD) was cent percent while 9 sprays with Rovral 50 WP (0.2%) were done and the LAD was found to be decreased gradually with the decrease of number of sprays (Table 3)
Table.2 Effect of different treatments on percent leaf infection of mustard at different days after sowing (DAS)
Treatments % Leaf infection % Inhibition of leaf infection over control at 85 DAS
65 DAS 75 DAS 85 DAS
T1 30.55 a 49.05 a 60.76 a 0
T2 19.67 b 28.92 b 29.50 b 51.44
T3 12.63 c 16.13 c 21.63 c 64.40
T4 8.470 d 12.49 d 19.47 c 67.95
T5 4.625 e 7.925 e 15.38 d 74.69
T6 3.465 f 4.960 f 10.47 e 82.77
T7 2.570 g 3.915 g 8.070 e 86.72
T8 1.283 h 2.132 h 3.908 f 93.57
T9 0.5650
hi
0.8950 i 1.590 fg 97.38
T10 0.0000 i 0.0000 i 0.0000 g 100
% LSD 0.8322 0.9700 2.403
% CV 6.84 5.29 9.7
In a column means having same letter(s) do not differ significantly at 5% level.
T1= No field spraying
T2= One field spraying with Rovral 50 WP@ 0.2%
T3=Two field spraying with Rovral 50 WP @ 0.2%
T4=Three field spraying with Rovral 50 W@ 0.2%
T5=Four field spraying with Rovral 50 WP @ 0.2%
T6=Five field spraying with Rovral 50 WP @ 0.2%
T7=Six field spraying with Rovral 50 WP @ 0.2%
T8=Seven field spraying with Rovral 50 WP @ 0.2%
T9=Eight field spraying with Rovral 50 WP@ 0.2%
T10=Nine field spraying with Rovral 50 WP @ 0.2%
Table.3 Effect of different treatments on percent leaf area diseased (%LAD) of mustard at different days after sowing (DAS)
Treatments % Leaf area diseased (LAD) % Inhibition of LAD over control at 85 DAS
65 DAS 75 DAS 85 DAS
T1 7.008 a 16.99 a 24.42 a 0
T2 6.255 b 12.43 b 19.37 b 20.68
T3 5.380 c 10.72 c 17.10 c 29.97
T4 4.470 d 8.825 d 14.85 d 39.19
T5 3.375 e 6.585 e 12.30 e 49.63
T6 2.465 f 5.677 f 10.20 f 58.23
T7 1.820 g 3.838 g 6.680 g 72.64
T8 1.308 h 2.260 h 3.168 h 87.03
T9 0.5900 i 0.9075 i 1.750 i 92.83
T10 0.0000 j 0.0000 j 0.0000 j 100
% LSD 0.4425 0.8322 1.342
% CV 9.36 8.40 8.42
In a column means having same letter(s) do not differ significantly at 5% level.
T1= No field spraying
T2= One field spraying with Rovral 50 WP@ 0.2%
T3=Two field spraying with Rovral 50 WP @ 0.2%
T4=Three field spraying with Rovral 50 W@ 0.2%
T5=Four field spraying with Rovral 50 WP @ 0.2%
T6=Five field spraying with Rovral 50 WP @ 0.2%
T7=Six field spraying with Rovral 50 WP @ 0.2%
T8=Seven field spraying with Rovral 50 WP @ 0.2%
T9=Eight field spraying with Rovral 50 WP@ 0.2%
T10=Nine field spraying with Rovral 50 WP @ 0.2%
4.3 Percent pod infection
The effect of different treatments on pod infection of mustard at different days after sowing (DAS) calculated and presented in Table 4. Different treatmets had significant influence on percent pod infection of mustard (SAU Sharisha 3) at different days after sowing (DAS). Percent pod infection of mustard increased gradually with the advancement of crop growth. At 90 days after sowing (DAS), the highest percent pod infection (41.01 %) was found in T1 (control) and no pod infection (0.0%) was recorded in treatment T10where nine field spraying were applied with Rovral 50 WP(0.2%). The pod infection was completely controlled (100% inhibition) while 9 sprays were applied with Rovral (0.2%) and the inhibition of pod infection were gradually increased with the increased of number of sprays (Table 4).
4.4 Percent pod area diseased (PAD)
The effect of different treatments on pod area diseased of mustard at different days after sowing (DAS) summarized and presented in table 3. Different treatments had significant influence on percent pod area diseased of mustard (SAU Sharisha 3) at different days after sowing (DAS). Percent pod area diseased increased gradually with the advancement of crop growth. At 90 days after sowing (DAS), the highest percent leaf area diseased (19.26%) was found in T1 (control) and the lowest percent pod area diseased (0.0%) was recorded in treatment T10 where nine field spraying were applied with Rovral 50 WP (0.2%). The inhibition of pod area diseased (PAD) was recorded 100% over control while altogether 9 field sprays were done with with Rovral 50 WP (0.2%) and the inhibition of PAD gradually decreased with the decrease of number of sprays (Table 5).
Table.4 Effect of different treatments on percent pod infection of mustard at different days after sowing (DAS)
Treatments % Pod infection % Inhibition of pod infection over control at 90 DAS
70 DAS 80 DAS 90 DAS
T1 1.832 a 30.70 a 41.01 a 0
T2 1.385 b 20.00 b 29.38 b 28.36
T3 0.9175 c 15.83 c 21.03 c 48.72
T4 0.5975 d 12.27 d 19.44 d 52.60
T5 0.3525 e 7.985 e 15.18 e 62.98
T6 0.2125 f 4.743 f 10.24 f 75.03
T7 0.1175 g 3.863 g 7.970 g 80.56
T8 0.08250 gh 2.082 h 3.780 h 90.78
T9 0.04000 hi 0.8950 i 1.490 i 96.37
T10 0.0000 i 0.0000 j 0.0000 j 100
% LSD 0.04588 0.7759 1.472
% CV 5.53 5.44 6.78
In a column means having same letter(s) do not differ significantly at 5% level.
T1= No field spraying
T2= One field spraying with Rovral 50 WP@ 0.2%
T3=Two field spraying with Rovral 50 WP @ 0.2%
T4=Three field spraying with Rovral 50 W@ 0.2%
T5=Four field spraying with Rovral 50 WP @ 0.2%
T6=Five field spraying with Rovral 50 WP @ 0.2%
T7=Six field spraying with Rovral 50 WP @ 0.2%
T8=Seven field spraying with Rovral 50 WP @ 0.2%
T9=Eight field spraying with Rovral 50 WP@ 0.2%
T10=Nine field spraying with Rovral 50 WP @ 0.2%
Table.5 Effect of different treatments on percent pod area diseased (%PAD) of mustard at different days after sowing (DAS)
Treatments % Pod area diseased (PAD) % Inhibition over control at 85 DAS
70 DAS 80 DAS 90 DAS
T1 7.398 a 12.41 a 19.26 a 0
T2 6.762 b 10.76 b 16.50 b 14.33
T3 4.425 c 8.972 c 15.22 c 20.97
T4 4.090 c 7.220 d 12.72 d 33.95
T5 2.740 d 6.375 e 11.13 e 42.21
T6 1.425 e 4.940 f 9.440 f 50.98
T7 1.135 ef 3.635 g 7.135 g 62.95
T8 0.7700 fg 2.465 h 3.943 h 79.52
T9 0.4250 gh 0.9900 i 1.868 i 90.30
T10 0.0000 h 0.0000 j 0.0000 j 100
% LSD 0.4519 0.8013 0.8801
% CV 10.70 9.56 6.24
In a column means having same letter(s) do not differ significantly at 5% level.
T1= No field spraying
T2= One field spraying with Rovral 50 WP@ 0.2%
T3=Two field spraying with Rovral 50 WP @ 0.2%
T4=Three field spraying with Rovral 50 W@ 0.2%
T5=Four field spraying with Rovral 50 WP @ 0.2%
T6=Five field spraying with Rovral 50 WP @ 0.2%
T7=Six field spraying with Rovral 50 WP @ 0.2%
T8=Seven field spraying with Rovral 50 WP @ 0.2%
T9=Eight field spraying with Rovral 50 WP@ 0.2%
T10=Nine field spraying with Rovral 50 WP @ 0.2%
4.5.1 Number of leaf per plant
Number of leaf per plant was differ significantly due to the application of different treatments. The highest number of leaf per plant (21.90) was recorded in T10 (nine field spraying with Rovral 50 WP) treatment and the lowest number of leaf per plant (15.83) was obtained from T1 (control) treatment (Table 6).
4.5.2 Number of branches per plant
Number of branches per plant differs significantly due to the application of different treatments. The highest number of branches per plant (8.448) was recorded in case of T10(nine field spraying with Rovral 50 WP) treatment and the lowest number of branches per plant (5.575) was obtained from T1(control) treatment (Table 6).
4.5.3 Plant height (cm)
Different treatments had influence on plant height (cm) of mustard. The tallest plant was obtained from T10(nine field spraying with Rovral 50 WP) treatment (119.5 cm). The lowest plant height (94.02 cm) was recorded in case of control plot (Table- 6).
4.6.1 Number of pods per plant
Number of pod per plant was found to differ significantly due to the application of different treatments. The highest number of pod per plant (147.2) was recorded in case of T10(nine field spraying with Rovral 50 WP) treatment and the lowest number of pod per plant (104.3) was obtained from T1 (control) treatment (Table 7).
4.6.2 1000-Seed weight (g)
Thousand seed weight differed significantly due to the application of different treatments. The maximum 1000-seed weight (4.023g) was obtained from T10 (nine field spraying with Rovral 50 WP) treatment while T1 control yielded the minimum 1000-seed weight (2.92g) (Table 7).
4.6.3 Yield (kg/ha)
Significant variation of different treatments was found on yield (kg/ha).
Maximum yield (1882.50 kg/ha) was obtained from T10(nine field spraying with Rovral 50 WP) treated plot followed by T9 (1818.69 kg/ha), T8(1752.50 kg/ha), T7 (1684.00 kg/ha). The lowest yield (1266.55 kg/ha) was recorded from T1(control).
Table. 6 Effect of different treatments on growth parameters of mustard
Treatments Growth parameters
No. of leaf/plant No. of branches/plant
Plant height(cm)
T1 15.83 g 5.575 f 94.02 j
T2 16.81 f 5.892 f 97.94 i
T3 18.09 e 6.225 e 102.2 h
T4 18.50 e 6.560 d 105.1 g
T5 19.48 d 6.938 c 109.3 f
T6 20.06 c 7.153 c 111.7 e
T7 20.50 bc 7.565 b 113.5 d
T8 20.90 b 7.855 b 115.8 c
T9 21.48 a 8.315 a 117.7 b
T10 21.90 a 8.448 a 119.5 a
% LSD 0.4877 0.3308 1.679
% CV 1.74 3.22 1.06
In a column means having same letter(s) do not differ significantly at 5% level.
T1= No field spraying with fungicide Rovral 50 WP @ 0.2%
T2= One field spraying with Rovral 50 WP@ 0.2%
T3=Two field spraying with Rovral 50 WP @ 0.2%
T4=Three field spraying with Rovral 50 W@ 0.2%
T5=Four field spraying with Rovral 50 WP @ 0.2%
T6=Five field spraying with Rovral 50 WP @ 0.2%
T7=Six field spraying with Rovral 50 WP @ 0.2%
T8=Seven field spraying with Rovral 50 WP @ 0.2%
T9=Eight field spraying with Rovral 50 WP@ 0.2%
T10=Nine field spraying with Rovral 50 WP @ 0.2%
Table.7 Effect of different treatments on yield and yield contributing characters of mustard
Treatments Yield and yield contributing characters % Yield increased over control No. of
pod/plant
1000-seed weight(g)
yield (kg/ha)
T1 104.3 j 2.928 d 1266.55j 0
T2 113.7 i 3.076 cd 1331.88 i 4.90
T3 117.7 h 3.19 cd 1393.60 h 9.12
T4 121.5 g 3.305 cd 1472.30 g 13.98
T5 125.9 f 3.395 c 1541.34 f 17.83
T6 130.5 e 3.487 bc 1619.45 e 21.79
T7 133.8 d 3.822 ab 1684.00 d 24.79
T8 138.5 c 3.910 a 1752.50 c 27.73
T9 143.4 b 3.973 a 1818.69 b 30.36
T10 147.2 a 4.023 a 1882.50 a 32.72
% LSD 1.565 0.3783 6.020
% CV 0.84 7.44 0.26
In a column means having same letter(s) do not differ significantly at 5% level.
T1= No field spraying
T2= One field spraying with Rovral 50 WP@ 0.2%
T3=Two field spraying with Rovral 50 WP @ 0.2%
T4=Three field spraying with Rovral 50 W@ 0.2%
T5=Four field spraying with Rovral 50 WP @ 0.2%
T6=Five field spraying with Rovral 50 WP @ 0.2%
T7=Six field spraying with Rovral 50 WP @ 0.2%
T8=Seven field spraying with Rovral 50 WP @ 0.2%
T9=Eight field spraying with Rovral 50 WP@ 0.2%
T10=Nine field spraying with Rovral 50 WP @ 0.2%
4.7.1 Percent seed germination
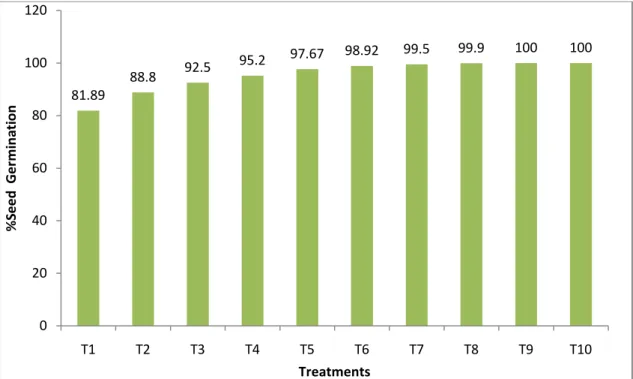
Percent seed germination was found to be significant due to the application of different treatments (Fig.1). Seed obtained from T10(Nine field spraying with Rovral 50 WP) treated plot showed the maximum percent seed germination (100%). Seed obtained from control plots showed the minimum germination percentage (81.89%).
Fig 1: Effect of different treatments on percent seed germination of mustard.
T1= No field spraying
T2= One field spraying with Rovral 50 WP@ 0.2%
T3=Two field spraying with Rovral 50 WP @ 0.2%
T4=Three field spraying with Rovral 50 W@ 0.2%
T5=Four field spraying with Rovral 50 WP @ 0.2%
T6=Five field spraying with Rovral 50 WP @ 0.2%
T7=Six field spraying with Rovral 50 WP @ 0.2%
T8=Seven field spraying with Rovral 50 WP @ 0.2%
T9=Eight field spraying with Rovral 50 WP@ 0.2%
T10=Nine field spraying with Rovral 50 WP @ 0.2%
81.89 88.8 92.5 95.2 97.67 98.92 99.5 99.9 100 100
0 20 40 60 80 100 120
T1 T2 T3 T4 T5 T6 T7 T8 T9 T10
%Seed Germination
Treatments
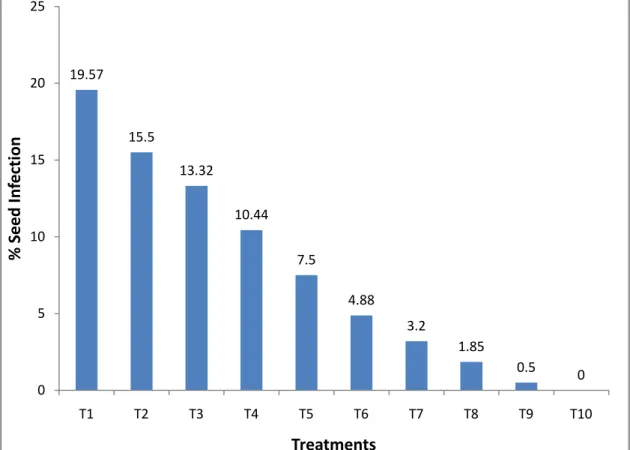
4.7.2 Percent seed infection
Percent seed infection by Alternaria spp. of harvested seeds was varied due to the application of different treatments. Comparatively lower seed infection was found in the seed lot obtained from treated plot with higher number of sprays.
Seeds obtained from control treatment showed the higest percent seed infection (19.57%) while seeds obtained from T10 (nine field spraying with Rovral 50 WP) treated plots showed the lowest seed infection (0.0%).
Fig .2: Effect of different treatments on percent seed infection of mustard.
T1= No field spraying
T2= One field spraying with Rovral 50 WP@ 0.2%
T3=Two field spraying with Rovral 50 WP @ 0.2%
T4=Three field spraying with Rovral 50 W@ 0.2%
T5=Four field spraying with Rovral 50 WP @ 0.2%
T6=Five field spraying with Rovral 50 WP @ 0.2%
T7=Six field spraying with Rovral 50 WP @ 0.2%
T8=Seven field spraying with Rovral 50 WP @ 0.2%
T9=Eight field spraying with Rovral 50 WP@ 0.2%
T10=Nine field spraying with Rovral 50 WP @ 0.2%
19.57
15.5
13.32
10.44
7.5
4.88
3.2
1.85
0.5 0
0 5 10 15 20 25
T1 T2 T3 T4 T5 T6 T7 T8 T9 T10
% Seed Infection
Treatments
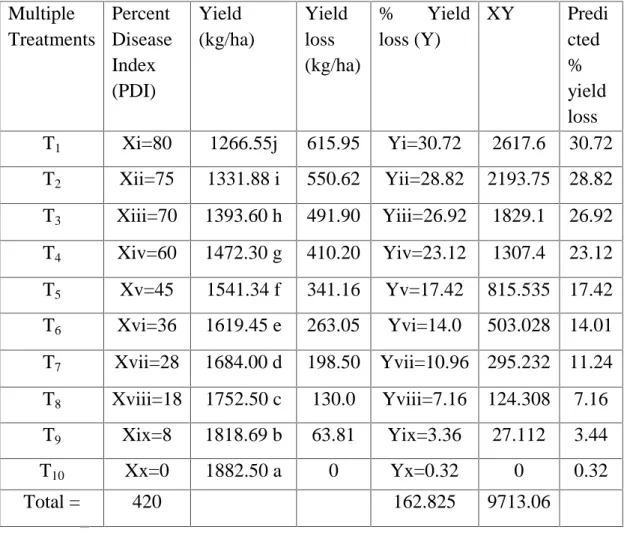
4.8 Estimation of mathametical model for yield loss assessment
Using the variation of Percent Disease Index (PDI) and corresponding yield loss from multiple treatment experiment, the predicted yield loss (Y) was calculated using the working formula of regression equation and presented in Table 8. Further, using the predicted yield loss and corresponding disease severity the yield loss assessment model was constructed as Y = 0.32 + 0.38 Xi. By setting any Xi’s value (PDI) in the formula, the yield loss of mustard due to grey blight disease could be estimated.
Table 8 Predicted yield loss calculated by percent disease index (PDI) and corresponding yield loss from multiple treatment experiment
Multiple Treatments
Percent Disease Index (PDI)
Yield (kg/ha)
Yield loss (kg/ha)
% Yield loss (Y)
XY Predi
cted
% yield loss T1 Xi=80 1266.55j 615.95 Yi=30.72 2617.6 30.72 T2 Xii=75 1331.88 i 550.62 Yii=28.82 2193.75 28.82 T3 Xiii=70 1393.60 h 491.90 Yiii=26.92 1829.1 26.92 T4 Xiv=60 1472.30 g 410.20 Yiv=23.12 1307.4 23.12 T5 Xv=45 1541.34 f 341.16 Yv=17.42 815.535 17.42 T6 Xvi=36 1619.45 e 263.05 Yvi=14.0 503.028 14.01 T7 Xvii=28 1684.00 d 198.50 Yvii=10.96 295.232 11.24 T8 Xviii=18 1752.50 c 130.0 Yviii=7.16 124.308 7.16
T9 Xix=8 1818.69 b 63.81 Yix=3.36 27.112 3.44
T10 Xx=0 1882.50 a 0 Yx=0.32 0 0.32
Total = 420 162.825 9713.06
Calculation:
X = ∑ (n= No. of observation).
= 420/10
= 42
Ȳ = ∑ (n= No. of observation)
= 162.825/10
=16.28
We know, Regression equation
Y= Y + b (Xi- X) (working formula) Here, Y = Predicted yield loss (%)
Y = Estimated yield loss (%)
Xi= Disease severity (i = 1, 2, 3,………n) b = Regression value
=∑∑( ∑ ∑)
=
× .
( ) ( ) ⋯…….. ( )
= 0.38
Now putting The X, Y and b values in the regression equitation, Y= Y + b (Xi- X)
=16.28+0.38 (Xi-42)
=16.28+0.38Xi-15.96
= 0.32+0.38Xi Y= 0.32+0.38Xi
Now Setting Xi’s values in the Regression equation When Xi= 80, Y= 0.32+0.38×80= 30.72
When Xii= 75, Y= 0.32+0.38×75= 28.82 When Xiii= 70, Y= 0.32+0.38×70= 26.92 When Xiv= 60, Y= 0.32+0.38×60= 23.12 When Xv= 45, Y= 0.32+0.38×45= 17.42 When Xvi= 36, Y= 0.32+0.38×36= 14.01 When Xvii= 28, Y= 0.32+0.38×28= 11.24 When Xviii=18, Y= 0.32+0.38×18= 7.16 When Xix=8, Y= 0.32+0.38×8= 3.44 When Xx=0, Y= 0.32+0.38×0= 0.39
Now, making a correlation graph using the corresponding Xi’s and Y values we with the following graph
Fig. 3 Mathematical model point for estimation of yield loss of mustard due to grey blight disease caused by Alternaria brassiciae and Alternaria brassicicola.
30.72 28.82 26.92 23.12
17.42 14.01 11.24
7.16 3.44 0 0.32
5 10 15 20 25 30 35
0 20 40 60 80 100
% Yield loss
% Disease severity
Fig.4: Field view at flowering stage of mustard
Fig.5: Field view at fruiting stage of mustard
Fig.6: Infected (Grey blight diseases) leaves of mustard
Fig.7 : Infected (Grey blight diseases) pods of mustard
Fig.8: Conidia of Alternaria spp. under stereo microscope at 50x