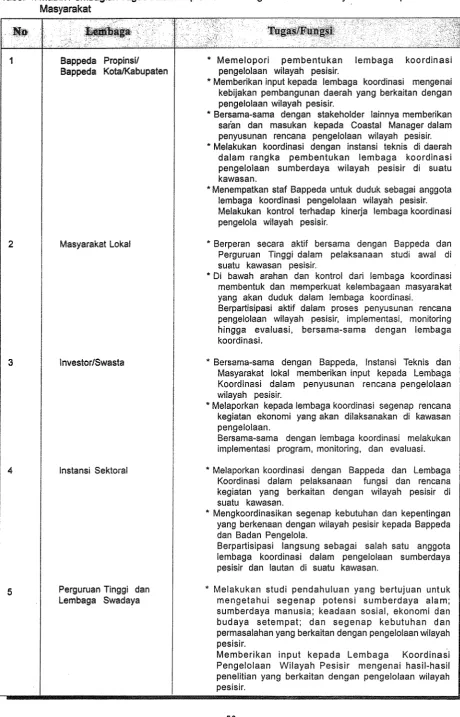
UNTUK PELATIH
WIUYAH PESISIR TER
BOGOR, 21
-
26
FEB
H
2000
DR. IW. Dietriech 6. Bengen, DEA
.
Cover Layout : Pasus kegowo, Prsyek Besisir PKSPL -IPB
Layout : Siti Nunvati Hodijah dan Vitri Karina, Proyek Pesisir PUPL-IPB
"
ISBN : 979-9336-04-X*
Funding for preparation. and printing of this document was provided by USAID as pad of BAPPENAS Natural Resources Management Program and the US
Prosiding Pelatihan untuk Pelatih, Pengelolaan Wilayah Pesisir Terpadu
L A P B U N PENYELENGGA
PELATIHAN UNTUK PELATHH
PENGELOLAAN WILAYAH BESISIR TEWPAlleU
(TOT-HCM)
' al Wr. W.
P
a marilah kita pmjatkan ke hadirat Tuhan Umg Maha Kuasa, karena a-Nya kita dapat b ul di Hotel Salak ini mtuk m e n m t i aeara p Pelat&an mtuk Pelatih. dalam. Pengelolaan Wilayah Pesisir Terpadu (TOT-ICIM).pengalman
dan
infonnasi &lam pengelolaan wilayah pesisir terpadu. Peld m strategis mengingat pada saat ini sunnberdaya Glayah pesisir memerlukm perhatim khusus mtuk
. Dalam melaman upaya ini, selain dip mitinen
dan
aksi nyata dalam mengelolaa yang diharapkan di atas sangatlah sew& dengan hjuan yang ditetapkisn dalm
pelatihan
ini,
yaitu untuk meningkatkm k e m 6 m baik perseormgm m a w kelompk keja parapeserta d a f m pengelolaan d a y a h pesisk terpadu. Tujum ini akan dicapd melalui d m yakni : (1) memberikan infomasi tentang koniep pengelolaan wilayah pesisir di Ind
meni.ngkatkan pemaharnan dan kernampurn para peserta dalam pengelolaan klayah pesisir terpadu, a peserta akan dapat menyusun suatu perenemaan, pelaksanaan
dan
olaan d a y a h pesisir itu sendhi. an di kelas
dan
lapangan dengantudi kasus dan praktek lapang, adanya pengajar d m ins j-ang berpengalmm di bidan rnengueapkan terima kasih kepada para pengajar d m ins materi dalam pelatihan ini. Juga kepada para panitia pe
pelaksanaan pelatihan
ini,
saya ucagkan terima kash.Proyek Pesisir, Bapak Ian M.
D
on dengm h o m t unlukor IPB, Bapak Prof. Dr. Ir. H. M. Aman Wrak
dan
sekaligus &pat membuka secara re(Tmining Leader) .<
Prosiding Pelatihan untuk Pelatih, Pengeiolaai Miayah Pesisir Terpadu
N
REKTOR
IPB
N PELATIHm UNTUK PELATIN
(TOT-ICM)
Assalm'd Wr. W.
Saudaga D e b Fakultas Perikanan dan I h u Kelautan S a h a Kepala PKSPL IPB
Saardara CRna Chief of Party, yang saya homati Para Peserta Pelatihan 'TOT IICM", yang saya cintai
P
ah
sama-sama kita panjatkan ke hadirat Allah Swta, s e e g g a kita semua dapat bertemu pada acara pem
salawat dan s a l m marilah sama-sma kita haturkan ke hadirat jmjungan Eta, Nabi M
arkan kita ke dunia yang lebih h g g i peradabmya.
saya ucapkan kepada para peserta pelatihm yang telah datang dari berbagai penjunr tanah
air
di Institut Pertmian Bogor, semoga keberadaanya di Bogor untuk beberapa hariini
dapat ah berbagai infomasi dan wawasan, fiususnya yang terkait dengan pengelolm wil ayah pesisir danlautan.Saudara-sadma peserta pelatrhan..
.
o Pengelolaan vvilayah pesisir dan lautan di Indonesia saat ini rnenjadi isu penting d m s
dijadikan "vvacana publik" d m diimplementasikm pada berbagai bentuk program-
memberikan nilai tarnbah padapernbangungan e k o n o ~ Indonesia saat ki yang mas&
,
serta pada peningkatkan kesejahteraan nelayan yang menjadi objekdan
subjek pengelolaan vvilayah pesisirdan
lautan itu sendiri. Namun yang jadi perhatian dam pengelolaan w-2dan
lautanini
janganlah hanya menjadi komoditi poli~k sernata, i bagharrapengelolaan d a y a h pesisir dm lautan ini menjadi aset ekonomi yang &pat membm&tkan Indonesia saat ini.
pengelolaan, maka seyogymyalah kita rnempertirnbmgkan krsmapada bentuk- bentuk pengelolaan yang tidak hanya memikirkan keuntungan jangka pendek &an tetapi lebih pada yang dapat rnenjarnin kelestarian smberdaya yang dikelolauntuk mass yang ti& terbatas, apat dirasakan dari generasi ke generasi. Terkait dengan hal
ini,
sayakira be& pengelolaan yang berkelmjutan dan terpadu serta berbasis padamasyarakat menjadi salah. satu bentuk yang @at dijadikan model pengelolaan di wilayah pesisir dan lautan di Indonesia.o Dimping itu dalatn pengelolaan wilayah pesisir
dan
lautanini,
maka terb sistem hfonnasi yangbaik
dan
terbinmyajaringan kerja (net working) dari berbagai pihak yang terkait (pemehtah, per tinggi,
LSM, swasta, BUMN, dan Koperasi) dalam pengelolaan wilayah pesisir d m lautanPeiaffhan untuk Pelatih, PengefoIaan M y a h Pesisir Terpadu
dangm Proyek Pesisir irai dapat &j i
dan
pengaldm antar sMuniversim
elolaan smberdaya itu sen&.
berbagai temuan-temuan &
jasama dengan PKSPL IPB kami ueapkm terima k s & ,
Rektor IPB
PROF. DR. Aman Wirakarkakusumah
Pelatihan untuk Pelatih, Pen~eIoIaan Wilayah Pesisir Tepadu
PARTY PROYEK
PESISIR
PELAT
m T U K PEEATmW
PENGELOLAAN W L A Y M
PESISIR
TERPAI)ET
(TOT-IGI$I)
Pak Rektor,
Para undangan yang terhsrmat,
Para sewan.
@is nama Coastal Resources Centel; University oflhode Island, saya ucapkm t e h a kasih atas
A
esempatan yang diberikm pada saya u nmemberikan ~yang sudah an& semua k e a u i , Proyek Pesisir m e ~ l S hubmgm em%
Sunnberdaya Pesisir dan L a m di IPB. Bersma kawan baik saya, Dr. Ro
membangun suatu proyek yang nanhya terbukti, menjadi &pirator bag
masa
h
i
dan juga dapat memberikan eontoh awal bagairnana Indonesia dapat meningkatkan proses isir dm lamya yang beraneka ragm.mendengar lebih lanjut mengenai bagairnana kami merintis pengelolaan a pada tingkat nasional. Saya sangat bangga dengan has2 yang apai hingga saat
ini,
te karena tirn staflndonesia k m i bemama mitrakqadi
U ~ v e ~ i -tas, LSM dan kelompok masyarakat saat ini dialmi sebagai pemirnpin d d m pengelolaan swberdaya pada anda semua, terutma Pak h m , Rektor P B saya hendak mengun&apkan betapa besar a hubungan karni selama h i dengan PKSPE-IPB. Bersma rekan t e r b d saya
Dr.
Dietrieeh gai pemimpin tim PKSPL, telah bmyshk keberhasilm kits raih d a l m tiga t&un terakhir. J m a l nasional, newsletter nasiond, Pevustakaan Kelautan Nasional, konperensi, web site sudah diakui g kurang dikenal orang mun&n adalah Learning Team yang telah membantuProyek Pesisir mempunyai komitrnen kuat wtuk belajar dari proses pengernbangm program pengelolaan sumberdaya pesisir. Sejak 1998, Learning Team yang diphpin oleh Dr. Fedi Sonata telah menjadi
tlm
penting yang mendokumentasikm s e m kegiatan Proyek Pesisir. Hsil dokumentasi tersebut &pakai sebagai pedoman dan prinsip pekerjaan selanjutnya, ha1 tersebut &an anda pelajari ddam train- ingini.Saya harap anda akan dapat memiliki persepsi yang baik tentang program pembelajaran
ini
seperti hahnya kani d m anda dapat memperoleh manfaat yang baik dari miningini.
Untuk menghomati Dr. Chou, saya akan melanjutkan smbutan saya &am bahasa Inggris, semoga anda dapat mengikuti bahasa saya.
Prosiding Pelatihan untuk Pelafih, Pengelolaan Wlayah Pesisir Telpadu
SAMBUTAN KEPALA PKSPL
-
IPB
M D A ACARA PEMB
AN
PELATI
UNTUK PELATIM
PENGELOL
WIEAUAN PESISIR TEWBAH)U
(TOT-ICM)
Ass. Wr. Wb.,
Sdm sejahtera Bagi kita Sema, dan
P
a-tma rnarilah kita panjatkan puji dan ke hadirat Tuhan Uang Maha Esa, bahwa hanya karena Ridlo Nya kita bersarna dapat men ara pembukaan Training of Trainer Integrated Coastal ,Management.Perhatianterhadap pengelolaan surnberdayapesisFr sejak 10 tahun sangat interns& berbagai kalangan, lebih-lebh ketika bangsa Indonesia dilanda krisis ekonomi yang berkepmjmgan
daar
bed&- l m . Adanya krisis ekonomi dan keuangan yang melanda bangsa Indonesia pada pertengahm tahun1997, telah mempengaruhi suhu pofitik di Indonesia (demohatisasi) ymg s e e m langsung berdarnpak gosits bagi pembangunan kelautan Indonesia tennasuk sumberdaya pesisir, yaitu (1) I
1999 tentang Pemerintahan Daerah clan W N o . 25
Tahun
1999Daerah yang
akan
memberikan kewenangan bagi Daerah wuk mengelala pesisirdan
laut; dan (2) terbentuknya Departemen Eksplomi h u td m
Pelokomotif penggerak p an kelautan dan perikanan nasional.
Perubahan yang i atas sangatlab. tepat, mengingat pembangunan wilayah pesisir hdone- sia %lama ini belum mendapatkm perhatian yang memadai. Padahal wilayah pesisir merruIliki perm
dan
a h pentkg bagi bangsa dan masyarakat Monesia. Hal ini paling tidak &pat dilihat dari dm aspek, yaitu a, secara sosial ekonomi wilayah laut dan pesisir memiliki arti penting k m n a (a) sekitar 140 juta nduduk Indonesia hidup di wilayah pesisir (dengan pe
uhan
rata-rata 2 96 per tahun); (b)sebagian besar kota (kota propinsi dan kabupaten) terletak di kawasan pesisir; (c) kontribusi sektor: kelautan terhadap PDB nasional sekitar 12,4 %; dan (d) industri-indmtri di wilayah pesisir (coastal and marine industries) menyerap lebih dari 16juta tenaga kerja secara langsung.
Kedua, secara biofisik, wilayah pesisir Indonesia merniliki
arti
penting karena (a) Indonesiamefili& garis pantai terpanjang di dunia setelah Kanada (sekitar 81.000 km), yang memilib potensi untuk pernbmgunan; (b) sekitar 75 % dari wilayahnyamempakan wilayah perairan (sekitar 5.8 juta k m 2 t e m u k ZEE), yang mengandung berbagai ragam sumberdaya dam baik sumberdaya pula, tidak pulih, surnber energi, maupun jasa lingkungan; (c) Indonesia mempakan negara kepulaum terbesar di dunia dengan j d a h pulau sekitar 17.508 pulau; dan (d) wilayah pesisir Indonesia memiliki keanekaragarnm hayatiyang besar.
Berdasarkan pengalaman pengelol mbangunan pada masa lalu, selain mencapA keberhilm juga telah menimbulkan berbagai perm pembangunanpesisir yang a h m e n j d 'pekajaan
bagi para pengelola wilayah pesisir. Permasalahan pesisir yang dihadapi saat ini antara lain adalah pencemaran yang terjadi di beberapa kawasan pesisir, kerusakan kualitas lingkungan dan surnberdaya seperti mangrove dan t e m b u karang (hanya 6,3 % yang masih baik), overfishing pada sektor perkanan,
Prosiding Pelatihan untuk Pelatih, Pengelolaan Wilayah Pesisir Terpadu
Pelatihan
untuk
Pelatih (Training for Trainer) yang diselenggarakan oleh Pusat Kajian Sumberdaya Pesisir dan Lautan - Iilstitut Pertanian Bogor bekerjasama dengan Proyek Pesisir ini mempakan salah satu upaya PKSPL-IPB dan Proyek Pesisir untuk turut serta dalarn mengembangkm pengelolaan wilayah pesisir seem terpadu. Pel hi bertujuan untuk (a) meningkatkan andan indi~du dari para peserta dalam bidang pengelolaan sumberdaya pesisir; (b) menyamakan persepsi mengenai konsep pengelolaan wilayah pesisir secara terpadu; (c) mengemban&km kapasp l a f i dalm pelatihan pengelolaan pesisir terpadu; (d) memperkuat jaringan antar
pusat pendidikm dan pelatihan dalam pengelolaan wilayah pesisir; dan (e) memperkuat kerjasma ymg adamupun merintis yang b m , bak secara formal mupun informal dengan berbagai S t u s i yang bergerak di d a y a h pesisir.
Dengan pelaksanaan kegiatan pelatihan
ini
yang dilakukan secara dinamis d m inte&f baik antara peserta dengan instruktur ataupm narasumber, m a w antara peserta dengan peserta 1putkwil yang diharapkan dari setiap peserta pelatihan ini minimal meliputi tiga asp adanyaperubahan wawasdpengetahuan tentang bgaimana mengelola v\rilayahpesisir beserta
aim di dalamnya secara optimal d m berkelmjutan melalui pendekatan pengelolaan terpadu; kedua, setelah adanya pembahan wawasan, pada tahap selmjutnya diharapkan adanya perubahan anitude mtuk membmgun urilayah pesisir berdasarkm kaidah-kidah pembangunan berkelanjutan, ketiga, pada tahap- t&ap sel4utnya para peserta diharapkan menjalin kerjasama (networking) di antara sel
holder yang terlibat &lam pengelolaan pesisib. Dengan demikian, harapan mtuk menge pesisir beserta sumberdaya alam di d secara optimal dan berkelanjutan dapat te
Prosiding Pelatihan untuk Pelatih, Pengelolaan Wilayah Pesisir Terpadu
DAFTAR IS1
...
Laporan Pemimpin Pelatihan (Training Leader ) ,..i
. .
...
Sarnbutan Rektor IPB.. ..II
Smbutm Chief ofparty Proyek Pesisir
...
iv...
Sambutan Kepala PKSPL
-
IPB vSTANTO, T.
-
Valuasi ekonoani sumberdaya waayah peskir dan lautan...
1/"
DUTTON, I.M. - Proyek Pesisir: l I n s ~ t u 6 o n a b g coastal resources managenoeat h hdonesia....
35OWO, S.
-
Pranata sosial rnasyarakat pesisir...
40 W' CHOU, L.M.-
The process and framework of integrated coastal management...
43 ZBPUIANI, N.P. dan DARnUWAN-
Pengelolaan sumberdaya pesisir terpadu berbasis...
masyarakat
UTRA,
S.A.-
Sistern hukum dan kelembagaan pengelolaan wilayah peshir +dan lautan
...
61 WDIGDO, B.-
Diperlukan pernbakuan larite~a eko-biologs unbkmenemhkala ""ptensi alami" kawasan pesisir m t u k budidaya udang...
69.-,,
@QNGEN, D.G. d-* - Pengelolaan ekosistern wilayah pesisir
...
74-, D
-
SiWlus penyusunan program penagelolaan wasayah peskir seeam terpad u... 9!:!/
...
(2~-
P m W A T I-
Pengembangan ekowisata bahariPETER, T.
-
Beranan pergurua i darm lembaga swadaya masyambt dalan IGM...
100 ./'AH, S.
-
Metode PPCA dan...
1 0 i//SOhQITA, M.F.A. - hletode identifikasi isu gengelolaan pesisir
...
RI, R.
-
Strategi dan program pengelolaan sumberdaya pesisir dan lautan Indonsia....
Brofd ku peskir Tarnarm Buaya Blanakan, Subang
...
132 Pro% iden~fikasi ku pada kawasan proyek pandu THW Karawang...
136...
Jadwal P e l a ~ h a n TOT-I@M dan daftar peseda 140
Prosiding Pelatihan untuk Pelatih, Pefrgeiokn Mayah Pesisir Terpadu
W U A S I
EKONONLI SU
PESllSIR
DAN LAUTm
DR. IR. TRIDOYO KUSURaASTANTO, MS
Pusat G j i a n Surnberdaya Pesisir dan Lautan Fakultas Pefikanan dan Ilrnu Kelautan
InsGht Pertanian Bogor
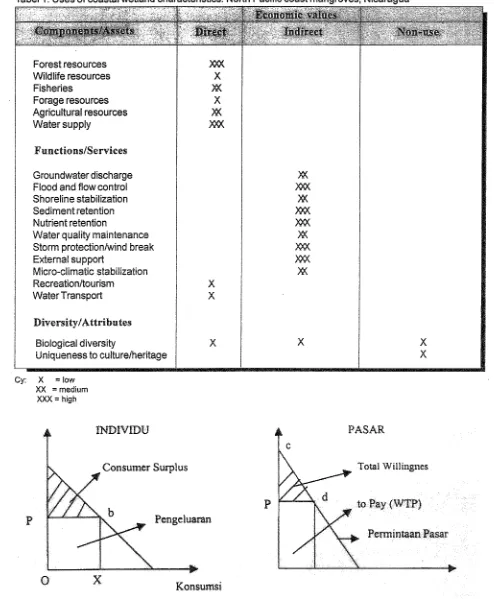
tersebut. Sebagai ilustrasi Barbier (1 993) zone) mengemukakan kegunaan 6'Coastal Wetland" di
~ght"
Nicaragua seperti tercantum dalam Tabel 1. di wilayah tersebut di kelola oleh publik atau tidak (terlampir). Dari nilai ekonomi tersebut dapat terdapat kejelasm kepernilkamya. Pada negara- dinyatakan bahwa tingkatnegara berkembmg maupun maju
aktivitas
ekonorni penilaim e k o n o ~akan
selaludi wday pengelolm sumberdaya tvilayah pesisir, sehingga
'2 psatnya
/ i - pendekatan antar disiplin (interdisciplinauy ap-
berdaya pesisir termcm k e l e m L m 2 .
- Interhi antaratanahdanlautm gori peklaian ekonomi pang
hidrologi
di
t~iilayah pesisir mempuny& stik digunakan dalam rnernecahkan mas&&-masdah yang spesifik sehingga pembmgunan/pembahan kebijakan vvilayah pesisir @=bier, 1993) y a k 6 :pada wilayah tersebut dapat mengakibatkan 1. Pmgact analysis pakni kerusakan yang pengafuh (impact) ymg sangat "si
'.
Perilaku diakibatkan oleh suatu kegiatan pada sistem dari produsen yang mem t d m pesisir, khususnya berupadamp&
Lingkungan. konsumen ymg memaksi an utilitas d a l m Msal: penilaian kemsakm lingkungan pesisir memanfaatkan sumberdaya pesisir dapat karena-pahanminyak.mengakibatkan alokasi erdayadarm lin-gan 2. P a ~ I v a l u a b t t y a h i suatupenilaian atternatif ymgtidakefisiense~araekonorni.Dengandedan alokasi sumberdaya atau proyek yang campur tangan pemerintah diperlukan untuk lneng sistem pesisirlsumberdaya, dengan mengatur sumberdaya yang langka sehingga tuju atkm pilihm yang terbak pada
an (sus- p e m d a a m sistern sumberdaya pesisir.
Contoh : pemilihan altematif antara pernanfaatan Namm usaha-usaha tersebut sering menemrri sistem/sumber&ya pesisir untuk usaha perikanan
omi d m p e m e ~ t a h karang vs pariwisata bawah laut/karmg.
tentang d a i ekonomiJ 3. I;ion yakni penilaian ekonomi secara d a y a h pesisir. Kesulitanpenilaim dari sistern pesisir. Pendekatm ini ekonomi tersebut lebihnyata karena sutnberdaya
di
&l dalam menentukan nilai ekonomi total laya ah tersebut tidak diperdagmgkm di "pasar" m dalam akuntansi sumberdaya sehingga aplikasi dari p e ~ l a i a n sumberdaya yang nasional.Lid& dipasarkan (non market valuation) perlu
agar ' W e ofl" antara pembangunan $ari Wilingness to Pay WTP) dan WIZE'ngness to
barang dan jasa yang disediakm oleh lingkungan Accept
W A )
dapat menjadi pertimbangan dalam pengmbilan Total kesejahteraan sosial (TotalSocial Wel- keputusan untuk pengelolaan wilayah pesisir fare) dari konsumsi barang dan jasa adalah sama (coastal zone managemenf/CZM) secara lestari. dengan jurnlah daxi setiap individu yakni area
pengeluaran (OXPb) dan consumer surplus (Pba).
KONSEP DASAR PI%NILAIAN EKONOMI Dengan menggunakan harga (P) dan konsumsi
(X)
SMBERDAUA maka didapatkan minimum dugaan utilitas
Nilai sumberdaya pesisir tropis e.q mangrove (kegmaan) dari pemmfaatan faktor lingkungan. dan coral reef ditentukan oleh fimgsi surnberdaya Consumer surplus perlu dimasukkan untuk
Tabel 1. Uses of coastal wetland characteristics: North Pacific coast mangroves, Nicaragua
Forest resources Wildlife resources Fisheries
Forage resources Agricultural resources Water supply
Groundwater discharge Flood and flow control Shoreline stabilization Sediment retention Nutrient retention
Water quality maintenance Storm protectionhind break External suppoFt
Micro-climatic stabilization Recreation/tourism Water Transport
Biological diversity
Uniqueness to culturelheritage
cy: X = low
XX = medium XXX = high
menmgkap nil& kesel an bagi individu. Bila plus d m pengelu onsumsi pada pasar. Ben- f i o r Iingkungm
dini
(P=O) maka consumer efit sosial dapat d elalui fungsi pemintaansurpEus meliputi area yang besar. Bila lhgkungm pasar. W P menggmbarkan kemauan pasar untuk
[image:11.595.61.555.63.662.2]Maksh&asi Kesejalateraara Sosial (Social
Wrenfare)
Barmg dan jasa yang dipasarkan dalam kondisi pasar yang tidak terdistorsi akan rnendapatkan harga yang mggarnbarkan harga Ymg se a untuk masyarakat. Nilhya sama dengm nilai pilihan t e r b d (best alternatza atau disebut sebagai "social" opportunity cost (shadw
Marginal Soc. Bent
price). Dithj au
dari
produsen maka marjinal cost rneningkat bila outputcost yang menggm
rneningkat dengan bertmbahnya supply. Harga ditetapkan di atas biaya maka daerah di atas supply dan di bawah harga disebut se
Produser surplus
PS).
Kesejahteraan sosial total diukur dengan menjmlahkan PS d m CS d m nilalnya a k a
i d sosiaI beneJit WSB)
Valuasi ekonomi surnberdava ... (1
-
34)Nilai Ekonorni dam Metoda Pennaian
D d m pendekatan pedlaian secara ekonomi
d a l m penggunaan smberdaya klayah pesisir. CBA bertujuan untuk memaksimumkan kesejahteraan sosial dengan cara mengalokas&an surnberdaya seefisien mun-
Kriteria yang digunakan dalam evaluasi k e b i j h adalah sebagai berikut :
1. Net Present Value
e Total Economic Value = Total Use Value -I-
Non Use Value
=TDV
+
T I V+
OVe TDV
-
Total Direct Use Value :-
Extractive-
Non exkacfivee TEV
- Total Indirect Use Value
e OV
-
@tiom Value-
Potensial untuk digunakandi
masa depan.estruction yang ir reversible.
b. BV
-
Bequest Value-
preservasi natural heritage (warism darn) (tidak didiskon).c. EV
-
Existence ialuew V = B d + B e - C d - C e - C p
-
nilai dari ilmu pengetahurn tentang ekosistem.N2ai Ekolaomi dal*ir Penggunaan Ekosistem
Bd = Benefit langsung dari proyek Pesisir
Tabel 3. men ekonorrzi bervariasi yang
penggunaan yang multiple dan sering terjadi Cp = Biaya proteksi lingkungan penggunaan tersebut non compatible.
2. Internal Rate of Return (IRTig)
-
3.' Benefit Cost Ratio
4. Least Cost
Dalarn Total Valuation Approach dil
penilaian ekonomi
dari
se sistem sumberdaya pesisir. Tabel 2 menmjukkan konsep yang digunakan dalarn Total EGonomic Value.TEV = TUV
+
NUVMetoda Evaluasflenilaian Ekanomi
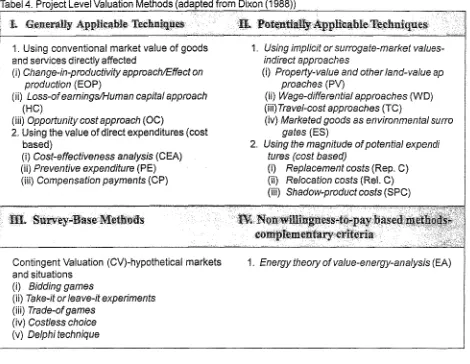
Beberapa metoda penilaian ekonofi disajikan pada tabel 4 berikut :
Sebslgian dari metodayang disajihpadatabel tersebut berdasarkan "'coast based & approach".
sebagian dari total economic value. Narnun demikian masih sangat berguna sebagai alat pengmbil keputusan.
1. COB (Chrmge o ~ z Productivty)
Pembahan kualitas lingkungan berpengaruh terhadap produktivitas dan biaya produksi. Diukur net and effect dari produksi pada saat dengan proyek dan tanpa proyek.
2. Haman Capital OfC)
-
Identifikasi pollutan yang menyebabkan sakit-
Tentukan hubungan dosis-responsedan
kejadian jumlah populasi yang terkena resiko-
Hitung kehilangan waktu produktifdan
Prosiding Pelatihan untuk Pelatih, Pengeblaan Wilayah Pesisir Tepadu
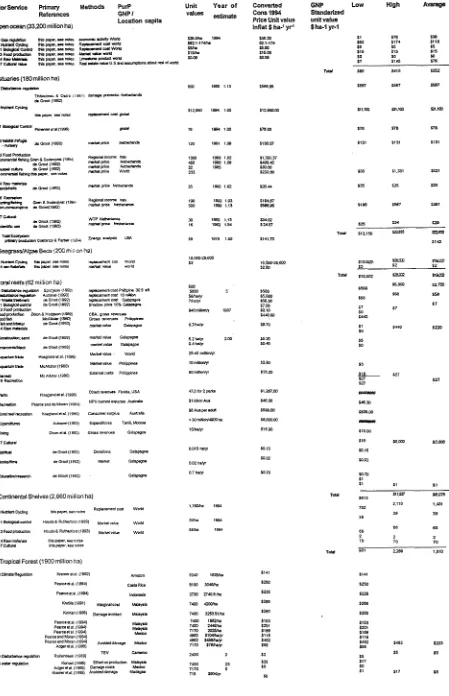
Tabel 2. Primary data sources and calculations for the valuation estimates, by biorne and service type
Blor Service
Referames
Methods Pur?
GNPI Lccaticn capita
Unit Year of values
Ccnve~ted
cam 1894 Price Unitvalus Inflat $ ha-' yr'
GNP Low High
unit value $ ha-4 yr-4 Open 0~88n(33,200 million ha)
EsWries (180 million ha)
3--
maodtav a ~ n m jiwii cmq. m
a ua* iisa)
8-Cw-0
ai.p+a.acilrer ipPanon-p*P1
@=as 12W m>i, rn ha)
Goral reefs (62 rniliicm t!aJ
$0 70
15 20
SOY)
€&A&"-* dc Gmd (1992)
-
Continental Shelves (2,660 million ha)~ ~ c y d n p this-. see notes d R- We
[image:14.601.80.529.89.785.2]Valuasi ekonomi sumberdaya ... (1 - 34) IS $26 $4 m 1 yrs $I* $10 $212 %7 $11 175 05 18 $21 $374 199 $122 tin IQ Iha tm
r i a
$223 1113 LQ $138 ls M $52 $43 $32 $1 $112 % IO %7 $214 1548 P $12 $21 18 s t 5251 159 $14 $19 110 128 8% $4 $1
W n X a 6dim
&id* US.
CS w
CYM rn CMI 9a&x
Temperate Forest (2955 million ha)
GrasslandslRangelands (3898 m~llton ha)
1
'OornguePm W2 S . $ i d R N c b f l O a s ) Dppxhadyma euhealr(1eee)
F - l W ( t e a 4 )
2 Nol S.$iSRNcb(1sSs) -&
-dd.(tWl)
3 C W F n i ; * u a r 5 a b 6 R N c b ( l W 6 Porss (1994) BB)d
u n a * d . ( l B 1 )
F
- 6 P- (1994)
2--w=- k w k d d d . ( h p e s ) w&wdtfma
Lweiapulhn Jwd.1(1%5)
-
( I S 1 B B ) s J r t w e d (1osa)o w h s a a L ( i s q er?a*(1831) Natnni
5ab&-(lsss) J e . -d = L ( l S a % 7Sd-
( C l s 3 m l a n ) 5 a b h P n e i r ( l P q k r t e d d ( 1 s q r m a a ( 1 P q
9 W . s b . s a i -F
6 ma (1994) -*d (1996)
15- RnarsrdaL(lpas)
I t ~ o n a o i W d d . ( l P q
1 3 - m U S D d d C a m t l l i B n Ndnn
Tidal MushMangroves (165 million ha) T d d U32 W S232
Td* arrh
U Y
-*
HisCmn(1OOJ) WTp USAF-b-&;:z -dd(i9B4 m*
-*
us% UY:MNahw=l
z,
USA USA Lymh=;2 E g us4U ( 1 9 B 4 ua;** VY
EEP -ad (1-q
Prosiding Pelatihan untuk Pelatih, Pengelolean Wileyah Pesisir Terpadu
USA USA USA USA USA T W TQm
Fil
USA
SwampslFloodplains (165 million ha)
USA
16. -R -1
z 2 z ( - l ThBr)au*DBo(lPO~) W + W P USA KVii.ri(lP95) T & d G+4=6Fc&s(tS?Sj W W t P m s M la* Fbms=m
cms;nnsan GRnSS%kqdd(l%a, wrr) m
ra&nOb.t.(18901 wIPh.mnr USA GRnbSc6sWlt1%a, TCIBLvq m Uhag
G R n S ~ l o i r ) T & W *ubtl
s
- (-1
T d e#.!sd a p h ~ F o a a ( ~ ~ IMPmr&tlo USA
-
--
-(190() IMP 0-34p t n r y m
LakeslRivers (200 million ha)
$Po tZY1
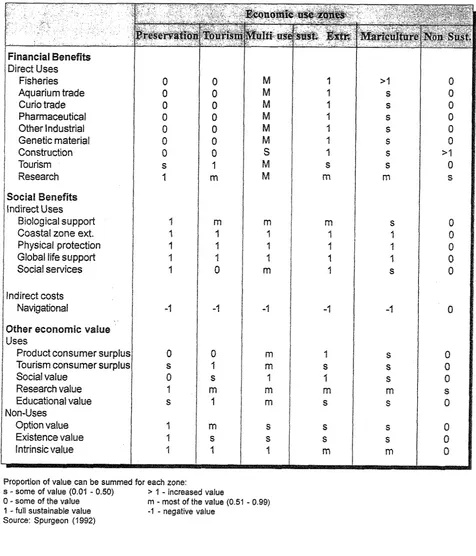
Table 3. Uses of coral reefs and economic use zoning
This illustrates the different proportions of each use and non-use value which could be added together in different reef use zones to give the Total Economic value of a reef system. The relevant proportions for each value are indicated here as multipliers which are further explained in the text
Financial Benefits
Direct Uses Fisheries Aquarium trade Curio trade Pharmaceutical Other lndustial Genetic material Construction Tourism Research
Sociaa Betliefits
indirect Uses Biological support Coastal zone ext. Physical protection Global life support Social services
Indirect costs Navigational
Other economic value
Uses
Product consumer surplus Tourism consumer surplus Social value
Research value Educa~onal value Non-Uses
Option value Existence value Intrinsic value
Proportion of value can be summed for each zone:
s
-
some of value (0.04-
0.50) > 1-
increased value0
-
some of t h e value m-
most of t h e value (0.51-
0.99) [image:18.603.75.551.123.679.2]Valuasi ekonomi sumberdaya ... (1
-
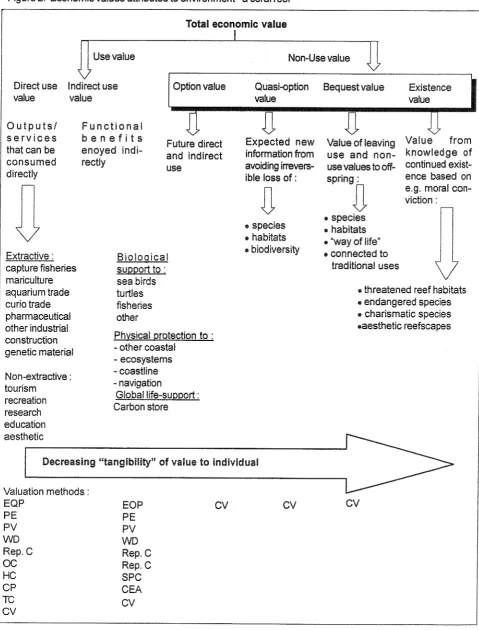
34)Figure 2. Economic values attributed to environment
-
a coral reefTotal economic value
Non-Use value
O u t p u t s / F u n c t i o n a l
i Future direct Expected new Value of leaving Value from
that can be enoyed indi- and indirect infomation fFom use and no"- kmowledge of
consumed rectly
use avoiding imvers- use values to off- continued exist-
directly ible loss of : spring : ence based on
a
a
0
viction : -e.g. moral con-
species
species habitats
habitats "way of life"
Extractive : Bioloaical
.
.
connected tocapture fisheries s u ~ ~ o r t to : traditional uses
mariculture sea birds
aquarium trade turtles threatened reef habitats
curio trade fisheries 6 endangered species
pharmaceutical other charismatic species
other industrial .aesthetic reefscapes
construction Phvsical protection to :
genetic material - other coastal
-
ecosystems Non-extractive :-
coastlinetourism
-
navigationrecreation Global life-support :
research Carbon store
education aesthetic
Decreasing ""tngibiliQn ' o f value to individual
Valuation methods : EQP
PE PV WD Rep. C
OC
HC CP TC CV
EOP CV GV CV
PE PV V\ID Rep. C Rep. C SPC CEA CV
[image:19.595.68.548.63.694.2]Prosicfino Pelafihan untuk Pefatih. PenaefoIaan WIayah Pesisir Terpadu
-
Nilai net contribu~on human capital terhadap produlrtivitas3.Oppclrtami& Cost Amproach (06)
-
Dengan CBA t e n a m net benefitdari
proyek bila positif selmjutnya-
Nilai benefit &xi presenasi-
Bandin- keduanyaD PUS
Barbier, E.B. 1993. Sustainable use of wetlands-valuing tropical wetland benefits. The Geographical Journal 159.
Barton, D.N. 1994. Economic factors and valuation of tropi- cal coastal resources. University of Bergen.
spurge&, J.P.G. 1992. The economic valuation of coral reefs. Marine Pollution Bulletin 24.
Munasinghe, M. and E. Lutz. 1992. Envifonmental eco- nomics and valuation in development decision mak- ing. World Bank Emironmental Working Paper 51.
Dixon, J.A. and 6. Hodgson. 1988. Economic valuation of coastal resource. El Nido Study. Tropical CoatalArea Management 5-7.
Tabel 4. Proiect Level Valuation Methods (adapted from Dixon (1 988))
1. Using conventional market value of goods and services directly affected
( i ) Change-in-productivity approacEflect on production (EOP)
( i i ) Loss-of eamingWuman capital approach (HC)
(iii) Opportunify cost approach (OC)
2. Using the value of direct expenditures (cost based)
(i) Cost-effectiveness analysis (CEA)
( i i ) Preventive expenditure (PE) (iii) Compensation payments (CP)
1. Using implicit or surrogate-market values- indirecf approaches
(i) Property-value and other land-value ap proaches (PV)
(ii) Wags-differential approaches (WD) (iii) Travel-cost approaches (TC)
(iv) Marketed goods as environmental surro gates (ES)
2. Using the magnitude of potential expendi tures (cost based)
(ij Replacement costs (Rep. C ) ( i i ) Relocation costs (Rel. C) (iii) Shadow-product costs (SPC)
Contingent Valuation (CY-hypothetical markets 1. Energy theory of value-energy-analysis (€A)
and situations
(i) Bidding games
( i i ) Take-if or leave-it experiments
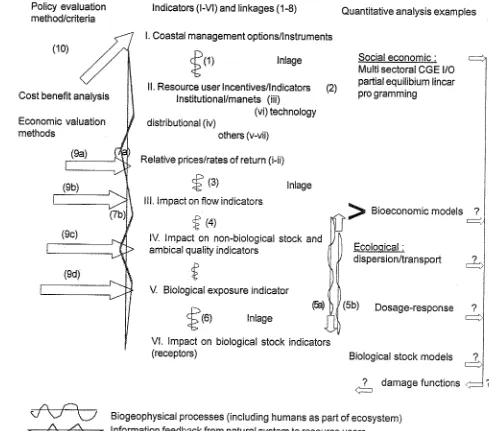
[image:20.601.76.546.282.646.2]Tabel 5. Integrated quantitative analysis and information flows
Policy evaluation methwriteda
ECONOMIC and ECOLOGICAL SYSTEMS interaction
lndicato~s (I-VI) and linkages (1-8)
Cost benefit analysis
Economic valuation methods
fl
1. Coastal management options/lnstrumentsQuantitative analysis examples
lnlage Social economic :
Multi sectoral CGE IlO padial equilibium linear
I!. Resource user lncentivedndicators (2) programming Institutional/manets (iii)
1 (vi) technology distributional (iv)
others (v-vii)
Relative pnceslrates of return (i-iij
i l l . lmpact on flow indicators
$
(4)>
Bioe~~nomic models ?
i--.
I
IV. lmpact on non-biological stock and
ambical quality indicators Ecoloaical :
3 dispersionltranspolt
$
V. Biological exposure indicator
I
(5b) Dosage-response ?
lnlage 0
VI, lmpact on biological stock indicators
(receptors) Biological stock models 7
d
damage fundions 7
~
Biogeophysicai processes (including humans as part of ecosystem) Information feedback from natural system to resource users
information flow from system indicators to quantitative analyses/models
[image:21.595.53.542.132.563.2]Prosiding Pelatihan untuk Pelatih, Pewlolaan Wlayah Pesisir Terpadu
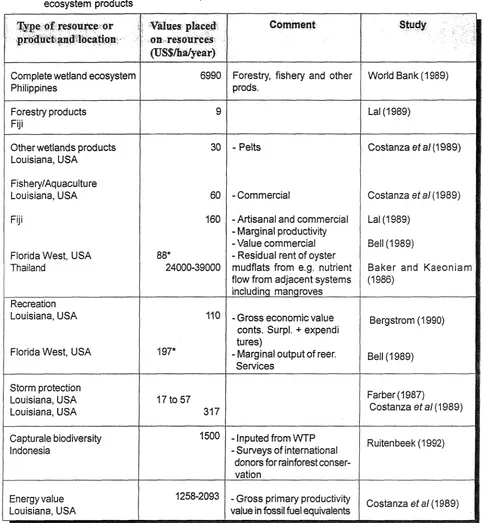
Table 6. Recent examples of economic values placed on tropical / sub-tropical wetland systems and wetland ecosystem products
Q p e OF ressurcebor Vdues placed Comment Study
proGucti.md40cagon. on resources
Complete wetland ecosystem Philippines
Forestry fishery and other
I
Wodd Bank (1 989)prods.
Forestry products Fiji
Other wetlands products Louisiana, USA
FisheryIAquaculture Louisiana, USA
Fiji
Florida West, USA Thailand
Recreation Louisiana, USA
Florida West. USA
30
-
Pelts-
Commercial-
Artisanal and comrnercial-
Marginal productivity -Value commercial-
Residual rent of oyster mudflats from e.g. nutrient flow from adjacent systems including mangroves-
Gross economic value conts. Surpl. + expendi tu res)-
Marginal output of reer. SewicesCostanza ef al(1989)
Costanza e f a1 (1 989)
Baker and Kaeonian (1 9%)
Bergstrom (1 990)
Storm protection Louisiana, USA Louisiana, USA
Farber (1 987)
Costanza et a1 (1 989)
Capturale biodiversity Indonesia
7500
-
lnputed from VVTPRuitenbeek (1 992)
-Surveys of international donors for rainforest conser- vation
Energy value Louisiana, USA
-
Gross primary productivityvalue in fossil fuel equivalents Costanza et a1 (1 989)
[image:22.603.74.557.80.603.2]GIS and
the
Value
of Everything
scar Wilde w o t e that a cynic is " a man who knows the price of
value of nothing. "S
scientists, econormists
and
even geographers have attempted to put a price tag on the planet's ecosys-tem goods md sewices (Co (1 997) notes, these ac
selves. They realize
that
the true value ofecologieal life-supprt systems is, in oply put, h m a n i v wou1dnY
However, the scientists also believe that it's tive to list the replaceme
system services
that
areporting E d ' s flora and fauna. How did they at- tempt such a Herculean effort ?
PuQthg a Price ora Natural Systems
ghow these scientists went about their work provides GIS professionals a methsdoloa for pricing the natural systems that might be damaged by building a Gghway through a national park, for exarnp1e. This wodd
be
vital informationin any cost- benefit analysis.The scientists first step involved determining which of the main ecosystem goods and services they would evaluate (Daily, 1997). Tiley identified 17 major categories including gas, climate and wa- ter regulation; disturbance regulation (e.g., amelio- rating the effects of floods and other extreme envi- romental events); water supply; erosion control
and
s e h e n t retention; soil formation; nutrient cycling; waste treatment; p b t i o n ; bioIo@cal contpols (e.g., prey/predator dynamics); habitat rehgia for tran- sient
and
other populations; food and raw material production; genetic resources; recreation resources; and cultural resources (the aesthetic, artistic, edu- cational, spiritual and scientsc value of ecosystems). Sixteen primary biomes or ecosystem types were identified. These werethen
split into marine and terrestrial ecosystems. In tum, the marine sys- tems were divided into open ocean and four coastal categories: estuaries, sea grasdalgae beds, coral reefs and continental shelf areas. The terrestrial sys- tems consisted of two forest systems tropical and temperateboreal) grass or rangelands, two types of wetlands (tidal marsh/mangroves and swamps1), lakeslrivers, desert, tundra, icelrock,
Relvina on extensive previous research,
figme was expressed in U.S. dollars per hectare per year. The only task that remained was to multiply the value per hectare by the nurnber of hectares. The dataset table in spreadsheet format and copi- ous me tho dolor;^ notes may be downIoaded from
Nature i o u a l ' s World Wide Web site at http:11' m~t:mture.com (users must register to .gain access to the site).
Pad Sutton, one of the article's co-authors an a geogapher &om the National Center for Geo- graphic infomation
and
sis at the universiw of C a o m i a at Smta Barbara, ~ o m e d me he used a GIS to produce the article's world map of ecosys- tem services. GIS also might be used to deternine the area of each biome, although it wasn't used in this study.Sutton told me even more accurate estimates might be made if NASA's land cover dataset were used. This dataset is being developed as part of
the
International Geosphere Biosphere Program. It appears that future ecosystem valuations will rely more on GIs datasets and analysis.
Why Did They Do Ht ?
The authors note that this type of exercise, although fraught with difficulties, helps to establish upper and lower limits on ecosystem's value. These limits were detemined to be US$54 trillion and US$16 trillion per annun, respectively. In adcSition, the exercise assesses the relative magnitude of eco- system services, which
-
if a middle range estimate of US$33 trillion is used-
are about 1.8 times the current global Gross National Product. The research establishes a framework for fbture studies of this kind, just as Costanza and his colleagues built onthe
work of Daily (1 997) and Pearce (1 993), among others. Finally, the study shows where more work is needed and is provocative enough to stimulateer research and debate.
Pelatihan untuk Pelatih, Pengelolaen WiIayah Pesisir Terpadu
tundra
and
iee/rock biomes. Such huge areas as the htarctic presurrmably are yet to be included inthe
analysis. Perhaps ongoing research conducted at the Uiversity of Calgary will pmGdebetter
mod- els of htaretica's role in proG&g v d o w ecosgrs-tern services (Giovinetto, 1990). In addi~on, s believe
that
more eeo-nsidered
and
tIrat
more realistic representahon of emsystem d y n ~ c s an$s
vvlll
help to increase the x c m yA
Bargah at Any P ~ e eEcologists and economists now pay more attention to the worth of ecosystem services. They
realize, to quote Wide again, that "no man is rich enou@ to buy back his past". Once destroye4 the services that ecosystems provided may become priceless.
REFENNGES
, R., et al. 1997. The Value of the World's Eco- system Services and natural Capital. Nature, VoI. 387 :
253
-
260.Daily, G., ed. 1997. Naturek Services : Societal Depen-
dence on Natural Ecosystems. Island Press, Wash-
ington, D.C.
Giovinetto, M.B., et al. 1990. Dependence of Antarctic Surface Mass Balance on Temperature, Elevation and Distance to Open Ocean. Journal of Geophysical re- search anddhospheres, Vol. 95 (D4) : 3,517- 3,53 1. Pearce, D. W. 1993. Economic Values and the Natural
World. B43T Press, Cambridge, Mass.
Pimm, S.L. 1997. The Value ofEve
Valuasi ekonorni surnberdaya. .. .. . . (1
-
34)Notes
to
Tab
m many key h'unc6ons, h m regula~ng the biosphere to the prmessing of clernents into countIess configurations of food webs, sdirnents, and water
column
forms.
We
havefocused
here
ona
subset of important functions to which we felt some value could or should be assigned.These
include the development of food webs teading to h m ~ a b l e food and haw materials, n u h a t cybng,and
b e role the weain playsin
regula~nggas exchanges ~ t h the atmosphere. Where possible, we ~ e d to pmGde
a
range of value eshates, recognikg that diEcnnt sets of assumptions can result in wide divergence in tbe assignhg of value.For
food
and raw mate~als production, market values were determind fimthe
best
avaaabk
haes,For
biogwhedeal flues,we
attempted to computc rcplacment valuesif
thc naturalwere
no longer able to supply the particula service. Finally, we used estimates of real egate price di onic pnicing)as
a surrogate for rhe service that m a ~ n e ecosystems perFomin
chancing the cultural fabic of society.Some important values are m r e difficult to q m ~ f y than even the difficuIt evaluations
we
did cany out, 2nd far this reason were left out of the cunent an;iIysis.This
iaduda fiegszsmennt
of value of bidiversigy as such and the services of higher trophic tevcls as controllersand
amplifiers of tcosystcrn processes. Many of these services simply have no convenient economic analog (cg., what is the repiacemcnt value of a species, ora
spceies assemblage? surely it depcnds on the species and the lage). While achowledging hat these services L K ~ :probably important, we IeR them out for now.
Open
Oceans
1. Gas Rceulation
Occans play a critical rote in the balance of global gas regulation. Oygen
md
mbQn cyctes are inthatelyE ~ e d ,
as are N,
P,
and S cycles. We focused on the roleof
the meaas as (1) a sink for 602, since fersof
@02 $0 theatmosphere result in increases in greenhouse warning, and (2) a producer of methane,
a
secondw geenhouse gas.A. Two estimates of
CO?
-
abso~tion bv the worid's weans:I ) Schlesingcr (1991) esiimatcd oct norage of organic C in marine sdimeots at ea.
0.1
x 10IS gC
y-l,
which=
0.366 x g C02 pl
2) Butcher ct ai. (1992) discuss a simple model of Lhe global carbon cycle, in whicln the
mt
input ofG
to theoceans from the atmosphere is 1
x
1016 mol which = 44 x 10j6 g C 0 2 -j-l.Obviously thcrc is a largc discrepancy betwec~ tllcsc estimates. On page 309 of Schlcsingcr, net inputs o l e to the oceans is 2.4 x l0l5 g C y-l. and the amosphuic pool is 720 x 1015 g
C.
Thus. if the occan wereto
cease absorbing the net mount of C, itwould
take 300 yr to double theC pool
in
rhc ahospberc, which would leadto
an increase of 3 'C. Fankhauar and Pearce (1994) estimatedthe
economic cost of C02 as 120.4 perMT
carbon. Using the most and least consemalive estimates of net removal of 602 as C in marine sedlmesnts, we aAve at:a) 0.1 n
c
y-l = 100x
106MT
y-l 132200 x 106 ha=
0.003 MTc
h r ly-f
0.003 MT C ha- l y-1 x 120.4 MT-I=
$0.6 1 ha-l ymlb) I x
1016
molc
y-l=
12x
~ O ~ ~ M T C ~ - ~ 132200 x 106 ha= 3.73M T C ~ T ]
pl
3.73
MT
C ha-l y-l x 520.4 MT-I=
$76 ham1 y-11 1
The average of this low and high estimate is $38.3 &a'
y"
B. Methanoeenesis bv the world's oceans8.
N u t ~ e n t
cvelins.
Oce2ns arc cridal in nainaining global nutrient cycles, Here wc fmus only on nitrogcn @) and gRosphomus
(PI,
the major "macronu~ents". While we roco@ze that other macroou~ent cycles (eg. sulphur, a host of micronutrimts are also important, we have ignored &ern in Ihe c u m t study, irn
cstimarc. The valuc of thc weans for gtobrrl N and P cycling d & v s from their role as N aad
P
sinks, lf the weans were not therc, we would bave to reereate this &action by rernoGngN
sndP
&m land rum@ and recycling it back to the land. We tod: two appraacbes to evaluating this hnclion.W cd ~t thc weans and coastat watc aB1 the woddk swa=tthat Row from rivers, and rcceihs h n e watm proGdc a
.
If we a s m e that roughIy onethird of this sehvice is provided by e s t d e s Wixon 1896 in press) inder by coastal and open mean,12 3 1
(assume I 0 by shelf and
IO
by ocean), then the total quantity of water treat& is 40 x 10 m y".
Replament costs to rmoveM
andP
were esthatsd at $0.15-
0.42 m3 W c M 1991 as quoted in Postel andthe replacement cost for each biornek (ID) con~budoa to the total vdue is $2.0 x 10¹²
-
the value for ocean (32200 x 106 ba) is theo SQZI
-
174 ~ c I yolaI I. Biolokcal antrot
See data (Note 13, Mow) on & s t h t e s of fish production. We assutned b i t the contro1 h c t i o n of uppcr gop&c levels is at least 30% of the value of the satch (tvm thou& the prsdudon fn those WpMc ltvels is 3-5 h e s the catch) (Source: R. D'Arge* pemnal comunicmtioa), yielding an e s t h t e of $5 hae1
r1
1
3.
Food ~roduction
The following table summarizes data on globat fish production, catch and psoten~al catch for
troth
upwelling and open wean areas.Ecosystem Area Pr,Prod Fish Prod. Fish &tch Potcntiai Catch (108 ha)
05
c
me2 y-I) m a y-l) m-2 y-1) (g a$ y-l)@T
ha-1(1 988-89)
Upwdling 5 22'5 23 2 3.54" 4.97 0.8497
Oceanic 332 57 2.46' 0156 0.59 0.0059
Source: Houde and Rutherford 1993 (except fa fwtnotes).
These numbers are probably as good as we can get, and are probably gwithin a factor of 5. Average 1993 price, calcula;ed &om imporls and exports of total m&ne fish catches @y continent) is $2.28 (* $1.18 s.d.1 (FAOSTAS Database Calleftions (on W W ) . The value of fish cafdrw. in S ha-lyl, is assumed to be the average price h c s the quantiv (see main text for a discussion of this aswption). Thus for the total potmial catches in these biomes, the valuc is:
-
1.Also not given by Houdc and Rutherford. I used the catch values providcd in Table 1 in Pauly and Christensen for total catch in 1988 and divided that by the shelf area given in Houde and Rutherford (which is 6 times the area of shelf determined by Pauly and Christensen, 1995).2
. .This number is likely to be a gross underestimate of ocean fish production, since it assumes production 2.5 trophic Ievets beyond primary producers. Most of the open ocean fish biomass is not comercitffly harvested and is composed of secondary consumers (c.g., myctophiids). If one follows the calculations of Woudc and Ruacrford
I
. .. -
---
-
kosysiern Am Potential Grrtch Value (ErlT x $22801MT)
(I
oB
ha) rnm2 y-lMT
yl
I
ba-I
y-l
Upwlling 5
4.97
0.0497 513
Ocanic 332 0.59 0,0058
.L%i
h a weight& average ( u p d l + open) SB5
9
4.
Raw
materials
Gnsidening only one product, i.e. the fornation of limestone In shallow ocean basins (and then "spreading" it out ovcr the entire ocean Floor):
Estimate #I. Source: Holland 1978: 0.5 rng crnm2 y f l = 5 g me2 yf']
(from
8 sbdy by Broecker and Takabashi1966 on Bahma Grand Ba&)
Estimate #2. Source: Sehlminger 1991. 1.5 x 10
IS g
y-1 (taken from Wolla 1981 .) dividrd by the area of ocean =12 2
332 x 10 m = 4.52 m-2
y-I
.
These h a t e s are roughly equivalent to 0.05 MT h-I The m d e t price of limestone (f.o.b., determid by telephone intmiews with quarry managen) is spproxhately 610 If m a e W 84% of the price covers capital and labor costs, &en the ecosystem "valuc add&" mom! is woah $1.50 wI* The @that& value of oceans
for
limestone prodvctioo is: 0.05 MT hav1 y-l x $1 -60 MTI = $0.08 hn-Ir1
.
17.
Cultural Values
A s reflected
in
literature, song, dueation, and other ways, h place trmendous value on ,nodines and oceans. One bngibfe economic manifestation of the cuItural value placed on these ecosystem is he willingness to pay for real. cstate in pmxkiQ to m a p i e s and ocm, cornpard to the price of comparablysized
inlmd real estate (all other things being quai), Price digcrentials between inland and watwfront propertis in a rich md a poor partof the United States were cdleetd. We Ihen wsumed that this differential wwId be valid for the world"s wealthy
nations (develop&) and would be 100 t h c s lower in thc remaiader of the world"s nations. California: $0.5 x / 0.046 ba = S I0.8 x 106 ha"l
Alabama: $0.1 x 10⁶ 10.186 ha = 50.54 x 1 ha-I Coastline: ""Developed"". 194$35 km
"Undeveloped": 284,795 km
Assume that the value extends
from
the shorelirae and back 0.5km
from shore. Then the area of real estate is Devdoped 9.7 x lo6ha
Undevel. 14.2 x lo6 ha
.
Using the spread in real estate price differentials above, and assuming prices are 100 times less on undeveloped lands, we obtain
Develop& values (total): $5.24 to $105
x
1012Total vatuc: $5.32 ao 105.2 x 10¹²
Prosiding Pelanban untuk Felatih, Pengelolaan Witayah<, Pesisif Terpadu
Estu e and mitsbla cnhment conditions for m y owl activities rad &a rnaintmce of the natural qualitis of the m Is rr W m d ~ a ~Wdvettess ~ O C W of
thGSG
1
n,b.
This &W not given incrtcbw
(fix
1988) tist& undw andcotrl syrtems, lardchid fVafuasi ekonomi sumbenfaya ... ( 9
-
34)rccrcational activities. The most common actiitia m: boating, G n d ~ f i n g , sflshin&
hunting and shore-beach rmreation. dc
Omol(1992)
s t h a t e d tbc to&l valueof
thae
activiticr st $195-
$567 ha-B
1y--l, w l an average
of
5381 ha- y'17.
Cultural
Many estuarioe areas are important sour- of histo~e information as well
as
sien6fiic and&de
Wies. de G m i1 I
(1992) crtimated the total value ofthesc activities at $25
-
$34 ba-I f'l9with
an avaagc of a9 ha- y-SeagrasslAlgae
Beds
8. Nutrient cycling
For calculation methods, see notes for Ocean &m = 200 x lo6 ha, value= S10,MIO
-
28,000 ha-Iyl*
1
1.
Biological
Control
Not
estimated, but probably considerable value.12.
WabitatlRefuyia
Not estimated, but probably considerable value.
13.
Food Production
Not estimated, but probably considerable value.
f
4.
Raw
maten'als
Norse (1993) states that scawads, agar. and earagecnans
an
wonh
5400M
y-l Dividingthis
byana
ofscagmsfalgae bcds (see note 8 above), we obtain f 2 ha-I y-l
.
Coral
reefs
General
Coral reefs are highIy productive, diverse and attractive ecosys(ems producing
a
wide rmge of valuable g& and services. From the studies that were found, the services of dimrbance renulationand
re~reatbn were particulaiywell quantified. Food pmduetion eonstikes another impomnt and beoefit
from
ooml iafs. ~h;diversity of the additional values is only an indication that there are many
goods
mind scwices still unqllilntified,such as medicins and research and education,
Continental Shelves
1
B
See notes for Ocean far assumptions. Area = 2660 x ha. Value= $752-
2,110 ha-y
1.1.
Biological Control
See data Wote 13, below) on estimates of fish production, and notes for Ocean for assumptions.
Ecosystem Area Prduction Value
Prosiding Pelatihan untuk Pelatih, Pengebiaan Mqlayah Pesisir Terpadu
1
3.
Food ~roduetion
Scc notcs for Ocmn for mefhOds and further details
Et'osystm Area Pr.Prd Fish
Prod.
Fishealch
Potential Catch2 1
0 0 8 ha) (g
c
rn-* y-i) (g m-2 y-1) (em-
yo ) (g m'2 y-1)(MT
ha-1yl)
(1 988-89)
Shelves 23 162 15.5 0.174 2.98 0.0288
Source: Noudc and Rutherford 1993.
Ecosyslcrn Area Pdential Qtch Value x $2280Ma>
(1
o8
ha) g m-2 y"lMT
ha-1
y-ls
ha-I y-lShelves 23 2.98 0.0298 S 68
Terrestrial
Systems
Terremial systems provibe a large number of senicer, but valuation studies have examined these &cer unevsdy. Little economic infomtion was available for the valuatbn of soil formarion, waste treatnnenl, gas regulation, biological control, pollination, or refugia, thougin :it is clear that lEtw systems c o n ~ b u t e signifimtly to these processes as well. Much of these contibutions that we lack infmation for, however, are included in lager scale studies and are included in the taily for total, global ecosystem s e ~ c e s .
General
Forests have obvious direct use values, as a source of many hasvatable products, rangng from timber to food and drug prducts. Tbey have a more indirect value by providing a v ~ e t y of ecosystem
*a*;,. ,.,,?a
:..
A ,..... *-*:-- -,.:-r-qt :--*-a---
--.-a*-auru IVL\, I I I V U C L ( I L A U ~ I Q L U ~ Q U ~ l l ~ p a ~ Q U ~ watw bbmflstfofq they edanee geophysicahtabiiity, rediucing erosion
of soils. Excessive erosion would not only interfere k t h aquatic prwesses but w u l d reduce soil fertility itself and impede normal n u ~ e n t and hydrologic cycling. They provide valuable sir p ~ f i c a t i o n h n c ~ o n s , r m o h g lead and other potential toxins from the amosphere. Forests prote~t against pest infestations and help assure quality water supplies, Trees art h p o m t in water storage processes stodng water themselves, plafing a critical role in
evapotpansphtion, and providing pathways for water retention in subsurface reservoirs. The result is a more reliable a d constant flow of water downstrm, reductions
in
peak f l d i n g events and a larger average stock of available water supplies. They provide hpoflmt climate r~gulation services fiom Iocal to global scales, These services are a result of transpiration processes, albedo and roughness effects, sad cabon cycling. Local rainfall can be reduced as a result of deforestation, since water storage and evapotranspiration are dhinjshed, Forests serve toprotect against storm damages, acting as .Kindbreaks and creating roughness effects in diminishing storm intensities, Global warning potential from deficiencies in carbon sequestration capacig is well known, Forests provide option values associated with support of species and genetic diversity, They also have broader cultural values through their importance in folklore and broad cultural support.
Valuation of services of forests must take the types of service flows, such as timber and clim& regulation, and assign monetary values to them. These monetary values can be of two basic types: benefits received or costs avoided by provided equivalent services in another manner. For example, the benefits received margiaa'l value
of
timber would equal stumpage values; i.e,, market prices of timber net of harvest costs. The costs avoided marginal value of timber would be cost savings from using timber rather than other structunl materiais. .In well hnctioning
markets, these two valuations would be approximately similar at the margin. Climate regulation values, for which Hy
Valuasi ekonomi sumberdaya ... . (7 - 34)
prices or darnage wsts avoidcd, such as health costs. AlternaGveliy, costs avoided valuation wtxrld include the cost
saving from not having to control carban dioxide mi&ons in In well
fuoaioning
mleli policy maws, thcsc two valuatioos wouldk
appmxhatcIys
likely than the rnrnpfions for well functionirog mwkets
for
m cn is cmidwbIe d e b g a ~whether
the benefits of climate conmi e x e d the costs of conml. As with other ccosystcm the scrviccs and vaba Branl nuts are barvested in Brazili forests but oot inMa&
i m p a n t function in Mexico but not equally so in at! forest& Iocalions. Furthermore, valmtion may diRer significantly, depending upon supply and d m m d conditions and incomes. Spatial g
valuation results is inherently problematic (Pearce and Moran, 1994).
Servl;ccs of ecosptems are flows s t e m k g fm the nanKal capital stock. Iherefm, inhcrent "sustainability'hrnotation. Keeping with this hpiicaGon,
wets
of wsy*m c"sustainable basis. Forests have value for their sustainable flow of h b c s raw mtedal, food prsducts,
squdntion, erosion contml, ctc. It is highly debatable whether existing flows dmcts, p
sustainable. We have atrempted lo use estimates of susbinable d c c s flows in estimating
below.
2.
Climate Repulatio~
Estimates for the c t h t e rmlation value of forests wcrc based targely on avenge damage a v o i w cast studies (e.g., Lsmpietti and Dixon 1995) or avoided Gosts of alternative cootrols (e.g., -illa f 391). Thcst studies typically cstimatc the cubon -sage capacity t b t
would
bc
lost under various forms of forest d ~ a d a t i o n , relate that to fume damagcs or eumnt casts avoid&.SO.
forest cmvcfsion to otha land u q such as a g r i c u f ~or psture, rcleascs a flux of c a h n during eonvcrsioa and reduces glob1 carbon storage capasib.
For
Adgcr, et aP. (2995) estimated the avoided climate related damages from fosxls of l o w s in Mesco a
hectare ger year. Indexing to $1996 resuIts in an csthted damage cost savings of 570 p a hectare pa year. h t i l l a (1991) estimated the costs of alternative controls from fort% loss at SC42N per hectare, h p w g an annualit& value of $336 (usiog 8%) whcn indcxcd up to $1996. A su of studies of trogical forests suggest
hi@ and low vafucs of $482 and $88 per hedare per year, respectively,
with
an avcmge of $223 pw h ycar.Tficsc are partial va!uations in scvcral ways. M i l e carbn scqucstration in forcsts would be proportiionate to forest biomrtss, increasing loss of forests may alter otha msystems so dramatically as to change their fundon in thc carbon cycle. For example, forest loss may alter temperature reglrnes and mean t e m p t m , change
tfic
carbon cycling value of oceans. Secondly, damagcs from reductions in carbonscquesmtion
capacity may be higfily non-linear, perhaps with damages increases more than proportional to forest loss. Finally, even if damages were proportional to forest loss, the value of those damages may not be propoltiooal. For ple, global temperature may be liacarly reiatd to forest loss, and crop yields linearly rclatd to temperature. However, the economic mfue of crop toss may be more than proportional to that crop loss. In other words, there may be g d reasons to expect that the marginal valuc of forests for climate control may increase ~ 4 t h forest loss. If so, the marginal valuation methods used here may dramatically underestimte the economic value of total forest climate controI services.3.
Disturbance Reyulation
Disturbance regula~on services were based on a damage-avoid& cost study of Cmeroon tropical forests
(Lampietti and Dixon 1995).
4.
Water Renulation
Water regulation value estimates were based on damage costs incmcd when deforestation leads to reduction in water qualify or fisheries prduction (Adger eta/, 1995, mum^ 1995, Kramer eta/, 19921, or on damages avoided by forest preservation.
Only one study was uscd for esthates of water supply m i c e (Kumari 1995) based on market values of water lost to reduced quality created by .deforestation.
6. Erosion
Control
Erosion control services of forests refer to soil retention functions. Forest loss would result
in
increased siltation of streams and dms. Degradation in strmm quality would impede fishing and recreational activities, whileinstalling scdimcnt mpping Jcviccs. Both valuation m&&s have bccln
ustd.
For cxamplc, Cbmitz and Kumd(1995) estimated the avoided costs of altcmatiitive conMs to be worth
$54
pet hcclarc ia Ecuadorian q i c a t Adgcr eta/ (1995) estimate damages avoid& to be w d only $0.04 pcrh
~
perc
year, white Dkoaan
Wodgson (1992) cstimted d n e effects of w f f o a fishing and toudsnr hmcts, These valuations were indexed to global incomes pcr capia using the Purchasirig Powch of GNPpw
QpikHi&
and lowv a l ~
were$&I
and SO per beetarcp
r
year for tropical forests, respectively, wftb an average value of $1 85 per hcctiu;~ pet year,13.
Fmd
Production
Fortse production of f d producls was cstimtcd as an average for the production of bits, nuts, game, and swidden aMculture from several trogical forests of Asi d South Amcn'ca (eg, b p i
1995, Kunrari 1995, Pinedcz-Vasquez eta!, 19923. These a t 4 gross incomw in %me incomes, the conect measure, in other cases. In wme ea les were asked
their
willithese services &ietti and Dixon, 1935). These arc h e f i t s type m a w , and & atot reflect the costs of
%king alternative fd sources in the absence of forests. Tbtst valua wcre scald to global i n c a t s using the Purchasing Power adjument. Food p d u c t s il1usb;ate the valuation prcbluns. For market baed cuItures, net
incomes reasonably reflect the value of food products. Nowevever, 'for mbsistence cultur-es, f& prcrducts m y
have an infinite consumer surplus, since burnan existence is the h e f i t . atiltcnra~ve costs of f d supplies could be used to estimate valucs in these eascs, but nooe of wee &Milable, Furthmoac, produets an unique to ~6osystcms. Even if there is a gencrdfy ct, such as Brau'l nuts, abated to be worth
nea~ty $1100 per hectare (Mori, 19921, one cannd gcnmlizc &is value &om tbe B r a i a n foresis. For 1%
while the hmesting of wiId fruit and latex h Ptnzvian Anromok is
ed
to be wo& o v a 516000 per h-e (Peters eta/, 1%9), this is not very gmemlizable. These ham& ualm must dGduct kmat costs to obhin netforest contribution.
14.
Raw Maten'als
The valuation of forest raw materials indudes values of atrattables, inelding timber and Don timber forcst prohtucts. The goal was lo estimate these mateGI flows on a sust;linable yield basis, since &at would represcat the service flows from ecosystem capital. fQowever* there was no agmpt made to determine whether current flows of materials are sustainable. They arc most l%eIy non sustainable, implying that cunent flow valuations inflate sustained yield valuations. W i l e the propcr measwe of value
k
net of h m & cost, the vdues of extmctables somethcs were estimatd net of hahvesl costs and in other caws were not. Timber vaIues were estimated from global value of production, adjusted for average harvest costs. Avcragc harvest costs were s m e dto be 20% of revenues ( S b m a , 1992). This value was used for all forests, btb temperate and tropicd.
.j
5,
Genetic Resources
Genetic resource vatue includes the present and future value of fauna and flora far medicinal p u p s e s , Present values would reflect the "'in situ" value of currently uscd drugs, net of processing and development costs. Future values would be a form of option value. For example, the pharmaceutical fm Mack has paid Cost am's National Institute of Biodiversity $1 milfion for rights to develop future plant species. In principle, this value would reflect the minimum cxpccted net pr~fits Merck would anticipate fom future devclopmeot, The net social value may be considerably larger, reflecting the social value of cures for dim% which is liltely to be much greater &an
Merck's profits. Most of the studies s t h a t e d the market value of phamceuticals dcrlvd from h p i d foresb. The correct measure of value is market value net of costs of bringing tbt
aaw
materials to fhek markebbfe, mcdicinaf fom. Unfortunately, the cost adjustments could not be made. W e n drug sales in the US werethe
basis6br
an estimate, the US valuc was cxtrapotalcd globally by assuming lhat citizens of dcvelopcd countries in E q c , Australia, Ncw Zcaland, and Japan would purchase the m e value of drugs per capita. This acknowledges an inconic effcct in the demand for drugs, and a wcakncss of economic mluation. f e r m s of low income may place high valucs on life saving and enhancing drugs, but these valucs would not be reflected in the mrket place. For this reason, the genetic valuation may severely underrepresent the social value of genetic services.f
6.
Recreation
Recreation vaiue estimates were based ola various methods in differcot country settings, including brave1 cost mcthds (Lampietli and Dixon, 1995) and contingent valuation methods (Kramer et a1. ,1992 and S h m a
,
1992). Thcsc arc proper methods of measurement for this value. Genemlizability is an obvious problem for recreation values, depending both on the quality of the forests and proximity to demanding populations. The c m n t recreation value of many forcsts may be ncar zero. Estimated generalized forest values may reflect potential value,
Valuasi ekonomi sumbenlaya ... ( I - 34)
17.
Cuitural
Values for cultural services were bas& on shrdics of aggregate willingnesscs to pay, phmarily for cxis~ence values of ecosys!tc-ms or endangered species in the US (c.g., Pope and Jones 1990). These values
are
very likely lo depend upon income levels of the culture in question. So they have been adjusted to w o r l d ~ d e vatu=using the Purchasing Power of GNP per Gpita.
General
We calculated the net rent for grassland and h b l a n d worldwide at 151.04 ha-' yf'. This value is a
weighted average of the net rent of those USA states for which the "potential" vegetaGon was ~ I a n d or shrubland (Kuchler, 1964)
(KS,
IA,klT,
ND,
NV,
UT, AR,NM,
TX,
OK,NE, SD,
MOP U, M,CO).
Data were obbined from the Census of Agriculture 1992WS
Dept, of Commerce, 1 995).1.
Gas
reeulation
We made indewndent estimates of this service for carbon dioxide, nitrous oxide, and methane.
a. n dioxide: We used estimates of C losses ated with a@cuItural use h m grassland mils
across the Great Plains of USA from Burke eta( (1989).
C
losses ranged horn 0.8 to 2 kg me2.
We uwd a value of I kg m-2 in our calculations. We multiplied this numbcr by the cost