EFFECTS OF SOIL MOISTURE CONTENT ON
ELECTRICAL RESISTIVITY TOMOGRAPHY VALUES
SURVEY IN IRRIGATION PADDY FIELD, TANJONG
KARANG, MALAYSIA
NURMALA SARI
GRADUATE SCHOOL
BOGOR AGRICULTURAL UNIVERSITY BOGOR
DECLARATION OF THESIS AND
INFORMATION SOURCES AND PATENT
I hereby declare that this thesis entitled ―Effects of Soil Moisture Content on
Electrical Resistivity Tomography Values Survey in Irrigation Paddy Field,
Tanjong Karang, Malaysia‖ is based on my original work, under supervision of Dr Ir Prastowo, MEng and Dr Ir Yuli Suharnoto, MEng, except for quotations and citations which have been duly acknowledged. I also declared that this thesis has been submitted for master degree at SupAgro – Montpellier, France, as qualification to obtain Master Degree in Double Degree Indonesia – Prancis (DDIP) Program 2013-2014, under supervision of Gilles Belaud and Jean Stéphane Bailly.
I delegate the patent of this thesis to Bogor Agricultural University and SupAgro – Montpellier, France.
Bogor, February 2015
Nurmala Sari
RINGKASAN
NURMALA SARI. Pengaruh Kelembaban Tanah Terhadap Nilai Resistivitas Elektrik Tomografi Pada Pengamatan Areal Sawah Tanjong Karang, Malaysia. Dibimbing oleh PRASTOWO, YULI SUHARNOTO, GILLES BELAUD, JEAN STÉPHANE BAILLY dan MOHAMMED AZWAN MOHAMMED ZAWAWI.
Survey resistivity elektrik tomografi (ERT) telah dilakukan pada area irigasi padi di Tanjong Karang, Malaysia sebagai salah satu survey untuk pencarian akuifer air bawah tanah. Akuifer air bawah tanah ini diharapkan dapat menjadi sumberdaya air alternatif untuk irigasi padi di samping penggunaan sumber air permukaan. Berdasarkan hasil yang didapat dari survey ERT yang telah dilakukan, sistem irigasi yang diartikan dengan kondisi kelembaban tanah disinyalir memberikan pengaruh terhadap nilai resistivitas elektrik dan juga terhadap profil lapisan tanah yang dihasilkan dari survey ERT. Tujuan dari penelitian ini yaitu untuk membuktikan adanya keterkaitan antara kelembaban tanah dengan nilai resistivitas elektrik dan untuk menentukan level kelembaban tanah yang tepat untuk dilakukannya survey ERT.
Survey ERT dilakukan dengan menggunakan alat survey ABEM Terrameter SAS 4000 dengan susunan elektroda Wenner – Schlumberger. Jarak antara elektroda untuk kabel bagian dalam dan kabel bagian luar masing – masing adalah 5.0 meter dan 10.0 meter. Profil lapisan bawah tanah yang dihasilkan dari analisis ERT memperlihatkan bahwa kelembaban tanah mempengaruhi nilai resistivitas elektrik. Dari beberapa kondisi kelembaban tanah yang berada pada rentang 16.96% hingga 27.50%, nilai resistivitas elektrik menurun pada beberapa titik dan pada kedalaman tertentu seiring dengan meningkatnya kelembaban tanah. Ini dibuktikan dengan uji analisis Anova dan Duncan yang memberikan nilai Pr > F sebesar < 0.0001 yang menunjukkan bahwa nilai kelembaban tanah berpengaruh signifikan terhadap nilai resistivitas elektrik. Lebih jauh lagi dengan uji Chi-square, menunjukkan bahwa kelembaban tanah pada tingkat 22.54% memberikan nilai resistivitas elektrik yang lebih tepat jika dibandingkan dengan nilai resistivitas elektrik pada borehole pada lokasi survey.
SUMMARY
NURMALA SARI. Effects of Soil Moisture Content on Electrical Resistivity Tomography Values Survey in Irrigation Paddy Field, Tanjong Karang, Malaysia. Supervised by PRASTOWO, YULI SUHARNOTO, GILLES BELAUD, JEAN STÉPHANE BAILLY and MOHAMMED AZWAN MOHAMMED ZAWAWI.
Electrical Resistivity Tomography (ERT) surveying method has been conducted in Irrigation Paddy Scheme, Tanjong Karang, Malaysia as part of investigation on groundwater potential aquifer to provide an alternative water resource for paddy irrigation. Based on recent studies on soil water resistivity in paddy field, irrigation system mentioned as soil moisture content was observed to affect the value of electrical resistivity and subsurface geological profile resulted from ERT surveying method. The objective of this study was to proof any correlation between soil moisture content and electrical resistivity values and to determine at what level of soil moisture content which will be the best condition to conduct ERT survey.
ERT analysis was conducted by using ABEM Terrameter SAS 4000 of Wenner-Schlumberger array with 5.0 meter and 10.0 meter for minimum and maximum electrode spacing. Visually, based on subsurface geological profile resulted from ERT analysis, soil moisture content affected (changed) electrical resistivity values. With all different treatments of soil moisture ranged from 16.96% to 27.50%, electrical resistivity values decreased in certain points and in certain depth along with the increase of soil moisture content. This was proofed by Anova and Duncan’s multiple range tests showing that Pr > F value was less
than 0.0001. Further on Chi-square test showed that at soil moisture level of 22.54%, it was the best condition which gave more correct counts of electrical resistivity values compared to well lithology sited on site survey location. This was assumed to be the best condition to conduct ERT survey.
© Copyright of Bogor Agricultural University, 2015
Protected by the laws
Any unauthorized quotation of all contents or any part thereof is strictly prohibited. Quotation is only for educational purpose, research, scientific writing, reports writing, critique and problem analysis; and quotation would not give any disadvantage on behalf of Bogor Agricultural University.
Thesis
in fulfillment of the requirement for the degree of Master Science in
Study Program of Civil and Environmental Engineering
EFFECTS OF SOIL MOISTURE CONTENT ON
ELECTRICAL RESISTIVITY TOMOGRAPHY VALUES
SURVEY IN IRRIGATION PADDY FIELD, TANJONG
KARANG, MALAYSIA
GRADUATE SCHOOL
BOGOR AGRICULTURAL UNIVERSITY BOGOR
2015
Thesis title : Effects of Soil Moisture Content on Electrical Resistivity Tomography Values Survey in Irrigation Paddy Field, Tanjong Karang, Malaysia
Name : Nurmala Sari
NIM : F451120131
Approved by Supervisory committee
Dr Ir Prastowo, MEng Committee chairman
Dr Ir Yuli Suharnoto, MEng Committee member
Authorized by
Civil and Environmental Engineering Study Program Chairman,
Dr Satyanto K. Saptomo, STP, MSi
Dean of Graduate School
Dr Ir Dahrul Syah, MScAgr
Date of Final Examination: 7 January 2015
FOREWORD
In the name of Allah SWT, the Most Gracious and the Most Merciful God who has helped, guided and blessed me through all the way to complete my Master study. Peace is upon my prophet Muhammad SAW who has fought for his entire life for Islam and brought Islam to light our lives. This study was intended as requirement to graduate in Master degree in Bogor Agricultural University, Indonesia. Groundwater was taken as topic for this study entitled ―Effect of Soil Moisture Content on Electrical Resistivity Tomography Values Survey in Irrigation Paddy Field, Tanjong Karang, Malaysia‖.
Allow me to express my special appreciation and deepest gratitude to my supervisors, Dr Ir Prastowo, MEng and Dr Ir Yuli Suharnoto, MEng who have supervised and guided me in fulfilling my thesis. For my internship supervisor, Mr. Mohamed Azwan bin Mohamed Zawawi, who has helped and assisted me in internship program for 6 months in Universiti Putra Malaysia (UPM), Malaysia. Thank you to all engineering assistants and colleagues in Soil and Water Conservation Engineering laboratory, UPM. I dedicate my sincere appreciation to my supervisors Mr. Gilles Belaud and Mr. Jean Stéphane Bailly for guiding and assisting me in completing my Master 2 program in SupAgro-Montpellier, France, in Double Degree Indonesia – Prancis (DDIP) program 2013 – 2014. Thank you to Directorate of Higher Education of Indonesia (DIKTI) and Government of France (BGF) who had granted me a full scholarship in 2012-2014, so that I could complete and finish my study in appropriate time.
I am deeply indebted to my beloved family, my husband, Jumhar Febriko, and my family in Persatuan Pelajar Indonesia (PPI) Montpellier and PPI – UPM, thank you so much for your endless love, prayers and encouragement. Lastly, I would like to thank whoever who is indirectly contribute to this research and gave me possibility to complete this research. Thank you so much.
May this study be blessed..
Bogor, February 2015
TABLE OF CONTENTS
LIST OF TABLES vi
LIST OF FIGURES vi
LIST OF APPENDIXES vi
1 INTRODUCTION 1
Geophysics Method for Groundwater Investigation 6
Electrical Resistivity Tomography (ERT) 6
ERT Surveys in Several Studies 9
3 MATERIALS AND METHODS 11
Study Site 11
Research Procedure 13
Calibration of 5TE Soil Moisture Sensor 14
Preliminary ERT survey 15
Site Survey 16
Materials 16
Instruments 17
Data Analysis Procedure 18
4 RESULT AND DISCUSSION 18
Calibration of 5TE Soil Moisture Sensor 18
Preliminary ERT survey 19
Site Survey 21
5 CONCLUSION AND PERSPECTIVE 25
Conclusion 25
Perspective 26
REFERENCES 26
APPENDIX 29
LIST OF TABLES
1 Data requirements for a groundwater investigation 3 2 Gephysical methods used in groundwater exploration 7 3 Comparison of dipole-dipole, Schlumberger, square and Wenner
electrode arrays 9
4 Categories of possibility to extract groundwater 23 5 Electrical resistivity of well lithology in Block F 24
LIST OF FIGURES
1 Flow diagram showing the sequence of tasks in groundwater 5 2 Arrangement of electrodes for a 2-D electrical survey and the
sequence of measurements used to build up a pseudosection 8 3 Common arrays used in resistivity surveys and their geometric
factors 9
4 Study site of Sawah Sempadan - Irrigation Scheme, Tanjong Karang
- Malaysia 11
5 Block C of Sawah Sempadan, Tanjong Karang, Malaysia 13 6 Block F of Sawah Sempadan, Tanjong Karang, Malaysia 14
7 Soil moisture measurement using 5TE sensor 15
8 ERT installation of preliminary study on Block C 16
9 ERT installation of site survey on Block F 16
10 ABEM Terrameter SAS 4000 17
11 5TE Soil moisture sensor 17
12 Calibration graph of 5TE soil moisture sensor 19 13 Soil moisture content changes in preliminary study on Block C 19 14 Comparison of subsurface geological profile on preliminary study.
Treatment with normal condition, soil moisture of 25.6 % (a), soil moisture of 46.8 % (b), and soil moisture of 48.1 % (c) 21 15 Soil moisture content changes in site survey Block F 21 16 Comparison of subsurface geological profile on site survey.
Treatment with normal condition soil moisture of 16.96 % (a), soil moisture of 22.54 % (b), and soil moisture of 27.50 % (c) 22 17 Soil moisture changes in paddy planting seasons 25
LIST OF APPENDIXES
1 Irrigation Schedule in West Selangor, Malaysia 29 2 Soil types in Block C and Block F, Tanjong Karang, Malaysia 30
3 5TE Soil Moisture Sensor Calibration 32
4 Soil density measurement 38
5 Well schematics and lithology in Block F 39
1
INTRODUCTION
Water resource is definitely one of the most important factors in agricultural activities. Especially for paddy plantation, irrigation is important to be managed and scheduled in order to fulfill the needs of water for each of paddy plantation stages. The most commonly used water resource for paddy plantation was surface water such as rivers and ponds. The use of surface water as water resource nowadays is facing the problem of draught, pollution and the amount of surface water itself which is limited to fulfill the need of agricultural activity (irrigation) (Hock 2008). Water shortage was due to the unbalance condition of supply and demand of water resources for agricultural activities and industrialization, especially in dry season. Due to this problem, it is necessary to find other alternative water resource to substitute surface water for agricultural activities.
Groundwater stored in the subsurface aquifer throughout Malaysia is estimated at 5000 billion m3, or 90% of Malaysian freshwater resource which is stored as groundwater (Azhar 2000). Recently, many researches have studied about the availability of subsurface water (groundwater) to take place as an alternative water resource, especially in Malaysia. One of studies was to find the potential location of subsurface aquifer by using Electrical Resistivity Tomography (ERT) surveying method on the site, where it was expected to be water resource for agricultural activities. ERT was confirmed to be one of geophysical methods which was efficient to provide detailed distribution of electrical resistivity to characterize the lineament such as quartz reef in granite host rock (Chandra et al. 2010).
Background Study
One study has given another opportunity to explore and investigate how electrical resistivity works on groundwater investigation. The study of several ERT surveys on paddy field in Sawah Sempadan, Tanjong Karang, Malaysia has been conducted and came up with results that electrical resistivity values, in same survey line, would change for every time sampling and every paddy planting season, due to irrigation activities. First ERT survey method was conducted in ploughing season meaning that there was no irrigation applied. Second ERT survey was conducted in saturation (after sowing) season, meaning that there was irrigation applied.
2
then proposed well will be incorrect and that would cause loses in times, financial, labors, etc. This study aims to help the use of electrical resistivity method in order to achieve a more correct subsurface geological profile.
Problem Statement
As one of the most important factors, water resource has to be maintained and sufficient to meet water needs in agricultural activities, especially for paddy plantation. Several problems which may occur like water pollution, salinity and water drought may give negative impacts to paddy plantation in term of irrigation activities. Therefore, one way to maintain water resource for irrigation is by finding alternative water resource like using groundwater. One way to find potential location for groundwater aquifer is by using ERT method. But in several ERT surveys which have been conducted, the results of electrical resistivity values would change in different condition of soil moisture (depends on irrigation on the field). This phenomenon offered two hypotheses; 1) the use of water (irrigation activity), in this study mentioned as soil moisture content, during paddy planting seasons influences the results of electrical resistivity analysis, in term of electrical resistivity values and 2) correct values of electrical resistivity will be achieved at an appropriate level of soil moisture content.
Objectives of Study
General objective of this study is to find potential location of groundwater aquifer in paddy plantation area. The specific objectives of this study are; 1) to find correlation between soil moisture content and electrical resistivity values in groundwater investigation, and 2) to determine the appropriate level of soil moisture content in paddy soil to conduct ERT survey.
Benefits of Study
This study was intended to improve the use of electrical resistivity surveying method by taking into consideration the condition of soil moisture content before applying ERT survey. Furthermore, this would help stakeholders to minimize loses in time, budget, and labor consuming.
Scope of Study
3 70 cm – 80 cm) (Shazelia 2011). Several studies would be necessary in order to apply this study in other different type of soil.
2
LITTERATURE REVIEW
Groundwater Investigation
Groundwater investigation is focused on production wells – for drinking water, irrigation or other supply purposes, but also focused on locating other type of wells for other purposes – aquifer cleanup, artificial recharge, and groundwater monitoring. The objectives of the groundwater investigations should be to find locations where wells can be designed and constructed to supply the required demand of water, of a quality suitable for the intended use, at reasonable cost and with least impact to either fellow groundwater users or to the aqueous environment. Environmental impacts to be avoided include: (i) significant reductions in soil water flow to ecologically important wetlands, spring areas or base flow-supported rivers; (ii) saline intrusion in coastal aquifers; and (iii) ground subsidence caused by large drawdowns in unconsolidated, compressible aquifers or by dewatering organic-rich sub soils or sediments.
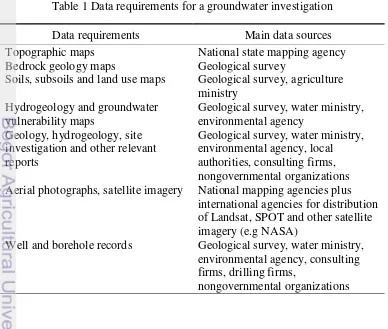
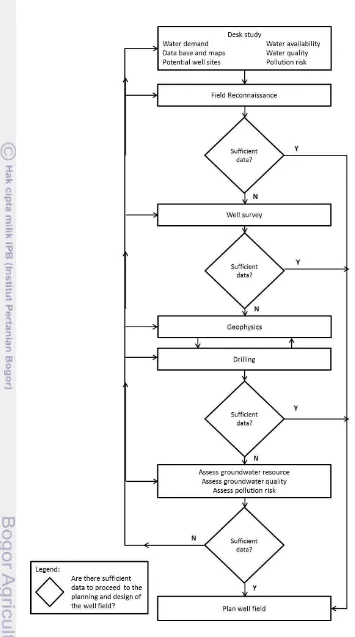
Flow diagram illustrating the sequence of groundwater investigations for locating well sites and planning a well scheme is shown in Figure 1. While several data are required in groundwater investigation as given in Table 1.
Table 1 Data requirements for a groundwater investigation
Data requirements Main data sources
Topographic maps National state mapping agency Bedrock geology maps Geological survey
Soils, subsoils and land use maps Geological survey, agriculture ministry Aerial photographs, satellite imagery National mapping agencies plus
international agencies for distribution of Landsat, SPOT and other satellite imagery (e.g NASA)
Well and borehole records Geological survey, water ministry, environmental agency, consulting firms, drilling firms,
4
Data requirements Main data sources
Water level and water quality monitoring data
Geological survey, water ministry, environmental agency,
environmental health office, local authorities
Existing groundwater abstractions Geological survey, ministry of water, rural development, irrigation or public works
River flow records Ministry of water, hydrometric agency, environmental agency, consulting firms, electricity (hydropower) authorities Climate data, including rainfall and
evapotranspiration
Meteorological office, hydrometric agency, water ministry,
5
6
Geophysics Method for Groundwater Investigation
Geophysical surveys can provide useful data on geology, aquifer geometry and water quality. Geophysical surveys are sometimes undertaken without proper planning, but rather in the hope that they will show something useful. It does not lead to a unique geological model; more than one interpretation of the data is possible. Borehole control is essential to reduce this ambiguity. Therefore, geophysical surveys should be carried in conjunction with exploratory boreholes rather than as a replacement for a drilling program. The combined use of geophysics and drilling can produce results more cheaply than relying on drilling alone, since the number of exploratory boreholes can be reduced (Misstear, Banks, and Clark 2006).
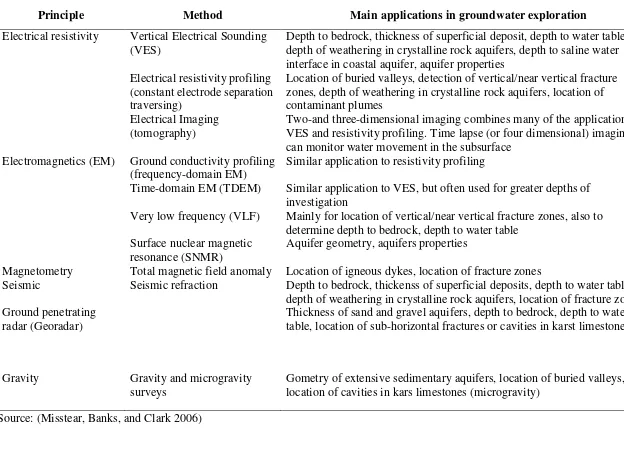
There are several methods used in geophysical groundwater investigation as mentioned in Table 2. Different methods provide data on different geophysical properties on the ground and therefore, the best survey results are usually achieved by using more than one method (Misstear, Banks, and Clark 2006).
Electrical Resistivity Tomography (ERT)
ERT surveying method is one tool in geophysical method used in groundwater investigation, which uses the principle of electrical resistivity. Among other principles used in groundwater investigations are electromagnetics (EM), magnetometry, seismic, ground penetrating radar (GPR), and gravity (Misstear, Banks, and Clark 2006). Each of these principles has different in main applications in groundwater investigations. This study will focus on ERT surveying method, because more researches used this method due to its low cost, simple operation, and efficiency in areas with high contrasting resistivity (Muchingami et al. 2012).
Method of electrical resistivity is basically aimed to determine subsurface resistivity distribution by making measurement on the ground surface. This measurement will then be inverted to get true electrical resistivity values of subsurface.
Basically the concept of ERT survey is by passing an electrical current (I) into the ground between two electrodes and measuring the potential (V)
difference between two other electrodes. Then, apparent electrical resistivity (pa) can be calculated as,
Source: (Loke 2000)
Where k is geometric factor which depends on electrode arrangement
of ERT survey line. Since resistance (R) is equal as V/I, then, apparent electrical resistivity could be calculated as,
Source: (Loke 2000)
Table 2 Gephysical methods used in groundwater exploration
Principle Method Main applications in groundwater exploration
Electrical resistivity Vertical Electrical Sounding (VES)
Depth to bedrock, thickness of superficial deposit, depth to water table, depth of weathering in crystalline rock aquifers, depth to saline water interface in coastal aquifer, aquifer properties
Electrical resistivity profiling (constant electrode separation traversing)
Location of buried valleys, detection of vertical/near vertical fracture zones, depth of weathering in crystalline rock aquifers, location of contaminant plumes
Electrical Imaging (tomography)
Two-and three-dimensional imaging combines many of the applications of VES and resistivity profiling. Time lapse (or four dimensional) imaging can monitor water movement in the subsurface
Electromagnetics (EM) Ground conductivity profiling (frequency-domain EM)
Similar application to resistivity profiling
Time-domain EM (TDEM) Similar application to VES, but often used for greater depths of investigation
Very low frequency (VLF) Mainly for location of vertical/near vertical fracture zones, also to determine depth to bedrock, depth to water table
Surface nuclear magnetic
resonance (SNMR) Aquifer geometry, aquifers properties
Magnetometry Total magnetic field anomaly Location of igneous dykes, location of fracture zones
Seismic Seismic refraction Depth to bedrock, thickenss of superficial deposits, depth to water table, depth of weathering in crystalline rock aquifers, location of fracture zones, Ground penetrating
radar (Georadar)
Thickness of sand and gravel aquifers, depth to bedrock, depth to water table, location of sub-horizontal fractures or cavities in karst limestones
Gravity Gravity and microgravity surveys
Gometry of extensive sedimentary aquifers, location of buried valleys, location of cavities in kars limestones (microgravity)
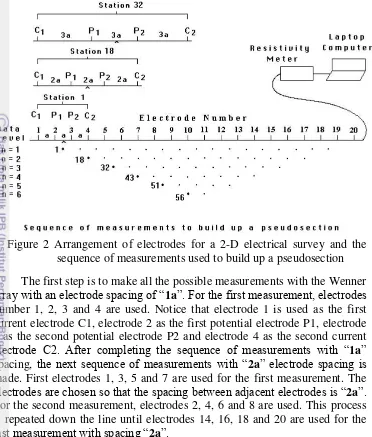
Figure 2 Arrangement of electrodes for a 2-D electrical survey and the sequence of measurements used to build up a pseudosection The first step is to make all the possible measurements with the Wenner
array with an electrode spacing of ―1a‖. For the first measurement, electrodes number 1, 2, 3 and 4 are used. Notice that electrode 1 is used as the first current electrode C1, electrode 2 as the first potential electrode P1, electrode 3 as the second potential electrode P2 and electrode 4 as the second current
electrode C2. After completing the sequence of measurements with ―1a‖ spacing, the next sequence of measurements with ―2a‖ electrode spacing is made. First electrodes 1, 3, 5 and 7 are used for the first measurement. The
electrodes are chosen so that the spacing between adjacent electrodes is ―2a‖. For the second measurement, electrodes 2, 4, 6 and 8 are used. This process is repeated down the line until electrodes 14, 16, 18 and 20 are used for the
last measurement with spacing ―2a‖.
9
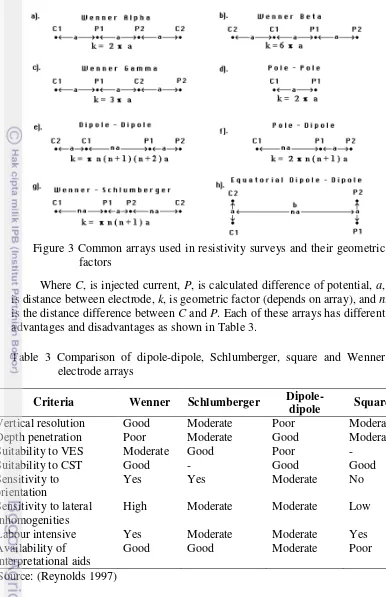
Figure 3 Common arrays used in resistivity surveys and their geometric factors
Where C, is injected current, P, is calculated difference of potential, a,
is distance between electrode, k, is geometric factor (depends on array), and n,
is the distance difference between C and P. Each of these arrays has different
advantages and disadvantages as shown in Table 3.
Table 3 Comparison of dipole-dipole, Schlumberger, square and Wenner electrode arrays
Criteria Wenner Schlumberger
Dipole-dipole Square
Vertical resolution Good Moderate Poor Moderate
Depth penetration Poor Moderate Good Moderate
Suitability to VES Moderate Good Poor -
Suitability to CST Good - Good Good
Sensitivity to orientation
Yes Yes Moderate No
Sensitivity to lateral inhomogenities
High Moderate Moderate Low
Labour intensive Yes Moderate Moderate Yes
Availability of interpretational aids
Good Good Moderate Poor
Source: (Reynolds 1997)
ERT Surveys in Several Studies
10
ERT surveying method (Wenner-Schlumberger) and Vertical Electrical Sounding (VES) method (Muchingami et al. 2012). It was mentioned that
ERT surveying method provided a more detailed interpretation of the subsurface hydro-geological features from which potential sites for successful borehole (well) location are identified. This study applied Wenner
– Schlumberger array of 100 meter survey line with 5 meter distance of electrode spacing in four different survey lines. Here, it was concluded that electrical resistivity values for high potential groundwater was in value of less than 50 Ωm and for low potential groundwater location was in value higher than 500 Ωm. And here, they found suitable borehole location which
could be used for long term groundwater prospecting.
Groundwater, soil pollution and salinity were also presented as problem that could be solved by using resistivity method (Jiang et al. 2013) (Mcinnis et al. 2013) (Yogeshwar et al. 2012). On their research (Jiang et al. 2013),
high-electrical resistivity surveying method was used to locate contaminant source causing groundwater pollution in Nanjing chemical plant, China. By using four different types of array; Wenner Array, Schlumberger Array, Polo-Pole Array and Dipole-Dipole Array, the results mentioned that the contaminant was in level exceeding 100 Ωm of electrical resistivity values,
and the distribution of contaminant in subsurface layer was delineated by profile map resulted from inversion of apparent electrical resistivity values. This result was verified by chemical analysis of soil and water sampling which was taken from observation borehole along electrical resistivity survey line. The profile map could be used as guidance to determine location point where to conserve area which was already polluted.
Investigations on the occurrence of potential subsurface aquifer have also been done by some researches to provide an alternative water resource for irrigation instead of using water surface (Chandra et al. 2010) (Tronicke et al. 1999). In (Chandra et al. 2010), the study was focused on geophysical
modeling of geological discontinuities in a granitic aquifer in Hyderabad, India. The research integrated ERT method of Wenner-Schlumberger array with 10 meter electrode spacing, electrical resistivity values from well drilled along survey line, and well lithology, and came up with results of 2D profile of geological set up of quartz reef in granite host medium, and among the results it showed that deepening of fracturing fronts over the quartz reefs as well as generation of fractures inside the body would turn into groundwater potential zones. Other study on groundwater exploration was conducted in northern Germany on Spiekeroog Island (Tronicke et al. 1999). This study
was conducted by joining ERT (Schlumberger array with maximum of 150 meter electrode spacing) and Ground Penetrating Radar (GPR) survey. In this study they were able to map contour of freshwater lens trapped in subsurface layer, based on values of water level reading from groundwater boreholes and groundwater level as reflected by GPR. This map described the location of potential freshwater (in unit meter over mean sea level) and also showed the effect of water exploitation in that island that caused in decrease of water table values. In Malaysia, one of the uses of resistivity method was used to calculate and figure freshwater lens on an island of Carey (Baharuddin et al.
11 groundwater investigation in dry area of Northern Kuwait (Al-ruwaih and Ali 1986). In this study, due to dry nature of the surface soil and presence of highly cemented gravels and sandstone at shallow depth, contact resistance at the current electrodes was high and current penetration was a major problem, therefore it was necessary to wet current electrodes (or best conducted after rainfall). These studies, among other studies, have given a broader and deeper knowledge of the usefulness of ERT method in agricultural and environmental field.
3
MATERIALS AND METHODS
Study Site
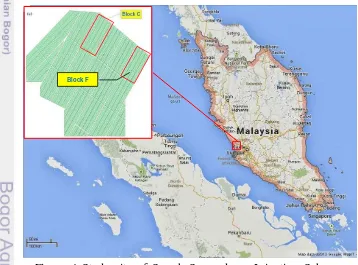
The study site was in Sawah Sempadan Irrigation Scheme, Tanjong Karang, Malaysia, which covers an area approximately of 2,300 ha. This area, among other areas, is under supervision of IADA (Integrated Agricultural Development Area), Ministry of Agriculture and Agro-based Industry Malaysia, which concerns on developing integrated agricultural activities all over Malaysia. Map of Sawah Sempadan is presented in Figure 4.
Figure 4 Study site of Sawah Sempadan - Irrigation Scheme, Tanjong Karang - Malaysia
Paddy varieties which are commonly planted throughout Malaysia are MR 84, MR 167, MR 185, MR 159. Normally certified paddy seeds (certificate of Malaysian Standard MS 469:1993) are planted and sold by Department of Agriculture, under Ministry of Agriculture and Agro-Based
12
Industry to all farmers in Malaysia. Paddy seeds are planted in soil with pH of 5.0 – 6.0, nitrogen of 2% – 3%, phosphor of > 40 ppm, potassium of > 0.1 mEq/100 gram, CEC of > 20 mEq/100 gram and carbon organic of 2% - 3% (Pertanian 1999). Other soil properties which should be maintained for paddy planting are soil slope of 0% - 2%, soil depth of >25 cm, and soil texture of sandy loam or very fine sand.
Normally there are three different paddy planting methods such; direct sowing in dry paddy plot, direct sowing in wet paddy plot and indirect paddy planting. The most commonly practiced method is indirect paddy planting, meaning that paddy seeds are sowed in a 1 – 2 meter wide plot and any desirable length. After 15 days after sowing, it is recommended to give fertilizers (urea: 80 kg/ha N, 30 kg/ha P2O5, 20 kg/ha K2O - for west coast of
Malaysia) to paddy seeds with concentration of 45 – 50 gram/m2. And after 18 to 21 days paddy seeds are ready to be planted in paddy plot.
For indirect paddy planting method, land preparation is applied normally 27 days before planting, starting from dry ploughing activity. Paddy plots are ploughed using mechanized tractor which could be rent and subsided by government. After dry ploughing, next activity is weeding in 17-23 days before planting. This activity prevents paddy pests and diseases from attacking area. Next activity is second ploughing (dry or wet) on 7-10 days before planting, followed by wet ploughing and soil leveling on 1 day before planting. Last ploughing activity is to irrigate paddy plot until water level reaches 10 cm above ground. After being irrigated, water excess on paddy plot is flowed in to drainage canal, and plot is ready to be planted.
Paddy seeds are planted with distance of 25 cm x 25 cm for optimum in growing and food gaining. Fertilizing activity is continued for three times after paddy being planted in paddy plot. First in 15 days after planted with concentration of NPK is 35 kg/ha, 30 kg/ha and 20 kg/ha, respectively. Second in 35 days after planted with only 23 kg/ha N. Third in 55 days after planting with 22 kg/ha N. Paddy will be harvested after 125 – 135 days after sowing.
Irrigation activities on Sawah Sempadan are applied by using integrated irrigation canal systems of primary and secondary canal. Main water resource is from surface water of river near paddy plots and water is delivered along main canal and distributed along in secondary canal. Once the paddy plot is fulfilled with irrigation water, excess water will flow out over the drainage canal. The needs of irrigation water depend on each paddy planting stages. More water is required on after sowing and mid-season stage for approximately 10 cm of high water level inside paddy plot (Pertanian 1999). Details of irrigation schedule are presented in Appendix 1. Irrigation schedule is managed and controlled fully by IADA.
13 Research Procedure
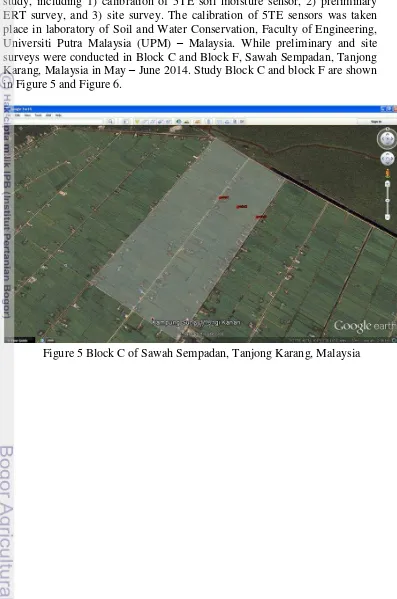
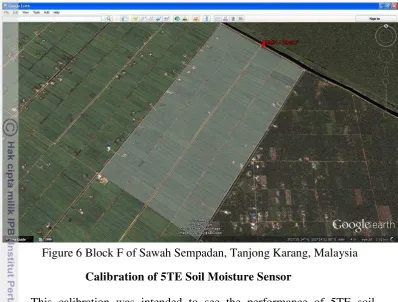
Several preliminary studies have taken place in order to support this study, including 1) calibration of 5TE soil moisture sensor, 2) preliminary ERT survey, and 3) site survey. The calibration of 5TE sensors was taken place in laboratory of Soil and Water Conservation, Faculty of Engineering, Universiti Putra Malaysia (UPM) – Malaysia. While preliminary and site surveys were conducted in Block C and Block F, Sawah Sempadan, Tanjong Karang, Malaysia in May – June 2014. Study Block C and block F are shown in Figure 5 and Figure 6.
14
Figure 6 Block F of Sawah Sempadan, Tanjong Karang, Malaysia Calibration of 5TE Soil Moisture Sensor
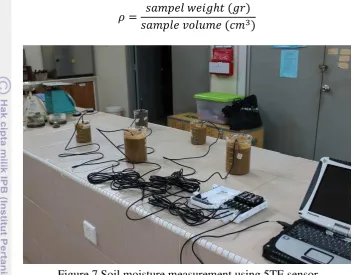
This calibration was intended to see the performance of 5TE soil moisture sensor to measure soil moisture content, compared to oven dried method. Soil samples used for this calibration were randomly selected in laboratory area. Thirty different conditions of soil moisture were measured by 5TE Soil moisture sensor and by using oven dried method. These conditions were achieved by adding water into the soil so that soil moisture would be varied. The 5TE sensors read soil moisture content in volumetric based (%), while oven dried method was soil moisture measurement on weight based (%).
Thirty different samples of soil were placed in a beaker and 5TE sensor was put in each beaker. All sensors were then connected to Em50 ECH20 Logger. Measurements by 5TE soil moisture sensor were recorded in 30 minutes in Em50 logger with interval reading of 2 minutes. So for every sample there would be 15 reading of soil moisture sensors which would then be averaged to get average soil moisture sensor. Data stored in data logger were downloaded in ECH2O software (Decagon Device Inc, 2006) in spreadsheet file format. Soil moisture measurement using 5TE sensor was presented in Figure 7.
While for oven dried method, 5 samples of each soil conditions was placed in a beaker with approximately 50-80 gram soil sample. Soil sample was oven dried for 24 hours and soil moisture was calculated based on difference of wet soil sample and dried soil sample (weight based). Since oven dried method gave weight based measurement, the results should be multiplied by soil density to find volumetric soil moisture results, as
measurement unit of 5TE soil sensors. Soil density (ρ) was determined in
15 beaker weigh (gram) as soil weight and beaker volume as soil volume (cm3). Soil density was calculated by using equation below:
Figure 7 Soil moisture measurement using 5TE sensor Preliminary ERT survey
The preliminary ERT survey was conducted in Block C - Irrigation Scheme, Tanjong Karang, Malaysia. ERT measurement was set by using a 400 meter survey line of Wenner-Schlumberger array with minimum and maximum electrode spacing of 5.0 meter and 10.0 meter. Wenner-Schlumberger array was chosen because based on several journals on groundwater resistivity analysis this array gives greater sensitivity in vertical and horizontal profile of subsurface than other arrays do (Loke 2000), (Muchingami et al. 2012).
16
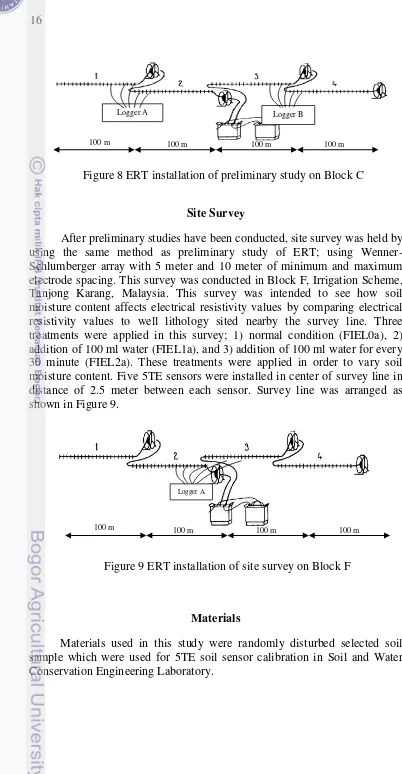
Site Survey
After preliminary studies have been conducted, site survey was held by using the same method as preliminary study of ERT; using Wenner-Schlumberger array with 5 meter and 10 meter of minimum and maximum electrode spacing. This survey was conducted in Block F, Irrigation Scheme, Tanjong Karang, Malaysia. This survey was intended to see how soil moisture content affects electrical resistivity values by comparing electrical resistivity values to well lithology sited nearby the survey line. Three treatments were applied in this survey; 1) normal condition (FIEL0a), 2) addition of 100 ml water (FIEL1a), and 3) addition of 100 ml water for every 30 minute (FIEL2a). These treatments were applied in order to vary soil moisture content. Five 5TE sensors were installed in center of survey line in distance of 2.5 meter between each sensor. Survey line was arranged as shown in Figure 9.
Figure 9 ERT installation of site survey on Block F
Materials
Materials used in this study were randomly disturbed selected soil sample which were used for 5TE soil sensor calibration in Soil and Water Conservation Engineering Laboratory.
Logger A Logger B
100 m 100 m 100 m 100 m
Logger A
100 m 100 m 100 m 100 m
17
Instruments
Some hard wares and soft wares were used in this study. For hard ware instruments, it was used 5TE soil moisture sensor from Decagon Company, with 70 Hz dielectrics wave frequency. Other hard ware was 1 unit of oven and instruments used to measure soil moisture content in manual method; oven dried method. While for electrical resistivity method, it was used 1 unit of ERT instrument ABEM Terrameter SAS 4000. Hard wares are shown in Figure 10 and Figure 11.
Instruments in soft wares used in this study were; 1) software ECH2O Utility version 1.12 from Decagon Company to download result measured of soil moisture recorded in data logger sensor 5TE, 2) software SAS 4000 (ABEM Instrument AB, 1999) to download values of electrical resistivity recorded in instrument ABEM Terrameter SAS 4000, and 3) software RES2DINV version 3.71 (Geotomo software, 1995-2011), to analyze results of electrical resistivity and 4) software for statistical analysis, Minitab version 16.1 (Minitab Inc, 2010).
18
Data Analysis Procedure
Statistical analysis was done to provide a deeper analysis and to proof the hypothesis that soil moisture content will affect electrical resistivity values. Analysis using ANOVA and Duncan’s multiple range tests on SAS
9.3 software were used to proof this hypothesis. Another study which would be conducted was to determine level of soil moisture content which will give correct values of electrical resistivity compared to well lithology. This was done by using Chi-square test method in Minitab 16 software. This analysis was to compare electrical resistivity values from different conditions of soil moisture content to electrical resistivity values of well lithology, and see which level of soil moisture which gave the closest electrical resistivity values to well values.
In statistical analysis, it was focused on 102.5 meter inner survey line with 1,800 points of ERT values. This was due to the electrode distance in inner survey line which was set closer to each other (5 meter instead of 10 meter). The closer the electrode spacing the deeper the profile and the more points of ERT will be produced.
4
RESULT AND DISCUSSION
Calibration of 5TE Soil Moisture Sensor
19
Figure 12 Calibration graph of 5TE soil moisture sensor
The calibration of 5TE soil moisture sensor was resulted in value of R2 of 0.8182 with y = 0.9946x. This gives satisfaction that 5TE soil moisture sensor was able to measure volumetric soil moisture content directly with percentage of correctness was approximately 81.82%.
Preliminary ERT survey
Based on three different treatments applied in preliminary study of ERT, the result of soil moisture content showed that maximum soil moisture was in range of 46-48 %. The changes in soil moisture content along these treatments are shown in Figure 13.
Figure 13 Soil moisture content changes in preliminary study on Block C
20
Generally the data obtained during ERT measurements were classically presented as apparent resistivity pseudo-section, which gave an approximate picture of the subsurface resistivity. Apparent electrical resistivity values obtained from site were inverted by using RES2DINV software for each treatment. Before the inversion process, to obtain true model representing continuous distribution of calculated electrical resistivity in the subsurface, data were concatenated and the noise and spiky values were edited by using RES2DINV software. The inversion procedure was based on the regularized least-square optimization method (Metwaly and Alfouzan 2013). Using 7 iterations and Root Mean Square error of less than 100 %, subsurface geological profile of three different soil moisture conditions are shown in Figure 14.
Figure 14 (a) was subsurface geological profile in Block C resulted from ERT inversion results with normal condition (no water added). This profile gave ERT value in range of 0 – 40 Ωm on depth of 74.7 meter. When
water added in survey line, and changed soil moisture content to 46.8% (Figure 14 (b)), subsurface profile was still in same pattern as normal condition, but ERT values in depth of 10 meter, dropped to majority 10 Ωm
from previously was 40 Ωm on the same depth. While for last treatment
(Figure 14 (c)) with adjusted soil moisture of 48.1%, subsurface geological profile was still in the same pattern with the first two treatments but with ERT values on depth of 10 meter ranged from 0 – 70 Ωm, and in several
points ranged from 0 – 250 Ωm. Overall, soil moisture content descriptively
will not affect subsurface geological profile but affects values of ERT.
a)
(a)
21
Figure 14 Comparison of subsurface geological profile on preliminary study. Treatment with normal condition, soil moisture of 25.6 % (a), soil moisture of 46.8 % (b), and soil moisture of 48.1 % (c)
Results of ANOVA tests showed that these treatments were highly significant different at level 1%, with Pr value was less than F value of
0.0001. Further on Duncan’s multi range test showed that treatment 1 and 2
were not significantly different, but treatment 3 was significantly different compared to other treatments. It was approved that electrical resistivity values would change along with soil moisture content.
Site Survey
Soil moisture content in this survey ranges in average of 17-31% as shown in Figure 15. Based on inversion of apparent electrical resistivity values with RES2DINV software, subsurface geological profile of three different treatments in Block F are shown in Figure 16.
Figure 15 Soil moisture content changes in site survey Block F
22
Figure 16 Comparison of subsurface geological profile on site survey. Treatment with normal condition soil moisture of 16.96 % (a), soil moisture of 22.54 % (b), and soil moisture of 27.50 % (c)
From Figure 16 at certain depth (red circle), Figure 16 (a) gave electrical resistivity values in range of 50-500 Ωm, Figure 16 (b) gave electrical values in range of 50-100 Ωm, Figure 16 (c) gave electrical resistivity values in range of 10-50 Ωm. It can be concluded that electrical
resistivity values decreased along with the increase of soil moisture content. But this condition is limited to field capacity preference. When soil reaches its field capacity, it is assumed that electrical resistivity values would be steady. The decrease of electrical resistivity along with the increase of soil moisture content happened because high soil moisture content will increase electrical conductivity of soil, which in turn will decrease electrical resistivity values (Baharuddin et al. 2013), as mentioned in equation below:
σ= 1ρ
Where σ is electrical conductivity (mS/m) and ρ is resistivity (Ωm). This condition was also emphasized that low electrical resistivity would occur in weathered zones, that were formed due to the weathering effects of surface and groundwater inside the limestone, as these zones had high moisture content (Metwaly and Alfouzan 2013). Figure 16 also described that
(a)
(b)
23 there was different condition of electrical resistivity between top layers (0 m
– 26 m) – having high electrical resistivity values, and sub layers (> 26 m) – having low electrical resistivity values, because as current flows from top layers towards sub layers, current density would increase and the potential gradient at the potential electrode would decrease. This explained why sub surface profiles were different among layers (Reynolds 1997).
Since the purpose of groundwater investigation is to determine potential location for groundwater aquifer, it can be seen that from three different conditions above, groundwater layer occurs in depth of approximately 26 meter below surface with electrical resistivity values of groundwater is in range of 10 –100 Ωm (Loke 2000), (Nordiana et al. 2013).
Ideally, groundwater investigation should be joined with drilling investigation to verify that results of electrical resistivity compile with soil analysis. However, the possibility to extract groundwater from its potential location also depends on materials compositions which surround the groundwater layer. According to study conducted by Bose (Bose, Chatterjee, and Sen 1973), the classification categories of ―productive zone‖ of
groundwater as described in Table 4.
Table 4 Categories of possibility to extract groundwater Resistivity range
(Ωm) Likely composition
Groundwater
significantly different at level 1%. Further on Duncan’s multiple range tests
results showed that each treatment (different soil moisture condition) gave different letters, meaning that these treatments were significantly different. Thus, it can be concluded that soil moisture content will give effect on electrical resistivity values.
24
should be compared to electrical resistivity values of well lithology. Detail of well schematics in Block F is presented in Appendix 5. This analysis was done by using Chi-square test method in Minitab 16 software. Electrical resistivity values of well lithology are shown in Table 5 (Saad, Nawawi, and Mohamad 2012). There was no information available on soil moisture content of well lithology.
Table 5 Electrical resistivity of well lithology in Block F No. Lithology Depth (m) Electrical Res. Value (Ωm) moisture content, each treatment gave correct counts of electrical resistivity values of 82, 108, and 54, respectively for treatment 1, 2, and 3, compared to well lithology. From total data of 600 for each treatment, the percentage correctness of electrical resistivity for each treatment was 14%, 18%, and 9%, respectively. Thus, the highest percentage of correct values was from treatment 2 (soil moisture of 22.54 %). From this analysis it can be concluded that soil moisture of level 22.54% gave more correct value of electrical resistivity than other soil moisture level (16.96% and 27.50%). Details of square test analysis were presented in Appendix 6. Along with Chi-square analysis results, it was showed that P-value was 0.0001 (less than 0.05). This strengthened ANOVA results that variables (soil moisture content) were dependent, thus, soil moisture content affected electrical resistivity values.
25
Figure 17 Soil moisture changes in paddy planting seasons
Based on research on differences of soil moisture content in paddy planting season in Tanjong Karang, it was concluded that soil moisture level at different paddy planting season was 27 % (before planting), 50 % (mid planting), and 35 % (after harvest) on top soil (depth 30 cm) of paddy soil (Athirah 2011). While field treatment on this study proofed that each different level of soil moisture content from treatment 1, 2, and 3 would gave significant different on electrical resistivity analysis, and came up that soil moisture 22.54% would be the best condition to get a correct electrical resistivity values (red rectangle zone on Figure 17) - more field trials are requested to get exact number. Thus, it can be inferred that the best condition to conduct ERT analysis was on before planting season. However, further studies will be required to proof this result by soil sampling on certain depth of survey line, and measure its electrical resistivity directly.
5
CONCLUSION AND PERSPECTIVE
Conclusion
Based on this study and statistical analysis which has been conducted, it is concluded that for paddy soil, soil moisture content will affect (change)
electrical resistivity values (Ωm), referred to ANOVA and Duncan’s multiple
range test with Pr > F value was less than 0.0001. By observing the subsurface geological profile resulted from ERT analysis, groundwater aquifer will lie between 10 – 100 Ωm of electrical resistivity values. But, it should be noted that an available groundwater aquifer layer should be surrounded by highly permeable layers such as sands (range in 60 – 1000
Ωm), and coarse and gravels (range in 35 – 80 Ωm), so the groundwater is easy to extract and available for use. Along with this, the presence of groundwater is indicated by lineament area of quartz vein/reef, pegmatite veins, dolerite dykes, etc, having electrical resistivity values of 1000 – 2108
26
of groundwater in same zone will be affected by soil characteristics; porosity and permeability, along with weathering and fracturing of rocks.
Compared to average value of soil moisture content in several paddy planting stages, this study would propose that the best condition to conduct ERT survey was at the stage of before planting (dry ploughing), approximately 7-10 days before planting. At this paddy planting stage there is no irrigation water delivered to paddy plots. For this type of paddy soil, soil moisture content at this stage is in average of 27%.
Perspective
This study was applicable only for paddy soil having majority in texture of silty clay and clay loam. Thus, it is recommended to study the effect of soil moisture content on electrical resistivity survey on other different type of soil, because soil moisture content will be different for different type of soil. This is due to difference of structure and texture of each type of soil. According to several references, geophysics survey should be carried out in conjunction with exploratory boreholes. The combined use of geophysics and drilling can produce results more cheaply than relying on drilling alone, since the number of exploratory boreholes can be reduced. This study could provide an answer of why changes occur in subsurface geological profile resulted from ERT analysis, which could serve as an initial guide for a more detailed groundwater investigation subject.
REFERENCES
Aimrun W. 2006. Paddy Field Zone Delineation Using Apparent Electrical Conductivity and Its Relationship to the Chemical and Physical Properties of Soil [thesis]. Serdang (Malaysia): Universiti Putra Malaysia.
Al-ruwaih F, and Ali HO. 1986. Resistivity Measurements for Groundwater Investigation in The Umm Al-Aish Area of Northern Kuwait. Journal of Hydrology 88: 185–98.
Ashikin S. 2011. Determination of Paddy Soil Layer Using Penetrologger [thesis]. Serdang (Malaysia): Universiti Putra Malaysia.
Athirah A. 2011. Determination of Unsaturated Hydraulic Conductivity of Paddy Soil at Sawah Sempadan Irrigation Compartement, Tanjong Karang, Malaysia [thesis]. Serdang (Malaysia). Universiti Putra Malaysia.
Azhar M. 2000. Managing Malaysian Water Resources Development [review]. Buletin Kesihatan Masyarakat. 40–58.
Baharuddin MFT, Ismail Z, Othman SZ, Taib S, Hashim R. 2013. Use of Time-Lapse Resistivity Tomography to Determine Freshwater Lens
Morphology. Measurement 46 (2):964–75.
27 Bose RN, Chatterjee D, Sen AK. 1973. Electrical Resistivity Surveys for Groundwater in the Aurangabad Sub-Division, Gaya District, Bihar, India. Geoexploration 11: 171–81.
Chandra S, Dewandel B, Dutta S, Ahmed S. 2010. Geophysical Model of
Geological Discontinuities in a Granitic Aquifer : Analyzing Small
Scale Variability of Electrical Resistivity for Groundwater Occurrences.
Journal of Applied Geophysics 71 (4): 137–48.
doi:10.1016/j.jappgeo.2010.06.003.
Hock LC. 2008. State of Water Resources in Malaysia [review]. Departement of Irrigation and Drainage, Malaysia.
[IADA] Integrated Agricultural Development Area. 2009. Mesyuarat Jawatankuasa Program Meningkatkan Hasil Padi Negeri Selangor. Serdang: IADA Barat Laut Selangor.
Jabatan Pertanian. 1999. Pakej Teknologi Padi. Putrajaya (Malaysia): Jabatan Pertanian Malaysia.
Jiang Y, Li Y, Yang G, Zhou X, Wu J, Shi X. 2013. The Application of High-Density Resistivity Method in Organic Pollution Survey of Groundwater and Soil. Journal of Procedia Earth and Planetary Science
7: 932–35. doi:10.1016/j.proeps.2013.03.011.
Loke MH. 2000. Electrical Imaging Surveys for Environmental and Engineering Studies. Littleton, Colorado: Heritage Geophysics Inc. Mcinnis D, Silliman S, Boukari M, Yalo N, Orou-pete S, Fertenbaugh C,
Sarre K, Fayomi H. 2013. Combined Application of Electrical Resistivity and Shallow Groundwater Sampling to Assess Salinity in a Shallow Coastal Aquifer in Benin , West Africa. Journal of Hydrology
505: 335–45. doi:10.1016/j.jhydrol.2013.10.014.
Metwaly M, Alfouzan F. 2013. Geoscience Frontiers Application of 2-D Geoelectrical Resistivity Tomography for Subsurface Cavity Detection in the Eastern Part of Saudi Arabia. Journal of Geoscience Frontiers 4
(4): 469–76. doi:10.1016/j.gsf.2012.12.005.
Misstear B, Banks D, Clark L. 2006. Water Wells and Boreholes. West
Sussex, England: John Wiley & Sons Ltd.
Muchingami I, Hlatywayo DJ, Nel JM, Chuma C. 2012. Electrical Resistivity Survey for Groundwater Investigations and Shallow Subsurface Evaluation of the Basaltic-Greenstone Formation of the Urban Bulawayo Aquifer. Journal of Physics and Chemistry of the Earth
50-52: 44–51. doi:10.1016/j.pce.2012.08.014.
Nordiana MM, Saad R, Nawawi MNM, Azwin IN, Mohamad ET. 2013. Case
Study : Shallow Subsurface Geology Mapping Using Resistivity Imaging with EHR Technique. Journal of APCBEE Procedia 5: 134–40.
doi:10.1016/j.apcbee.2013.05.024.
Reynolds JM. 1997. An Introduction to Applied and Environmental Geophysics. West Sussex (GB): John Wiley & Sons Ltd.
Saad R, Nawawi MNM, Mohamad ET. 2012. Groundwater Detection in Alluvium Using 2-D Electrical Resistivity Tomography (ERT).
Electronic Journal of Geotechnical Engineering Vol. 17B: 369–76.
28
Exploration on the Island of Spiekeroog — Northern Germany. Journal of Hydrology 223: 44–53.
Yogeshwar P, Tezkan B, Israil M, Candansayar ME. 2012. Groundwater
Contamination in the Roorkee Area , India : 2D Joint Inversion of
29 Appendix 1 Irrigation Schedule in West Selangor, Malaysia
Day After Sowing
(DAS) (day) Paddy planting stage
Water irrigation
level
Water level height (cm)
30 After sowing I 10
40 Active tillering II 10
60 Maximum tillering II 10
70 Panicle initiation II 10
80 Flowering I 10
100 Stem elongation and panicle extension I 10
115 Dough and ripening III 0
130 Harvest III 0
Note :
30
Appendix 2 Soil types in Block C and Block F, Tanjong Karang, Malaysia Block C
1. Soil series : Telok series Classification : Typic sulfaquept Landform : Marine terrace Vegetation : Paddy
Drainage : Poorly drained Parent material : Marine alluvium Soil profile :
Depth (cm) Description
0 – 7.62 Very dark grey (10YR 3/1) silty clay; friable; strongly developed fine subangular blocky structure; abundant pores; many channels; abundant roots; boundary diffuse.
7.62 – 15.24 Very dark grey (10YR 3/1) clay; firm to friable; weakly developed coarse angular blocky structure; many pores; few fine faint yellowish brown (10YR 5/8) mottles along root channels; few fine roots; boundary diffuse.
15.24 – 45.72 Very dark grey (10YR 3/1) clay; friable; moderately well developed medium subangular blocky structure; many pores; few fine faint light olive brown (2.5Y 5/4) mottles and many fine distinct yellowish red (5YR 4/8) mottles along root traces; many fine roots; boundary distinct.
31 Appendix 2 Soil types in Block C and Block F, Tanjong Karang, Malaysia 2. Soil series : Jawa series
Classification : USDA-Fine, mixed isohyperthermic Sulfic Tropaquept FAO- Thionic Fluvisol
Landform : Coastal plain
Vegetation : Coconut, cocoa and garden Drainage : Poorly to imperfectly drained Parent material : Marine alluvium
Soil profile :
Depth (cm) Description
0-20 Dark grayish brown (10YR 4/2) dry clay loam; moderately well developed medium to fine subangular blocky structure; friable dry; abundant pores; many fine roots and channels; boundary distinct.
20-32 Very dark grayish brown (10YR 3/2) dry clay; common medium distinct brown (7.5YR 5/4) mottles; moderately well developed medium to coarse angular blocky structure; friable dry; abundant pores; many roots and few channels; boundary indistinct.
32-60 Dark grayish brown (10YR 4/2) dry clay; abundant medium distinct strong brown (7.5YR 5/6) mottles along former channels; weakly developed coarse angular blocky structure; friable; many pores; many roots and few channels; boundary indistinct.
60-90 Greyish brown (10YR 5/2) silty clay; massive; sticky; many coarse distinct yellow jarosite mottles; few roots; boundary diffuse.
90+ Dark greenish grey (5GY 4/1) clay; massive; very sticky.
Block F
Soil series : Sabrang series
32
Appendix 3 5TE Soil Moisture Sensor Calibration Oven dried method (weight based measurement)
33 Appendix 3 5TE Soil Moisture Sensor Calibration
34
Appendix 3 5TE Soil Moisture Sensor Calibration
35 Appendix 3 5TE Soil Moisture Sensor Calibration
Treatment
Oven dried method (volumetric measurement)
36
Appendix 3 5TE Soil Moisture Sensor Calibration
Treatment Average soil moisture (weight based) (%)
5TE soil moisture sensor measurement (volumetric measurement)
37
Treatment Average soil moisture (volumetric based) (%)
23 19.295
24 18.501
25 19.590
26 19.756
27 19.463
28 21.293
29 23.859
30 24.593
38
Appendix 4 Soil density measurement
No. t (cm) D (cm) Vsoil
(cm³) Mb (gr)
Mb+Ms
(gr) Ms (gr)
soil (gr/cm³)
1 2.2 7.1 87.058 33.850 154.070 120.220 1.381
2 2.2 7.15 88.289 33.150 145.980 112.830 1.278
3 2.4 7.1 94.972 34.310 155.940 121.630 1.281
4 2 7.1 79.144 33.020 134.500 101.480 1.282
5 2 7.2 81.389 33.090 141.820 108.730 1.336
Where:
t : height of beaker d : diameter of beaker
Vsoil : volume of soil placed in a beaker Mb : mass of beaker
Ms : mass of soil
40
Appendix 6 Chi – square analysis results
Treatment Correct
counts
Wrong counts
Total counts
Percent correct
(%)
1 82 518
600 13.6
Expected counts 81.33 518.67
Chi-square contributions 0.005 0.001
2 108 492
600 18
Expected counts 81.33 518.67
Chi-square contributions 8.743 1.371
3 54 546
600 9
Expected counts 81.33 518.67
41 Fithria Sari, they lived in Medan until 1994 and moved to Padang, West Sumatera, Indonesia. Writer graduated from her Bachelor Degree (S1) in study program of Agricultural Engineering, Faculty of Agricultural Technology, Andalas University, Padang in 2008, after completing her study for 4 years 2 months.
While taking her Bachelor Degree, writer
was an active student in students’ organization.
She joined organization in faculty, Agriculture Information Technology Club (AgITC), holding a position as member from 2004 until 2005, and chairman from 2005 until 2006. She was also rewarded ―Mahasiswa Berprestasi‖
scholarship from government from 2005 until 2007, and Best Graduate Student from Faculty in Graduation Ceremony in December 2008.
After she graduated, she started as research assistant for Doctoral Student of Kassel University – Germany, Wahyudi David, STP, MSc, PhD for 3 months (June 2009 – August 2009). Writer was also hired as Assistant Trainee (April 2010 – January 2011), and Planning Assistant (January 2011 –
September 2012) in PT. Riau Andalan Pulp and Paper (PT. RAPP), Pangkalan Kerinci, Riau, Indonesia.
She decided to continue her study by taking Master Degree scholarship from Directorate of Higher Education (DIKTI), in Double Degree Indonesia – Prancis (DDIP) scheme. In September 2012, writer was accepted as Master student in Bogor Agricultural University (IPB) in study program of Civil and Environmental Engineering, Faculty of Technology of Agriculture. After one year in IPB, writer continued her second year of master in SupAgro
– Montpellier, France, in study program of Eau et Agriculture and finished