COMPETITIVENESS ANALYSIS OF
INDONESIAN SHRIMP FARMING:
POLICY ANALYSIS MATRIX (PAM) APPROACH
SITI MARYAM
GRADUATE SCHOOL
BOGOR AGRICULTURAL UNIVERSITY
BOGOR
STATEMENT OF THESIS, SOURCE OF INFORMATION
AND COPYRIGHT
I hereby declare that the master thesis entitled “Competitiveness Analysis of Indonesian Shrimp Farming: Policy Analysis Matrix (PAM) Approach” is my work with the direction of the Advisory Committee supervision and has not been submitted to any other universities. Source of information derived or quoted from works published and unpublished from other authors have been mentioned in the text and listed in the Bibliography at the end of this master thesis.
I hereby assign the copyright of my master thesis to Bogor Agricultural University.
Bogor, May 2015
Siti Maryam H451110521
Copyright transfer due to the collaborative research work with other parties outside the Bogor
SUMMARY
SITI MARYAM. Competitiveness Analysis of Indonesian Shrimp Farming: Policy Analysis Matrix (PAM) Approach. Supervised by RACHMAT PAMBUDY, ANDRIYONO KILAT ADHI, BERNHARD BRÜMMER and GABRIELE HÖRSTGEN-SCHWARK.
This study assesses the level of competitiveness and policy impact on the vannamei shrimp farming through Policy Analysis Matrix (PAM) approach in Tambak Pinang Gading (TPG), Balai Layanan Usaha Produksi Perikanan Budidaya Karawang (BLUPPBK), and PT. Surya Windu Kencana (SWK), respectively located in Lampung, West Java, and East Java. Indicators measured are competitive and comparative advantages and policy impact to input and output. Several policy scenarios are made to observe the impact of changes in the input and output variable on the shrimp farming competitiveness, while sensitivity analysis is performed to measure the responsiveness of the competitiveness indicator DRC due to changes in the input and output variable. Objectives of this research are: 1). To analyze the competitiveness of Indonesian shrimp farming, 2). To analyze the impact of government policy on the competitiveness of Indonesian shrimp farming, and 3) To analyze the influence of prospective changes in policies on the competitiveness of Indonesian shrimp farming.
The result shows that shrimp farming business in TPG-Lampung and SWK-East Java had competitive and comparative advantages in respect of the less than one value of PCR and DRC. Yet, BLUPPBK-West Java was found to have competitive advantage and comparative disadvantage due to the greater than one value of DRC. Furthermore, government intervention impacts both on the output and input of the shrimp farming business. Results for indicators of policy impact to input and output shows that there was still no protection in tradable input. Later, combination of all applied policies only gave incentive to shrimp farming in TPG-Lampung and SWK-East Java.
Policy scenarios reveal that abolishment of import duty policy for imported wheat flour (shrimp feed ingredient) and increasing of shrimp FOB price have successfully raised the competitive advantages of all shrimp firms observed. However, increasing of feed price turns out to lessen the competitive advantages of the shrimp farming business. Hence, policy to decrease input price in shrimp culture, particularly feed, is considered be applied. Finally, comparative advantages of shrimp farming business are sensitive due to the changes in the transportation cost and official exchange rate.
RINGKASAN
SITI MARYAM. Analisa Daya Saing Budidaya Udang Indonesia: Pendekatan Matriks Analisa Kebijakan (PAM). Dibimbing oleh RACHMAT PAMBUDY, ANDRIYONO KILAT ADHI, BERNHARD BRÜMMER dan GABRIELE HÖRSTGEN-SCHWARK.
Studi ini memperkirakan tingkat daya saing dan pengaruh kebijakan terhadap budidaya udang vannamei melalui pendekatan Matriks Analisa Kebijakan (PAM) di Tambak Pinang Gading (TPG), Balai Layanan Usaha Produksi Perikanan Budidaya Karawang (BLUPPBK), dan PT. Surya Windu Kencana (SWK) yang masing-masing berlokasi di Lampung, Jawa Barat, dan Jawa Timur. Indikator yang diukur antara lain keunggulan kompetitif dan komparatif serta dampak kebijakan terhadap input dan output. Beberapa skenario kebijakan dibuat untuk mengamati dampak perubahan input dan output terhadap daya saing usaha budidaya udang, sementara analisa sensitivitas dilakukan untuk mengukur kepekaan indikator DRC terhadap perubahan pada variabel input dan output. Tujuan dari penelitian ini adalah untuk: 1). Menganalisa daya saing budidaya udang Indonesia, 2). Menganalisa dampak kebijakan pemerintah terhadap daya saing budidaya udang Indonesia, dan 3). Menganalisa pengaruh perubahan kebijakan terhadap daya saing budidaya udang Indonesia.
Hasil penelitian menunjukkan bahwa usaha budidaya udang di TPG-Lampung dan SWK-Jawa Timur memiliki keunggulan kompetitif dan komparatif yang didasarkan pada nilai PCR dan DRC yang kurang dari satu. Sementara itu budidaya udang di BLUPPBK-Jawa Barat ternyata hanya memiliki keunggulan kompetitif saja. Intervensi pemerintah berdampak baik pada input maupun output dari usaha budidaya udang. Hasil dari indikator dampak kebijakan terhadap input dan output menunjukkan bahwa belum ada proteksi yang dlakukan terhadap input tradable. Kombinasi dari keseluruhan pelaksanaan kebijakan hanya memberikan insentif pada usaha budidaya udang vannamei di TPG-Lampung dan SWK-Jawa Timur.
Berdasarkan skenario kebijakan yang dilakukan, penghapusan kebijakan bea impor untuk tepung gandum (bahan pakan udang) dan kenaikan harga FOB udang akan meningkatkan keunggulan kompetitif budidaya udang. Namun demikian, kenaikan harga pakan akan menurunkan keunggulan kompetitif budidaya udang vannamei. Oleh karena itu, penerapan kebijakan yang bertujuan untuk menurunkan harga input budidaya, khususnya pakan, sangat dibutuhkan. Selanjutnya, keunggulan komparatif usaha budidaya udang sensitif terhadap perubahan dalam biaya transportasi dan nilai tukar rupiah.
© Bogor Agricultural University Right Reserved, 2015
Copyright Reserved
It is prohibited to cite a part or entire of this master thesis without including or mentioning the source. Citations are only for purposes of education, research, scientific writing, preparation of reports, critics, or review an issue; and those are not detrimental to the interest of the Bogor Agricultural University.
COMPETITIVENESS ANALYSIS OF
INDONESIAN SHRIMP FARMING:
POLICY ANALYSIS MATRIX (PAM) APPROACH
SITI MARYAM
Thesis
as one of requirements to obtain a degree of Magister Sains
in
Study Program of Agribusiness
GRADUATE SCHOOL
BOGOR AGRICULTURAL UNIVERSITY
BOGOR
Thesis Title : Competitiveness Analysis of Indonesian Shrimp Farming: Policy Analysis Matrix (PAM) Approach
Name : Siti Maryam
NRP : H451110521
Approved Advisory Committee
Dr Ir Rachmat Pambudy MS Dr Ir Andriyono Kilat Adhi
Chairman Member
Prof Dr Bernhard Brümmer Prof Dr Gabriele Hörstgen-Schwark
Member Member
Agreed
Coordinator of Major Agribusiness Dean of Graduate School
Prof Dr Ir Rita Nurmalina MS Dr Ir Dahrul Syah MScAgr
ACKNOWLEDGMENT
First, all praise to Allah SWT for having made everything possible. I would like to express my deepest appreciation to all those who have helped and supported me in finishing this research.
I would like to express my deep gratitude to my supervisors in Bogor Agricultural University, Dr Ir Rachmat Pambudy, MS and Dr Ir Andriyono Kilat Adhi for supporting me in finishing this thesis. Moreover, I would give special gratitude to my supervisors in Göttingen University, Prof Dr Bernhard Brümmer and Prof Dr Gabriele Hörstgen-Schwark, for guiding and encouraging me so that I can finish writing this research. I would especially like to thank Prof Dr Rita Nurmalina, MS and Prof Dr Stephan von Cramon-Taubadel with respect to Sustainable International Agriculture (SIA), the joint degree program between Magister Science of Agribusiness, Bogor Agricultural University and Master of International Agribusiness and Rural Development, Göttingen University. I would also like to thank Dr Ir Suharno, MADev as examiner commission on affairs of master thesis examination and Dr Ir Burhanuddin, MM as representative examiner from study program of Agribusiness.
Furthermore, I would also like to acknowledge with much appreciation to Siti Nurazizah, Fiddini Alham, Firsty Rahmatia, Doni Nurdiansyah, Dian Eka Ramadhani, Septi Dwi Maulida, Dedi Anwar Sipayung, M Fuadi, and Harry Wuwungan for contributions in the data collecting process. I must also acknowledge Iwan Sutanto (President of Shrimp Club Indonesia), Dr Sukenda (Owner of Tambak Pinang Gading, Lampung), and Ir Hardi Pitoyo (Coordinator of PT. Surya Windu Kencana, Banyuwangi) for giving me permission to use the shrimp data in this research.
For funding my study in Indonesia, I would like to thank Indonesian Planning and Cooperation of Foreign Affairs (BPKLN). I would also like to say my sincere gratitude to Directorate General of Higher Education Republic of Indonesia (DIKTI) and Studium International Georg-August-Universität Göttingen for funding my study in Germany.
Finally, a huge thank you to all my friends who supported me a lot: Die Göttinger Zwölf, BDP IPB 42, Nacom-Dahlia, Midori’s, SIA 2012, MSA-SIA 2013, MSA IPB, PPI Göttingen, all my friends in Indonesia and my international friends in Germany. I am particularly grateful for the support of my family, Amang, and Bibi. Finally, I dedicate my work to my parents and my sister who always encourage and support me throughout my study.
CONTENTS
Market Overview of Indonesian Shrimp 7
Competitiveness Studies on Shrimp in Indonesia 12 Policy Analysis Matrix Studies on Shrimp in South East Asia 13
3 FRAMEWORK 14
Determination of Cost Allocation Methods for Input 23 Calculation of Social Price for Input and Output 23
PAM Analysis 26
Policy Scenario and Sensitivity Analysis 28
5 RESULTS AND DISCUSSION 29
Overview of Shrimp Farming in Research Location 29
Shrimp Farming Profile 29
Policy Impact to Input and Output 36
Influence of Prospective Changes in Policies 38
Policy Scenario 38
Sensitivity Analysis 39
REFERENCES 42
APPENDICES 47
BIOGRAPHY 58
LIST OF TABLES
1 World fisheries and aquaculture production, 2007-2012 1 2 Major vannamei shrimp production area in Indonesia 9 3 Policies regarding shrimp farming business in Indonesia 12
4 Classification of commodity price policy 17
5 Policy Analysis Matrix 21
6 Policy Analysis Matrix (PAM) 26
7 Shrimp farming profile in selected firms 30
8 Business analysis of vannamei shrimp farming (ha/cycle) 31 9 Policy analysis matrix for shrimp farming (IDR/ha/cycle) 32
10 Benefit-cost ratio of shrimp farming 33
11 Indicator of shrimp farming competitiveness 34
12 Indicators of policy impact to output 35
13 Indicators of policy impact to input 36
14 Indicators of policy impact to input and output 37
15 Policy scenario results 39
16 Sensitivity analysis results 39
LIST OF FIGURES
1 Dynamics of world shrimp farming production, 1980-2010 4 2 World shrimp culture by major producing countries, 2005-2013 4
3 Shrimp price in the USA Port, 2004-2013 5
4 Shrimp import trend, 2005-2013 6
5 Shrimp farming development in Indonesia, 1980-2012 7 6 Vannamei shrimp (left) and tambak for shrimp culture (right) 8
7 Indonesian shrimp production, 2009-2014* 8
8 Export quantity and value of Indonesian shrimp, 2004-2013 9
9 Indonesian shrimp value chain and bottleneck 10
10 Subsidy policy on output 18
11 Trade policy on output 19
12 Subsidy policy on tradable input 19
13 Subsidy olicy on non-tradable input 20
LIST OF APPENDICES
1 Social valuation of exchange rate 47
2 Social valuation of shrimp 48
3 Social valuation of feed 48
4 Social valuation of urea (fertilizer) 49
5 Social valuation of dolomite (lime) 49
6 Social valuation of fuel 49
7 Social valuation of electricity 50
8 Social price and social budget in selected shrimp farming firms 51
9 Policy scenario 52
LIST OF ABBREVIATIONS
BAU : Bogor Agricultural University
BLUPPBK : Balai Layanan Usaha Produksi Perikanan Budidaya Karawang;
Business Service Center for Aquaculture Production Karawang
BMTPS : Bea Masuk Tindakan Pengamanan Sementara; Safeguard import tariff
CIF : Cost, Insurance, and Freight CVD : Countervailing Duties
DJPB : Direktorat Jenderal Perikanan Budidaya; Directorate General of Aquaculture
DKP-Lampung : Dinas Kelautan dan Perikanan Provinsi Lampung; Marine and Fisheries Service of Lampung Province DRC : Domestic Resource Cost
EPC : Effective Protection Coefficient FAO : Food and Agriculture Organization FCR : Food Conversion Ratio
FOB : Free on Board
FT : Factor Transfer
IDR : Indonesian Rupiah
IT Input Transfer
KADIN : Kamar Dagang Indonesia;
Indonesian Chamber of Commerce and Industry
KKP : Kementerian Kelautan dan Perikanan Republik Indonesia; Ministry of Marine Affairs and Fisheries Republic of Indonesia (MMF)
kWh : Kilowatt-hour
NPCI : Nominal Protection Coefficient Input NPCO : Nominal Protection Coefficient Output
NT : Net Transfer
OECD : Organization for Economic Co-operation and Development
OT : Output Transfer
PAM : Policy Analysis Matrix PBCR : Private Benefit-Cost Ratio PC : Profitability Coefficient PCR : Private Cost Ratio
SBCR : Social Benefit-Cost Ratio SRP : Subsidy Ratio to Producer
STP : Sekolah Tinggi Perikanan Jakarta; Fisheries University of Jakarta
SWK : Surya Windu Kencana
TPG : Tambak Pinang Gading
UNCOMTRADE : The United Nations Commodity Trade Statistics Database USAID : United States Agency for International Development USD : United States Dollar
1 INTRODUCTION
Background
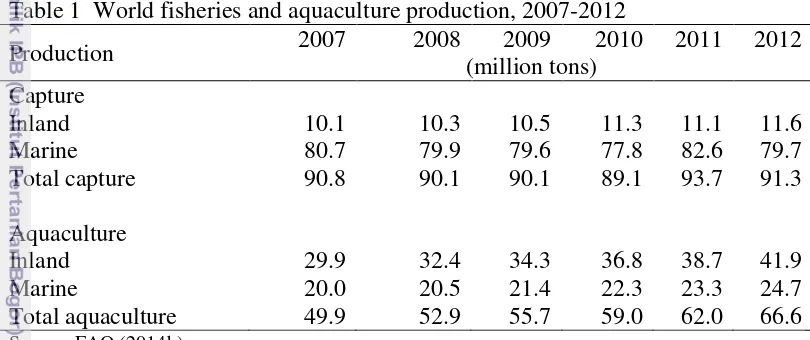
Aquaculture appears to be the world’s fastest industry in producing animal based-food due to the increasing demand for food and rapid expansion of world population (FAO 2014a). Moreover, another reason is related to the efficient production aspect in fish farming such as the low feed conversion ratio (FCR1) and the fast growth rate of fish. Furthermore, in contrast to the stagnant production of the world capture fishing, the global aquaculture production increased through years (Table 1). Report from World Bank (2014) stated that by 2030, aquaculture will provide about two-third of world fish consumption.
Table 1 World fisheries and aquaculture production, 2007-2012
Production 2007 2008 (million tons) 2009 2010 2011 2012
Having advantages as a maritime country, aquaculture production in Indonesia showed a significant increase, from a production of 3.2 million tons (2007) to 7.93 million tons (2011), which also contributed for 58.11 percent of national total fisheries production in 2011 (KKP 2011). For the last several years, shrimp has been the main exported commodity from fisheries sector. Total value of shrimp export in 2011 was about 37 percent of Indonesian total value export from fisheries sector (KKP 2011). Japan and the US were the main export destination countries with 366 million USD and 665million USD of export value in 2013, respectively (UNCOMTRADE 2014).
Development of shrimp farming in Indonesia has started since the eye-stalk ablation2 in 1980s with black tiger shrimp as the main species cultured. The production then continues to grow through technology improvement in hatchery, feed, and tambak3 management (Juarno 2012). Ministry of Marine Affairs and Fisheries of Republic Indonesia (MMF) reported that shrimp production had increased from 3.4 tons in 2009 to 4.15 tons in 2012 with 60 percent of the total production came from white leg shrimp production (KKP 2013a).
1 Quantity (kg) of feed required to produce 1 kg of fish meat
2 Technique to stimulate female shrimp to develop mature ovaries and spawn by cutting the eye stalk of
shrimp (Aquaculture-ugent, 2002)
3 Tambak is pond with dike which located in coastal area and used for aquaculture, particularly milkfish and
Vannamei shrimp (Litopenaeus vannamei) or whiteleg shrimp which originates from Pacific Ocean was firstly cultured in Florida in 1973 then spread around the world, especially in Asia. The major vannamei producer countries are China, Thailand, Vietnam and Indonesia. Intensive to super-intensive culture system of vannamei shrimp have been applied to meet the increasing demand of this commodity (FAO 2014c). Introduction of vannamei shrimp in 2001 has given positive impact on shrimp production in Indonesia, with East Java, Lampung and West Java become the three biggest vannamei production provinces. In 2012, East Java, Lampung and West Java produced 23 percent, 16 percent, and 12 percent, respectively, of national vannamei production (KKP 2013a).
Researches indicating that Indonesia has competitiveness in shrimp farming had been conducted by Zaini et al. (2003), Tajerin and Noor (2004), and Juarno (2012). However, several problems which influence the shrimp competitiveness have been faced by Indonesian shrimp farmers, i.e. diseases, high input price, and also low productivity and quality of shrimp. Therefore, implementation of government policies regarding technical and economical aspect of shrimp culture has been made. One policy, that is shrimp revitalization program, is aimed to increase the domestic production by conducting development in shrimp business system, starting from the production system improvement until the marketing system. Yet, another policy such as import duty for imported shrimp feed ingredient is likely to hinder the development of shrimp farming since around 60 percent of production cost in shrimp farming is spent for feed.
Various established policies in shrimp farming will influence the shrimp culture in many aspects, particularly the competitiveness. Thus, policy analysis matrix (PAM) approach which applied in this research would be beneficial in observing the shrimp competitiveness level and the impact of government policies on shrimp farming activities. Furthermore, impact of prospective changes in policies on shrimp farming competitiveness, in the form of policy scenario and sensitivity analysis, will also be discussed in this research.
Research Problem
As one of the world main shrimp exporters, Indonesia with its shrimp business not only has several problems (high price of input, diseases) but also opportunities such as idle land and other natural resources. Therefore, the government policy implementation is expected to increase the shrimp farming competitiveness through any improvement in production quantity and quality. Based on the description, the research questions which should be answered in this study are:
1. What is the competitiveness level of Indonesian shrimp farming?
2. What is the impact of government policy on the competitiveness of Indonesian shrimp farming?
3. How prospective changes in policies would influence the competitiveness of Indonesian shrimp farming?
Objectives
Based on the explanation above, the objectives of this research are: 1. To analyze the competitiveness of Indonesian shrimp farming
2. To analyze the impact of government policy on the competitiveness of Indonesian shrimp farming
3. To analyze the influence of prospective changes in policies on the competitiveness of Indonesian shrimp farming
Research Scope and Limitation
This study is analyzing the competitiveness and policy impact on vannamei shrimp farming in Tambak Pinang Gading (TPG) Lampung, Balai Layanan Usaha Produksi Perikanan Budidaya Karawang (BLUPPBK) West Java, and PT. Surya Windu Kencana (SWK) East Java using Policy Analysis Matrix. Indicators measured were competitive and comparative advantages, policy impact to output, policy impact to input, and policy impact to input and output. Several policy scenarios are made to observe the impact of changes in the input and output variable on the shrimp farming competitiveness, while sensitivity analysis is performed to measure the responsiveness of the competitiveness indicator DRC due to changes in the input and output variable. However, there are some limitations of this study. First, primary data source only covered three firms conducting intensive shrimp farming which did not represent Indonesian shrimp farming in general. Second, shrimp farming data and policies to be analyzed were only related to the year 2013.
2 LITERATURE REVIEW
Market Overview of World Shrimp
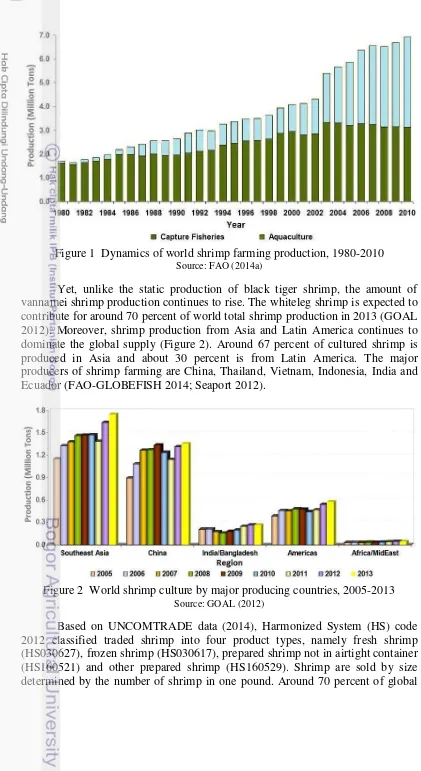
Figure 1 Dynamics of world shrimp farming production, 1980-2010 Source: FAO (2014a)
Yet, unlike the static production of black tiger shrimp, the amount of vannamei shrimp production continues to rise. The whiteleg shrimp is expected to contribute for around 70 percent of world total shrimp production in 2013 (GOAL 2012). Moreover, shrimp production from Asia and Latin America continues to dominate the global supply (Figure 2). Around 67 percent of cultured shrimp is produced in Asia and about 30 percent is from Latin America. The major producers of shrimp farming are China, Thailand, Vietnam, Indonesia, India and Ecuador (FAO-GLOBEFISH 2014; Seaport 2012).
Figure 2 World shrimp culture by major producing countries, 2005-2013 Source: GOAL (2012)
traded shrimp is in frozen raw type. Various forms of this frozen shrimp type traded internationally are Head On (HO), Head Less (HL), Peeled Deveined Tail-On (PDTO), Peeled Deveined Tail-Off (PDTF), Peeled Un-Deveined (PUD), and other frozen forms (NOAA 2013).
FAO-GLOBEFISH (2014) stated that the current trend of global shrimp trade is the lower supply and higher price of shrimp. Despite of high export value of frozen shrimp (HS030617) which reached USD 10.7 Billion in 2012, the value decreased to USD 10.67 Billion in 2013. MMF mentioned that the EMS (Early Mortality Syndrome) disease spread in Asia and Latin America in the late 2012 was suspected to be the main reason of the lowered production (KKP 2013b). This harmful disease caused significant loss to shrimp farmer and also a decline in shrimp export quantity from Thailand (23.8 percent), Vietnam (19.7 percent), and China (28.4 percent). Besides, there were also antibiotic issues in Vietnam and India which triggered the export restriction applied by Japan (VASEP 2012).
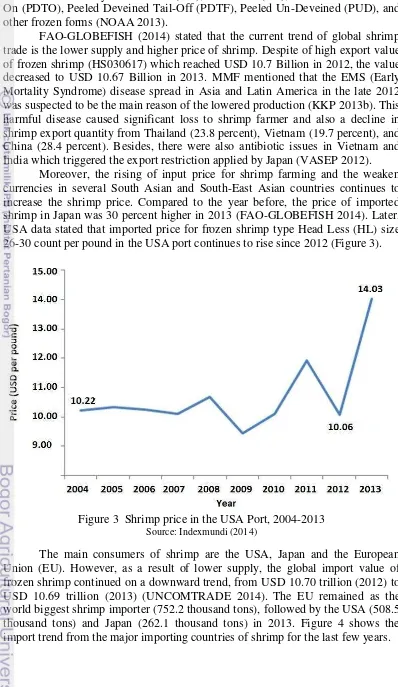
Moreover, the rising of input price for shrimp farming and the weaken currencies in several South Asian and South-East Asian countries continues to increase the shrimp price. Compared to the year before, the price of imported shrimp in Japan was 30 percent higher in 2013 (FAO-GLOBEFISH 2014). Later, USA data stated that imported price for frozen shrimp type Head Less (HL) size 26-30 count per pound in the USA port continues to rise since 2012 (Figure 3).
Figure 3 Shrimp price in the USA Port, 2004-2013 Source: Indexmundi (2014)
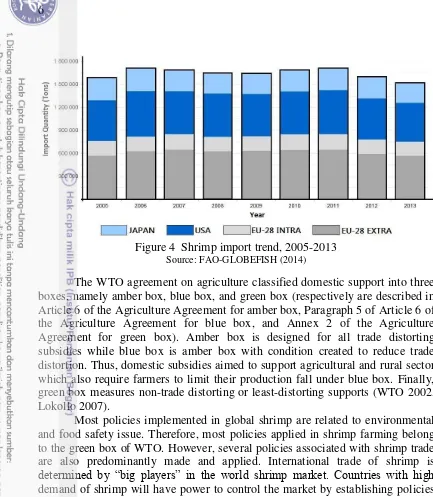
Figure 4 Shrimp import trend, 2005-2013 Source: FAO-GLOBEFISH (2014)
The WTO agreement on agriculture classified domestic support into three boxes, namely amber box, blue box, and green box (respectively are described in Article 6 of the Agriculture Agreement for amber box, Paragraph 5 of Article 6 of the Agriculture Agreement for blue box, and Annex 2 of the Agriculture Agreement for green box). Amber box is designed for all trade distorting subsidies while blue box is amber box with condition created to reduce trade distortion. Thus, domestic subsidies aimed to support agricultural and rural sector which also require farmers to limit their production fall under blue box. Finally, green box measures non-trade distorting or least-distorting supports (WTO 2002, Lokollo 2007).
Most policies implemented in global shrimp are related to environmental and food safety issue. Therefore, most policies applied in shrimp farming belong to the green box of WTO. However, several policies associated with shrimp trade are also predominantly made and applied. International trade of shrimp is determined by “big players” in the world shrimp market. Countries with high demand of shrimp will have power to control the market by establishing policies which protect their domestic producers and consumers (Leung and Sharma 2001).
Remained as the world biggest importing country of shrimp, the US, Japan, and the EU set strict requirements for exporting countries, ranging from food safety and environmental issue to subjects related to tariff. The non-tariff barriers that have to be passed by the importing countries are requirements on chemical residue, food safety, certification (including Best Aquaculture Practices), traceability, eco-labeling, and environmental sustainability (FAO 2014d).
However, the new GSP scheme in 2014 excludes Thailand from beneficiary countries and sets new tariff of 12 percent (from 4.2 percent) on raw shrimp and 20 percent (from 7 percent) on prepared shrimp (Berenguer 2014).
Similar to the EU shrimp regulation, Japan applies the Food Sanitation Act to ensure that the imported shrimp is antibiotic free. Furthermore, Japan established import tariff for prepared shrimp of 4.8 percent in general, 3.2 percent for GSP countries, and 0 percent for ASEAN countries (ITPC Osaka 2012).
As a response to increase in shrimp imports and decline in shrimp prices, the US International Trade Commission (USITC) proposed countervailing duties (CVD) in December 2012 on imported shrimp from seven countries (China, Ecuador, India, Indonesia, Malaysia, Thailand, and Vietnam) that had been accused for unfair trade by subsidizing their shrimp industries. The final result from the USA Department of Commerce (USDOC) in August 2013 stated that China, Ecuador, India, Malaysia, and Vietnam are proven in receiving subsidies rates of 18.16 percent, 10.13-13.51 percent, 5.54-6.16 percent, 10.80-54.5 percent, and 1.15-7.88 percent, respectively, while Indonesia and Thailand exempted from the CVD since subsidy found in both countries were less than 2 percent or de minimis (USDOC 2013).
Market Overview of Indonesian Shrimp
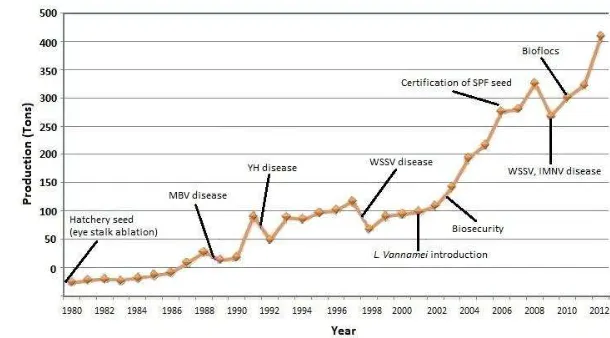
In general, shrimp farming in Indonesia is conducted in small scale tambak with traditional technology. Thus, Indonesian shrimp culture is characterized by small enterprise, local ownership, low capital, low technology and also low productivity (Dyspriani 2007). However, shrimp has been set as one of the major commodities in Indonesian aquaculture industrialization policy for its high economic value. Around 70 percent of shrimp in Indonesia is produced in aquaculture. Despite there are several shrimp cultivated in Indonesia, black tiger shrimp and vannamei shrimp have been the top species cultured ever since. Black tiger shrimp culture was firstly applied in 1960s, but the increasing production started after the eye-stalk ablation and other improvements in aquaculture system and technology in 1980s (Figure 5) (Soebjakto 2013; STP 2013).
Diseases have become a serious problem in black tiger shrimp farming so that the introduction of vannamei shrimp in 2001, which is considered to be more disease resistant, brought positive impacts in domestic shrimp production. Furthermore, unlike the black tiger shrimp, vannamei is an open thelycum species which means that it can be bred artificially and spawned easily in the culture tank. Thus, shrimp culturist is able to close the life cycle of this shrimp and to conduct the genetic selection and domestication program which will cut down the expense of captive broodstock (Briggs et al. 2004). Due to the advantages of breeding and disease resistance, the whiteleg shrimp gains the international market. Vannamei shrimp and tambak which is used for shrimp culture in Indonesia are shown in Figure 6.
Figure 6 Vannamei shrimp (left) and tambak for shrimp culture (right) Source: Van Duijn et al. (2012); Ramadhani (2013)
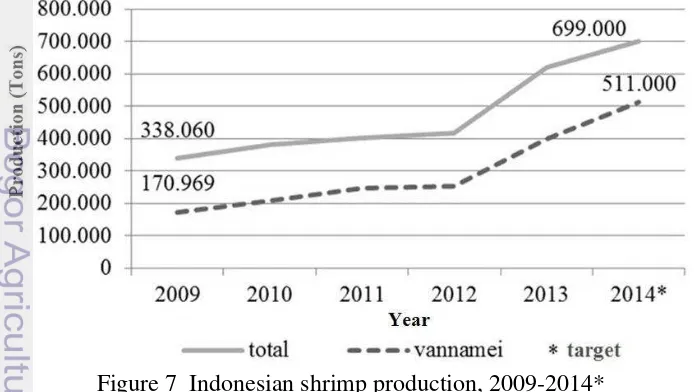
MMF data in 2013 showed that there was a rise in shrimp production for the last few years (Figure 7). Total production of shrimp increased by 49 percent from the year 2012 to 2013. For this remarkable result, MMF set a shrimp production target of 699 000 tons for 2014. National vannamei production climbed to 251 763 tons in 2012, while 162 068 tons or 64 percent of that amount was exported to international market (KKP 2013c; Soebjakto 2013; DJPB 2014; IISP 2014; RRI 2014).
Several major production areas for vannamei shrimp farming in Indonesia are East Java, Lampung, West Nusa Tenggara, South Sumatera, and West Java (Table 2). East Java contribution for national production increased from only 5.7 percent in 2008 to 23 percent in 2012. Despite diseases and management problems which reduced Lampung cultured production from 2009 to 2012, production of vannamei shrimp in Lampung escalated to 72 051.08 tons or about 78 percent from the year before (DKP Lampung 2014, personal interview).
Table 2 Major vannamei shrimp production area in Indonesia
No Province Vannamei shrimp production (Tons)
2008 2009 2010 2011 2012
1 East Java 12 040 27 438 34 593 35 058 58 483
2 Lampung 132 896 58 567 37 357 44 161 40 489
3 West Nusa Tenggara 27 056 25 130 32 627 43 077 38 525
4 South Sumatera - 30 500 30 955 41 309 32 490
5 West Java 3 451 3 428 25 353 30 600 29 900
6 Others 33 205 25 906 45 693 52 215 51 876
Total 208 648 170 969 206 578 246 420 251 763
Source: KKP (2013a)
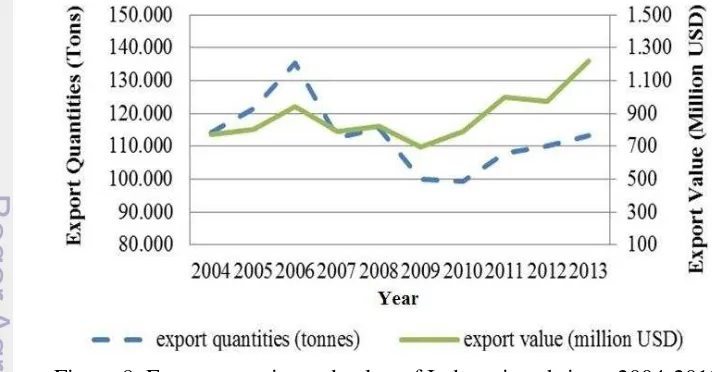
Development of Indonesian shrimp export quantity and value is shown in Figure 8. The export quantity of exported shrimp has been fluctuated through years. From 2004 to 2006, the export quantity increased as well as the production. However, tariff barriers which were set by importing countries and global economic crisis had caused a decline in the export quantity and value of Indonesian shrimp until the end of 2009. Yet, better global economic situation in the first quarter of 2010 influenced the world shrimp demand which also improved the shrimp trade afterward (GLOBEFISH 2009; FAO-GLOBEFISH 2010).
Figure 8 Export quantity and value of Indonesian shrimp, 2004-2013 Source: UNCOMTRADE (2014)
for Indonesian frozen shrimp with 62 thousand tons import quantity or 43 percent share, followed by Japan with 29 thousand tons or 20 percent share and the EU with 6 thousand tons or 4 percent share (UNCOMTRADE 2014).
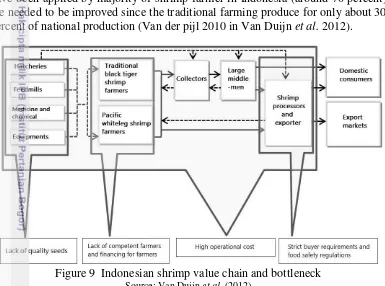
Report released by Ministry of Foreign Affairs of the Netherlands (Van Duijn et al. 2012) indicated that several bottlenecks have been covering shrimp farming sector in Indonesia (Figure 9). High price of high quality shrimp fry (seed) and broodstock, high dependence of imported shrimp feed ingredients, and unregistered medical and chemical product used in the production are main problems regarding the input. In addition, traditional production techniques which have been applied by majority of shrimp farmer in Indonesia (around 70 percent) are needed to be improved since the traditional farming produce for only about 30 percent of national production (Van der pijl 2010 in Van Duijn et al. 2012).
Figure 9 Indonesian shrimp value chain and bottleneck Source: Van Duijn et al. (2012)
Figure 9 above also illustrates that there are two chains of how shrimp is collected before it enters the processing and exporting stage: 1). Shrimp is collected by collectors and middlemen, either directly from the farmers or shrimp is brought to the agreed collecting point and 2). Shrimp is brought directly to the processor and exporter from the farming location. Despite middlemen can maintain the shrimp traceability, shrimp yield collected from this chain is tend to have low quality regarding hygiene and food safety (EU 2010 in Van Duijn et al. 2012).
Furthermore, to meet the international safety and quality standards, trading partners or importer countries (through WTO or not) should help shrimp farmer in the exporting countries by providing technical assistance, including technology transfers, equipment, expertise and training, and also trade facilitation. Above all, government should be able to provide better shrimp business environment and to promote new shrimp business investment as well (Oktaviani and Erwidodo 2005).
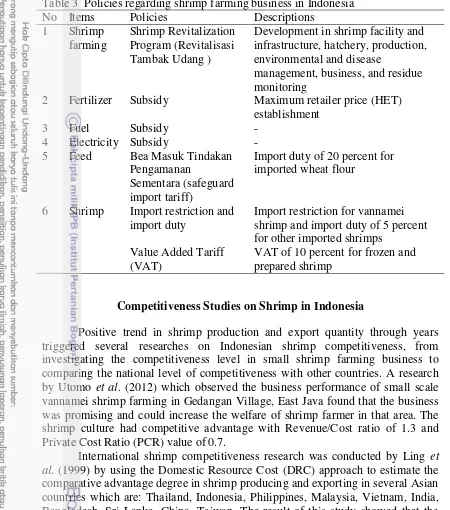
Along with the increasing challenge in national shrimp farming, government has made and applied policies regarding the technical and economical side of shrimp culture. Current implemented policy regarding the technical practice in shrimp farming is shrimp revitalization program which is a part of the Marine and Fisheries Industrialization Policy. As stated in Peraturan Menteri Kelautan dan Perikanan Republik Indonesia Nomor PER.27/MEN/2012 and Keputusan Menteri Kelautan dan Perikanan Republik Indonesia Nomor 7 /KEPMEN-KP/2013, activities in Shrimp Revitalization Program including the development in shrimp facility and infrastructure, hatchery system (certification), production system, environmental and disease management system, and business system (institution, financial capital, investment) as well as the chemical and biological residue monitoring in shrimp product.
Taken from the WTO terminology, all non-trade distorting subsidies, including general service (research, disease control, extension and marketing service, infrastructure) also environmental and regional assistance program fall under the green box (WTO 2002, Lokollo 2007). Therefore, current domestic support in shrimp farming which is applied in Indonesia, that is Shrimp Revitalization Program, is also included in the green box of WTO.
Moreover, trade policies associated with the shrimp farming are input subsidy, tariff, and import restriction. Report of PATTIRO-USAID (2011) explained that fertilizer subsidy for agricultural input has been spent since 2006 by setting the maximum retailer price (Harga Eceran Tertinggi or HET) of subsidized fertilizer and managing the distribution channel. Since the year 2012, government of Indonesia has set import duty of 20 percent for imported wheat flour in order to protect domestic industry (Peraturan Menteri Keuangan Republik Indonesia Nomor 193/PMK.Oll/2012). However, this policy impacts on the shrimp industry which use wheat flour as raw ingredient in commercial feed shrimp. The import duty implementation will increase the production cost in consideration of the major share of shrimp farming production cost is the feed cost (around 60 percent).
Table 3 Policies regarding shrimp farming business in Indonesia
No Items Policies Descriptions
1 Shrimp
2 Fertilizer Subsidy Maximum retailer price (HET) establishment
6 Shrimp Import restriction and import duty
Import restriction for vannamei shrimp and import duty of 5 percent for other imported shrimps
Value Added Tariff (VAT)
VAT of 10 percent for frozen and prepared shrimp
Competitiveness Studies on Shrimp in Indonesia
Positive trend in shrimp production and export quantity through years triggered several researches on Indonesian shrimp competitiveness, from investigating the competitiveness level in small shrimp farming business to comparing the national level of competitiveness with other countries. A research by Utomo et al. (2012) which observed the business performance of small scale vannamei shrimp farming in Gedangan Village, East Java found that the business was promising and could increase the welfare of shrimp farmer in that area. The shrimp culture had competitive advantage with Revenue/Cost ratio of 1.3 and Private Cost Ratio (PCR) value of 0.7.
International shrimp competitiveness research was conducted by Ling et al. (1999) by using the Domestic Resource Cost (DRC) approach to estimate the comparative advantage degree in shrimp producing and exporting in several Asian countries which are: Thailand, Indonesia, Philippines, Malaysia, Vietnam, India, Bangladesh, Sri Lanka, China, Taiwan. The result of this study showed that the level of comparative advantage was higher in intensive farming than that in semi-intensive and extensive farming. Furthermore, shrimp farming in Sri Lanka, Thailand and Indonesia relatively had stronger comparative advantage than that in the remaining countries with RCR (DRC/nominal exchange rate) index of 0.18, 0.24 and 0.31, respectively.
Japan and the US market up to the year 2000. Yet, activities regarding cost efficiency, including cost for marketing and quality enhancement, should continuously to be done as strategy to improve the shrimp competitiveness (Tajerin and Noor 2004).
Furthermore, Juarno (2012) who analyzed the factors which influenced the Indonesian shrimp supply, demand and competitiveness in the world market using 2SLS model, Revealed Comparative Advantage (RCA) index and Constant Market Share Analysis (CMSA) model, found that Indonesia has comparative advantage by exporting shrimp to Japan, the US and the EU. However, the CMSA result showed that the Indonesian export competitiveness was caused by product and market specific effect, not commodity and market distribution effect which means that Indonesia needs to be more diversified both in product and market.
Above all, a research comparing shrimp export competitiveness of Indonesia and Thailand, both to the US with RCA index as the indicator and data collected from the year 1989 until 2010 showed that the RCA values of Indonesia were higher than one, reflecting export competitiveness of Indonesian shrimp in the international market. However, Indonesia remained relatively disadvantaged compared with Thailand. Thus, improvement in the infrastructure, i.e. shipment network, packaging, and transportation is needed to strengthen Indonesian shrimp export competitiveness (Wati et al. 2013).
Policy Analysis Matrix Studies on Shrimp in South East Asia
Since agricultural business activities and government policy cannot be separated, Pearson et al. (2003) explained that PAM analysis is one approach to observe the impact of the government policies on agricultural business, or in this case, on shrimp farming. Studies on shrimp competitiveness in South East Asia have been found frequently. However, research about competitiveness on shrimp farming with respect to the government policies has not widely performed.
To determine the level of Vietnam shrimp competitiveness with regard to the national policy impact, Kiet and Sumalde (2008) compared the intensive and semi intensive shrimp farming in Mekong River Delta Area in 2005 by using several methods (RCA or Revealed Comparative Advantage approach, PAM approach, NSP or Net Social Profitability, NPP or Net Private Profitability, and sensitivity analysis) to find the effect of changes in factors influencing the competitiveness. Result of the study showed that Vietnam shrimp has comparative (DRC=0.12) and competitive advantage (DRC*=0.08) in the world market. Thus, the comparative advantage is strongly sensitive to the changes of feed price, exchange rate, shrimp yield, and export price.
showed that the shrimp producers acted as taxpayers for total input cost. The PAM indicator also explained government policy had not protected the shrimp industry in Malaysia.
Sriboonchitta et al. (2000) conducted a research to measure the shrimp competitiveness degree in Thailand and other Asian countries (China, India, Indonesia, Malaysia, Philippines, Taiwan, Thailand, Sri Lanka) using PAM approach and RCA (Revealed Comparative Advantage). The result showed that all countries had comparative advantages in producing shrimp. However, since Thailand was observed to have the lowest cost of production among other countries, shrimp farming in Thailand was considered to be fully supported by the government policy.
3 FRAMEWORK
Theories related to this research, namely theory of competitiveness, agricultural policy, policy analysis matrix, and social price are explained in this chapter. Moreover, operational framework depicting the comprehensive guide about this study is illustrated in the last subchapter.
Theory of Competitiveness
High possibility to obtain goods (and services) which cannot be produced domestically has triggered countries involved in international trade. Moreover, another reason which underlies countries in joining the trade is to gain profit by purchasing products from other countries where it costs comparatively less to produce them. Later, domestic resources related to the production of those high cost products will be allocated in producing other products which have competitiveness in the world market (Caballero et al. 2000).
Variation of policy analysis needs, opinions, and objectives for research results in various concepts and measurements of competitiveness (Bojnec and Ferto 2009 in Saptana 2010). Thus, the concept of competitiveness may be viewed in several perspectives, i.e. business and economic. In terms of business perspective, competitiveness is defined as a business concept used as basic of many strategic analyses in order to improve firm performance (Lall 2001 in Saptana 2010).
The only meaningful concept of competitiveness at national level, as stated by Porter (1990), is productivity which depends both on the product quality and the production efficiency. Moreover, Porter created a concept which become determinants of national competitive advantage, termed Porter Diamond and consisted of four attributes, those are: 1). Factor conditions, that is the position of nation in production factors, i.e. skilled labor or infrastructure, 2). Demand conditions, mean the nature of domestic market for product and service produced by industry, 3). Related and supporting industries, in respect of their presence or absence, and 4). Firm strategy, structure, and rivalry, which focus on the condition regulating how national companies are created, organized, and managed, including the nature of domestic rivalry. Furthermore, the World Competitiveness Book published by Institute for Management Development (IMD) defined four groups of variable indicating national competitiveness, namely economic performance, government efficiency, business efficiency, and infrastructure (Arslan and Tathdil 2012).
At firm level, competitiveness is reflected in the ability of a firm to produce in lower cost and higher quality. Thus, important factors determining firm competitiveness are quality, cost, and the price level (Düzgün 2007 in Arslan and Tathdil 2012). Later, Buckley et al. (1988) stated that as countries cannot have international competitiveness for all commodities, having comparative advantages in selected products is the only way to gain competitiveness. Therefore, improving performance of firms is necessary since competitiveness is reflected in the improvement of profit performance in the long-run. Similar to Buckley, Lall (2001) in Saptana (2010) defined firm competitiveness as the ability of firm to do better in sales, market shares, or profitability compare to rival firms. Moreover, Liargovas and Skandalis (2008) mentioned that there are three indicators of financial performance in measuring firm competitiveness, those are return on assets, return on equity, and return on sales.
However, Depperu and Cerrato (2005) described that measures of competitiveness today should be seen beyond market-based indicator, which means that the measure also need to include other variables, e.g. innovativeness and social aspects such as ethical standing, social responsibility, working conditions of employees, etc. Finally, as explained by CAMBRIDGE ECONOMETRICS et al. (2002), competitiveness resides in the firm ability to produce products which meet the market requirement, consistently and profitably. Thus, to remain in the business, any firm should fulfill the requirements needed.
Apart from competitiveness concept in economic perspective, issue of regional competitiveness is also discussed frequently. Kitson et al. (2004) described regional (urban) competitiveness as the success with which regions and cities compete one another, probably over shares of national and/or international export markets or capital or workers. However, of particular, the value of regional competitiveness focuses on the determinants and dynamics of the long-run prosperity of a region in competing over shares of market and resources. Thus, competitive region is the place where both companies and people want to locate and invest in.
of value added, excludes all protection provided by government, i.e. export subsidies and import barriers. Later, CAMBRIDGE ECONOMETRICS et al. (2002) assumed that competitiveness of a region exists not only in the competitiveness of individual firms and their interactions, but also in wider assets, concerning social, economic, institutional and public attributes of the region itself. Thus, the concept of regional competitiveness includes qualitative factors and conditions as well as quantifiable attributes and processes. In addition, the sources of regional competitiveness may also create at various geographical scales, from the local, through regional, to national and even international.
Other concept of competitiveness focuses on the ability of producer to compete or to sell products that meet the demand requirement, and also to be profitable at the same time. Moreover, competitiveness can be revealed by several indicators such as profitability and efficiency which also can be seen from the level of competitive and comparative advantages of a commodity (Pearson et al. 2003; OECD 2001 in Wolff et al. 2007; Latruffe 2010).
Comparative advantages are gained when a producer is relatively more efficient than other producers in utilizing domestic resources or factor endowments to produce goods (Ricardo 1806 in Wolff et al. 2007; Ohlin 1933 in Wolff et al. 2007). Comparative advantage is investigated by calculating agricultural business profitability at social or efficiency prices, or when all distorting policies have been excluded (Pearson et al. 2003). Later, one indicator used in calculating comparative advantages level is Domestic Resource Cost or DRC. There are two forces to stimulate the higher comparative advantage or smaller value of DRC, those are 1). The world price increase of exportable commodities and 2). The cost reduction for input uses (Ling et al. 1999).
Competitive advantages appear as a combination result of comparative advantages and market distortions (Gonarsyah 2007 in Juarno 2012). Competitive and comparative advantage would be the same only when the market is in perfect competitive condition, in other word, when policy distortions (both direct and indirect government interventions) and market failures do not occur (Kannapiran and Fleming 1999). Thus, competitive advantage is determined by measuring the profitability of agricultural business system at actual market prices or under existing policies.
Agricultural Policy Analysis
Table 4 Classification of commodity price policy Instrument Policies affecting
producers
Policies affecting consumers
Subsidy policies: Producer subsidies Consumer subsidies 1. That do not change
P : Policy affecting producers C : Policy affecting consumers I : of importable goods
E : of exportable goods
Subsidy Policy on Output
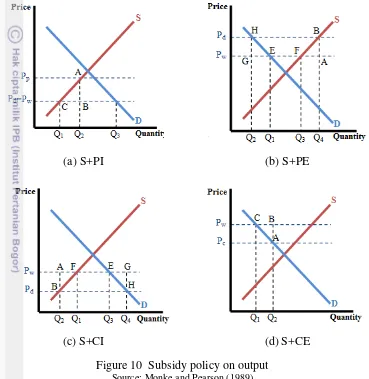
Subsidy policy on output is divided into producer subsidy on importable output, producer subsidy policy on exportable output, consumer subsidy on importable output, and consumer subsidy for exportable output. Producer subsidy on importable output (S+PI), which is shown in Figure 10(a) increases the domestic payment to producers (Pp) above the world market price (Pw). Thus, it raises the domestic production from Q1 to Q2. Yet, consumption remains stable in Q3. Later, import quantity decreases from Q3-Q1 to Q3-Q2. Subsidy causes efficiency loss shown as area CAB. However, this policy turns out well in increasing domestic production to replace import. Mechanism of producer subsidy policy on exportable output (S+PE) can be found in Figure 10(b). This subsidy increases domestic price (Pd) above the world price (Pw) that also elevates the domestic production from Q3 to Q4 afterwards. Yet, domestic consumption declines from Q1 to Q2 as a result of the increased of Pd to Pd’. Efficiency loss is shown as area ABHG. Moreover, the subsidy policy is successful in raising the export quantity, from Q3-Q1 to Q4-Q2 (Monke and Pearson 1989).
consumer price (Pc) below the world price (Pw). Thus, it increases the quantity demanded from Q1 to Q2. Yet, domestic production remains unchanged since domestic price (Pd) equals world market price (Pw). Moreover, sometimes taxes are also imposed in exported output. Love and Lattimore (2009) listed three main reasons why a country taxing its export product, those are to hold down the domestic price of a key product, to gain revenue and to promote certain industries.
(a) S+PI (b) S+PE
(c) S+CI (d) S+CE
Figure 10 Subsidy policy on output Source: Monke and Pearson (1989)
Trade Policy on Output
Trade policy described below is restriction for import and export. Mechanism of import restriction policy (TPI) is illustrated in Figure 11(a). This trade policy, which increases domestic price (Pd) above the world price (Pw), decreases the quantity demanded from Q3 to Q4 afterwards. Yet, the domestic production elevates from Q1 to Q2. Therefore, the import quantity declines from Q3-Q1 to Q4-Q2. Transfer income from consumer, to producer, and to government budget are depicted respectively in the area PdABPw, PdEFPw, and EFBA. Moreover, efficiency losses for producer and consumer are shown as area EFG and ABC, respectively (Monke and Pearson 1989).
from Q3 to Q4. Thus, export quantity shrinks from Q3-Q1 to Q4-Q2. Income transfer from consumer, to producer, and to government budget are shown in the area PdABPw, PdEFPw, and AEFB, respectively. Moreover, export restriction which may have increased domestic supply temporarily, prevented domestic producers in obtaining benefit from higher world price and also increased pressure on prices in importing countries. Thus, this policy may undermine trust between exporter and importer (Love and Lattimore 2009).
(a) TPI (b) TCE
Figure 11 Trade policy on output Source: Monke and Pearson (1989)
Subsidy Policy on Input
Subsidy policy on input is categorized into subsidy policy on tradable input and subsidy policy on non-tradable input. Shown in Figure 12(a), subsidy policy on the production of importable input (S+II) reduces the production cost of agricultural businesses that later shifts the supply curve downward from S to S’. Domestic production increases from Q1 to Q2 afterwards. Moreover, efficiency cost is shown as area ABC. Figure 12(b) reflects the mechanism of tax policy on the importable input (S-II). The policy decreases the domestic supply from Q1 to Q2 as the supply curve shifts upward from S to S’. The efficiency loss (additional cost to the economy) which arose from a wedge formed between the world price and the actual price paid to domestic producers is represented by area ABC (WTO 2006).
(a) S+II (b) S-II
Subsidy policy on non-tradable input affects both producer and consumer as all tradable production is domestically consumed. Subsidy policy on non-tradable input (S+N) is shown in Figure 13(a). The aim of subsidy (Pp-Pc) is to increase the output quantity from Q1 to Q2. Later, the consumer price decreases from Pd to Pc and the producer price raises from Pd to Pp. Thus, the total efficiency loss is shown as area ACD. However, this policy benefits both producer and consumer. Figure 13(b) shows the mechanism of tax policy on non-tradable input (S-N). The same as subsidy policy, the initial equilibrium is Pd in Q1. However, tax policy (Pp-Pc) cuts the output quantity from Q1 to Q2. The consumer price increases from Pd to Pc and the producer price decreases from Pd to Pp. Thus, efficiency losses are shown as area ABD and ABC, respectively for producer and consumer (Monke and Pearson 1989). Introducing a subsidy within a perfect market will be create inefficiency and welfare-diminishing. Yet, relaxed perfect market assumption may create situation where subsidy improves welfare. Thus, subsidy would be useful in correcting market failure as well as bringing social costs, private costs and benefits into alignment (WTO 2006).
(a) S+N (b) S-N
Figure 13 Subsidy policy on non-tradable input Source: Monke and Pearson (1989)
Theory of Policy Analysis Matrix
Table 5 Policy Analysis Matrix
Description Revenue Costs Profit
Tradable input Domestic factor observed. Social prices are estimated prices obtained from social opportunity costs of commodities produced and input used. Comparable world prices (import and export prices) are used to determine social prices for tradable output and inputs. Import prices, represented by CIF prices, reflect the efficiency value of producing an additional ton of an importable commodity as the amount of foreign exchange is saved by replacing a ton of imports. Later, export prices, represented by FOB prices, delineate the social opportunity cost of producing an additional ton of an exportable commodity as the amount of foreign exchange is earned by increasing exports by a ton. CIF price is the price for imported commodity in the entry point of importing country, while FOB is the exported commodity price in the exit point of exporting country (Pearson et al. 2003; Kiet and Sumalde 2008).
Foreign exchange rate is needed to convert world prices of input and output since those are offered in foreign currency. Thus, the shadow exchange rate (SER) is calculated and used. Later, the social price increases the value of tradable goods to allow for the premium on foreign exchange arising from distortions caused by trade policies (Gittinger 1984). However, social prices, for non-tradable goods which have no world prices and are mostly determined by domestic trade, are equal to the observed private prices (Pearson et al. 2003).
Operational Framework
research would be beneficial in observing the shrimp competitiveness level and the impact of government policies on shrimp farming activities as well. Furthermore, several policy scenarios and sensitivity analyses are also applied, respectively to observe the impact of changing in the input and output variables on the shrimp farming competitiveness and to measure the responsiveness of the competitiveness indicator DRC due to changes in the input and output variable. Operational framework is shown in Figure 14.
Figure 14 Operational framework
4 RESEARCH METHOD
This chapter discusses data and methods used in this research. There are two subchapters available. Data collection is explained in the first subchapter. Moreover, empirical analysis, including determination of cost allocation methods, social price calculation, PAM analysis, and also the policy scenario and sensitivity analysis calculation, is described in the second subchapter.
Data Collection
(SWK), respectively located in the Lampung, West Java, and East Java Provinces, Indonesia. Data were collected by internship students of Aquaculture Department, Bogor Agricultural University, Indonesia in 2013.
Two types of data, namely primary and secondary data, are used in this research. The primary data were obtained by interviewing people responsible to the shrimp production in each firm. Moreover, the secondary data were collected from several sources, i.e. UNCOMTRADE, FAO, Ministry of Marine Affairs and Fisheries, Ministry of Trade, Bank of Indonesia, National Electricity Company (PLN), and other related institutions.
Empirical Analysis
Several stages are applied in this research method. Those are determining the cost allocation for input, calculating the social price for input and output, constructing the PAM table, analyzing the indicator of PAM, and conducting the policy scenario and sensitivity analysis.
Determination of Cost Allocation Methods for Input
Direct approach is applied to determine the cost allocation in this study. Referring to Monke and Pearson (1989), cost allocation can be obtained based on two approaches, those are: 1). Total approach, which divides the cost into domestic component and foreign component and 2). Direct approach, which presumes that every input that can be traded internationally is considered as tradable input. This study adopting the direct approach so that inputs such as feed, fertilizer, lime, and fuel are categorized as tradable input while other inputs like fry, labor, electricity, capital, and rent are included in non-tradable input.
Calculation of Social Price for Input and Output
PAM analysis basically compares the difference of private and social prices used in the agricultural business. Private prices are actual prices or market prices of commodities, while social prices or shadow prices or efficiency prices are estimated prices obtained from social opportunity costs of commodities produced and input used (Pearson et al. 2003).
Comparable world prices (import and export prices) are used to determine social prices for tradable output and inputs. Moreover, social valuation for non-tradable inputs is approached by the private price since domestic are mostly determined by domestic supply and demand (Pearson et al. 2003). Shadow prices calculated in this study are for exchange rate, tradable inputs (feed, fertilizer, lime, and fuel), non-tradable inputs (fry, labor, electricity, capital, and rent), and output (shrimp).
Shadow exchange rate (SER)
Standard conversion factor (SCF) is used to convert the tradable goods expenditure to its accounting price (Hughes 1986). The equation is given as:
Data sources for shadow exchange rate calculation are from Statistics Indonesia and Bank Indonesia. Official exchange rate in 2012 was 10 451.37 IDR/USD (Bank Indonesia 2014) while the shadow exchange rate was 10 487.12 IDR/USD (Statistics of Indonesia 2014). Detail calculation can be found in Appendix 1.
Social valuation for output
Fresh vannamei shrimp are the output of the shrimp farming observed in this research. The social price for this shrimp is determined by the FOB price for frozen shrimp (HS030617) in 2013. Furthermore, the FOB price is converted to the Indonesian currency (IDR) by using SER 2013. The converted price is then reduced by transportation and handling cost, processing margin, and processing cost. However, since the FOB price used is for the frozen shrimp, not the fresh one, the conversion factor is applied to convert the frozen shrimp price to the fresh shrimp price. FOB price for shrimp in 2013 was 10.75 USD/kg while the export parity price at pond gate level were 33 235.62 IDR/kg in TPG-Lampung, 35 582.41 IDR/kg in BLUPPBK-West Java, and 30 949.40 IDR/kg in SWK-East Java. Calculation for the social price of shrimp is shown in Appendix 2.
Social valuation for tradable input
Social prices determination for tradable input is approached by the border price (CIF or FOB price). However, the social price for tradable input which has limited information for its border price is determined by reducing the private price with policies applied. Social prices calculations for tradable inputs in this research are for feed, fertilizer, lime, and fuel.
Various feed brand were used in the shrimp farming, such as Irawan, Prima, Luxindo, CJ Feed, Witness, Bintang, Kaiohji, Fengli, Kijang Feed, and
Gold Coin. Despite the commercial shrimp feed is produced domestically, the
price of feed shrimp, those were from 12 000 IDR/kg to 11 657 IDR/kg (TPG-Lampung), from 13 000 IDR/kg to 12 628 IDR/kg (BLUPPBK-West Java), and from 11 900 IDR/kg to 11 560 IDR/kg (SWK-East Java). Detailed social valuation of feed can be found in Appendix 3.
Fertilizer used in the shrimp farming is urea. In consideration of the allocation of subsidized urea for agricultural needs, government strictly manages and controls the urea distribution throughout Indonesia (Keputusan Menteri Keuangan Republik IndonesiaNo.328/KMK.01/1998). Social valuation for urea is approached by using the subtracting result of transportation and handling cost from FOB price. FOB price for fertilizer (HS310210) in 2013 was 0.35 USD/kg while the social prices were 3 322.72 IDR/kg in TPG-Lampung, 3 342.07 IDR/kg in BLUPPBK-West Java, and 3 067.72 IDR/kg in SWK-East Java. Detailed calculation can be found in Appendix 4.
Government charges VAT of 10 percent for lime (dolomite). Since finding the transportation and handling cost for imported lime is too complicated, the industrial diesel fuel that was 9 392.18 IDR/Liter. Yet, since fuel was subsidized, private prices for diesel fuel were lower in TPG-Lampung, BLUPPBK-West Java, and SWK-East Java, those were 7 000 IDR, 5 000 IDR, and 9 040 IDR, respectively.
Social valuation of non-tradable inputs
Non-tradable inputs or domestic factors have no world prices and are mostly determined by domestic supply and demand. Hence, social prices for non-tradable inputs are equal to observed private prices (Pearson et al. 2003). Social prices calculations for non-tradable inputs in this research are for fry, labor, electricity, capital, and rent.
Social prices for vannamei shrimp fry are the same as their private prices since the shrimp fry used in the research location are produced locally. Social price for vanname shrimp fry were 36 IDR (TPG-Lampung), 36 IDR (BLUPPBK-West Java), and 34.6 IDR (SWK-East Java). Regarding to Pearson et al. (2003), labors in rural business are categorized as unskilled labors. Thus, policies concerning labor can be ignored in the analysis of PAM and social valuation for labor is estimated from its private prices. Labors in this study were divided into shrimp farming labor (monthly labor) and harvesting labor (daily labor). However, final price for labor is the total price from shrimp farming labor and harvesting labor, those were 227 751 IDR/person/cycle (TPG-Lampung), 72 857 IDR/person/cycle (BLUPPBK-West Java), and 81 924 IDR/person/cycle (SWK-East Java).
and social prices for electricity were 55 000 000 and 66 997 840 IDR/month (TPG-Lampung), 700 000 000 and 884 210 526 IDR/month (BLUPPBK-West Java), and 443 000 000 and 539 637 149 IDR/month SWK-East Java). Detailed calculation for electricity can be found in Appendix 7.
Furthermore, social price for land is determined by finding the average land rental price in research location, which equals to the private price, that was 666 667 IDR/ha/cycle in TPG-Lampung and BLUPPBK-West Java, also 1 000 000 IDR/ha/cycle in SWK-East Java. Moreover, capital reflects the investment and fixed cost of inputs, such as buildings and equipment, which are commonly used for several periods of production. Buildings included in the criteria were feed warehouse, generator room, guard room, and office. Later, paddle wheel, pump, genset (diesel generator), and laboratory equipment were categorized in equipment. The social price for capital in this research is approached by its depreciation cost those were 312 364 IDR/set (TPG-Lampung), 122 917 IDR/set (BLUPPBK-West Java), and 381 014 IDR/set (SWK-East Java). Social price and budget for shrimp farming in this study is presented in Appendix 8.
PAM Analysis
The PAM analysis is used to measure the competitiveness and the impact of government policy intervention on the agricultural business. The matrix in the PAM (Table 6) defines relationship of the PAM identities, namely the profitability identity (columns) and the divergences or transfers identity (rows). Moreover, ratios are also used in those identities to compare the profitability as well as the inputs or outputs (Pearson et al. 2003).
Table 6 Policy Analysis Matrix (PAM)
Description Revenue Tradable input Domestic factor Costs Profit
Private Prices A B C D
Identities and ratios used in this research are classified into three analyses, namely profitability, competitiveness and policy implications.
Profitability
measures the comparison between the profitability (A) and the cost used (B + C) at actual market price. The higher the ratio, the more competitive the business is (Pearson et al. 2003). The equation of PBCR is given as PBCR = A / (B + C).
Social profit (H) measures comparative advantages (efficiency) of agricultural business by subtracting costs (F+G) from revenues (E) at the social price. Thus, if the social profit is positive, the business is efficient and profitable in terms of its social opportunity cost used (Pearson et al. 2003). The equation of social profit is given as H = E – (F + G). Similar to PBCR, social benefit-cost ratio also measures the comparison between the profitability (E) and the cost used (F+G), but at the social price. The higher the ratio, the more efficient the business is (Pearson et al. 2003). The equation of SBCR is given as SBCR = E / (F+G). Competitiveness
Shrimp farming business competitiveness is reflected by the indicator of competitive and comparative advantages, namely private cost ratio (PCR) and domestic resource cost (DRC). Private cost ratio is a ratio of domestic factor cost (C) to the value added or the difference between the output value (A) and the tradable input cost (B), in the actual market price. The ratio depicts the affordability of the system to pay domestic factors and the stability of it to remain competitive. PCR with value less than one implicates that an agricultural business has competitive advantages (Monke and Pearson 1989). The equation is given as PCR = C / (A - B). However, the DRC indicator measures comparison between domestic factor cost (G) to the difference between the output value (E) and the tradable input cost (F), in their social prices. The ratio of DRC illustrated the affordability of the system to pay domestic factors and the stability of it to remain competitive (efficient). Hence, DRC with value less than one denotes that an agricultural business has comparative advantages (Monke and Pearson 1989). The equation of DRC is given as DRC = G / (E – F).
Policy implications
Indicator of policy impact on shrimp farming business are output transfer (OT), nominal protection coefficient output (NPCO), input transfer (IT), nominal protection coefficient input (NPCI), factor transfer (FT), effective protection coefficient (EPC), net transfer (NT), and subsidy ratio to producer (SRP).
Output transfer measures implicit tax or subsidy on outputs by subtracting revenue in social price (E) from revenue in market price (A). Thus, positive value of OT means that output to some extents are subsidized while the negative value reflects that output to some extents are taxed (Pearson et al. 2003). The equation is given as OT = A – E.
The NPCO ratio is a comparison between the private commodity price (A) with a comparable world price or social price (E). The value of NPCO depicts the degree of output transfer. Therefore, if the value of NPCO is greater than one, the domestic market price is higher than the world price. It means that the agricultural business is protected by government policy (Monke and Pearson 1989). The equation is given as NPCO = A / E.