UNIVERSITI TEKNIKAL MALAYSIA MELAKA
OPTIMIZING THE RACE CAR DYNAMICS AND
PERFORMANCE ON VIRTUAL RACE TRACK
This report submitted in accordance with requirement of the Universiti Teknikal Malaysia
Melaka (UTeM) for the Bachelor Degree of Engineering Technology
(Technology Automotive) (Hons.)
by
OTHMAN BIN RAHMAN B071210345
930227-01-6551
FACULTY OF ENGINEERING TECHNOLOGY
2015
PENGKELASAN LAPORAN PSM SEBAGAI SULIT/TERHAD LAPORAN PROJEK SARJANA MUDA TEKNOLOGI KEJURUTERAAN PEMBUATAN (COURSE NAME): AAA BIN BBB
Sukacita dimaklumkan bahawa Laporan PSM yang tersebut di atas bertajuk “Quality
and Performance Investigation of TiAlN Coated Drill Tools” mohon dikelaskan sebagai *SULIT / TERHAD untuk tempoh LIMA (5) tahun dari tarikh surat ini.
2. Hal ini adalah kerana IANYA MERUPAKAN PROJEK YANG DITAJA OLEH SYARIKAT LUAR DAN HASIL KAJIANNYA ADALAH SULIT.
* Potong yang tidak berkenaan
NOTA: BORANG INI HANYA DIISI JIKA DIKLASIFIKASIKAN SEBAGAI SULIT DAN
TERHAD. JIKA LAPORAN DIKELASKAN SEBAGAI TIDAK TERHAD, MAKA BORANG INI TIDAK PERLU DISERTAKAN DALAM LAPORAN PSM.
•
I hereby, declared this report entitled Optimizing the Race Car Dynamics and Performance
on Virtual Race Track is the results of my own research except as cited in references.
•
APPROVAL
This report is submitted to the Faculty of Engineering Technology of UTeM as a partial fulfillment of the requirements for the degree of Bachelor of Engineering Technology
(Technology Automotive) (Hons.). The member of the supervisory is as follow:
……….
(Mr. Saiful Naim Bin Sulaiman)
also applied in powertrain system where the parameter was chosen and will be optimize too. After that, the suspension and powertrain have through the simulation to identify the best lap’s time. Suspension and powertrain system optimization are conducted in this project in order to produce a race car with optimum performance. The optimizing of suspension and powertrain system setup must follow all the VI-Grade rules and regulations and compete with other race car around the world. At the end of this project, the designed suspension and powertrain system must
be in the best performance as well as it can be used for future development.
Pertandingan Grade adalah satu pertandingan yang direka untuk pelajar anjuran VI-Gred untuk membangunkan idea-idea pelajar, membandingkan reka bentuk dan menguji kereta lumba maya dalam dunia maya. Pertandingan ini telah berkembang di seluruh dunia dan ini adalah cara terbaik untuk mempromosikan UTeM di peringkat global. Objektif projek ini adalah untuk mengkaji dan mengoptimumkan sistem penggantungan dan rankaian kuasa dalam perlumbaan maya untuk mencapai masa pusingan terbaik. Perisian VI-Gred digunakan untuk mengoptimumkan model. Reka bentuk penggantungan yang dipilih akan dioptimumkan melalui beberapa parameter. Kaedah yang sama juga digunakan dalam sistem rangkaian kuasa di mana parameter yang dipilih akan dioptimumkan juga. Selepas itu, penggantungan dan rangkaian kuasa melalui simulasi untuk mengenal pasti masa pusingan terbaik. Sistem penggantungan dan rangkaian kuasa dijalankan dalam projek ini untuk menghasilkan sebuah kereta perlumbaan dengan prestasi optimum. Mengoptimumkan penggantungan dan penghantaran mesti mematuhi semua peraturan dan ketetapan oleh VI-Grade untuk bersaing dengan kereta lain di seluruh dunia. Pada akhir projek ini, sistem penggantungan dan rangkaian kuasa yang direka mestilah
cukup prestasi yang optimum yang boleh digunakan untuk pembangunan selanjutnya.
•
DEDICATIONS
This report is dedicated to my family for their endless love, support and encouragement.
•
ACKNOWLEDGMENTS
Alhamdulillah, thanks to Allah because of Him I have the opportunity to have an amazing
experience to successfully finishing this report.
I would like to thank my supervisors, Mr. Nur Rashid Bin Mat Nuri @ Md Din and Mr. Saiful Naim Bin Sulaiman for all guidance, support, and constant encouragement during my research. His guidance helped me in all the time of research and writing of this thesis. I could not
have imagined having a better supervisor and mentor for my Bachelor study.
be done alone.
Last but not least, thanks to the continuous support and encouragement from my family and all of my friends in Universiti Teknikal Malaysia Melaka, and the others who somehow involve whether directly or indirectly in the completion of this project. Their help and guidance
really mean a lot.
Figure 2.2: A Second Type Coil Spring Is Mount (Güler, 2006). ... 5
Figure 2.3: Equal Length Double Wishbone and Parallel (Unlusoy, 2000). ... 6
Figure 2.4: Unequal Double Wishbone and Parallel (Unlusoy, 2000). ... 6
Figure 2.5: Unequal Double Wishbone and Non-Parallel (Unlusoy, 2000). ... 7
Figure 2.6: Position of Pushrod Is Mount (www.Mae.Ncsu.Edu) ... 8
Figure 2.8: Toe Link Position in Double Wishbone Suspension (www.eliseparts.com). 9 Figure 2.9: Left And Rear View of a Wheel and Its Suspension Showing That the Force Line
Runs through the Tire Contact Patch (van den Bos, 2010). ... 10
Figure 2.10: Pushrod Actuated Shock Design (David, 2011) ... 11
Figure 2.11: Direct Acting Shock Design (David, 2011). ... 11
Figure 2.12: Testing Machine. ... 13
Figure 2.13: Anti-Roll Bar Position (Shinde et al,. 2013). ... 15
Figure 2.14: Anti-Roll Bars Attached At Double Wishbone Suspension. Another One Side Crossing Over The Road Bump (Shinde et al,. 2013). ... 16
Figure 2.15: Vertical Line On Side of the Wheel (Iman et al,. 2010). ... 17
Figure 2.16: Time Variation of Lateral Force for Positive Camber Angle (Rajvardhan et al,. 2010). ... 18
Figure 2.17: Time Variation of Lateral Force for Negative Camber Angle (Rajvardhan et al,. 2010) ... 18
Figure 2.18: The Graph of the Center of Gravity Displacement for Single Sinusoidal Manoeuvre (Albinsson et al,. 2013). ... 20
Figure 2.19: Camber Curve, Baseline (Wolfe, 2010). ... 21
Figure 2.20: Bump Steer, Baseline (Wolfe, 2010). ... 21
Figure 2.21: Roll Center Height, Symmetric Jounce/Rebound, Baseline (Wolfe, 2010). 22 Figure 2.22: Roll Center Location, Cornering, Baseline (Wolfe, 2010). ... 22
Figure 2.23: Transmission System (Amir, 2007). ... 22
Figure 2.24: The Position of Synchronizers (yellow) In Drivetrain Shaft. ... 24
Figure 2.25: Acceleration Curve (Kirtane et al,. 2013). ... 27
Figure 2.26: Graph of Transmission Torque versus Transmission Engine Speed (Chan, 2000). ... 29
Figure 2.27: Effect Final Gear Ratio on Vehicle Performance (Wang et al,. 2013). . 31
Figure 3.1: Reseach Design Flow ... 34
Figure 4.1: VI-Grade Virtual Track. ... 44
Figure 4.2: List Type of Suspension. ... 46
Figure 4.3: Graph of Time Laps vs. Front K Spring. ... 47
Figure 4.4: Graph of Time Laps vs. Rear K Spring. ... 48
Figure 4.5: Graph of Maximum Speed vs. Front K Spring. ... 49
Figure 4.6: Graph of Maximum Speed versus Rear K Spring. ... 49
Figure 4.7: Graph of Time Laps versus Front Jounce. ... 51
Figure 4.8: Graph of Time Laps versus Rear Jounce. ... 52
Figure 4.9: Graph of Maximum Speed versus Front Jounce. ... 52
Figure 4.10: Graph of Maximum Speed versus Rear Jounce. ... 53
Figure 4.11: Graph of Time Laps versus Camber Angle ... 54
Figure 4.12: Graph of Maximum Speed versus Camber Angle. ... 55
Figure 4.14: Graph of Maximum Speed versus Torsion. ... 57
Figure 4.15: Comparison Result of Gear Shifting. ... 60
Figure 4.16: Graph of Time Laps vs. Final Drive Ratio. ... 61
Figure 4.17: Drive Ratio and Result ... 63
Table 2.1: Physical Properties of NTC01 and Steel 65G (Waldemar, 2006). ... 13
Table 2.2: Result Testing (Waldemar, 2006). ... 14
Table 2.3: Transmission Ratio(Moawad et al,. 2012). ... 25
Table 2.4: Final Drive Ratio and Vehicle Performance (Moawad et al,. 2012). ... 26
Table 2.5: torque, flywheel rpm, number of gear and gear ratio data ... 27
Table 2.6: Optimal Shift Point Table (Chan, 2000). ... 30
Table 2.7: Time To Speed For Different Final Drive Ratios (Ales et al,. 2010). ... 31
Table 3.1: Default Parameter of LUCA and Double Wishbone with Pushrod. ... 36
Table 3.2: Spring Stiffness Will Be Tested. ... 37
Table 3.3: Jounce Start and Jounce End. ... 38
Table 3.4: Camber Angle ... 39
Table 3.5: Torsion Stiffness ... 39
Table 3.6: Sample of Gear Shifting Will Be Tested ... 40
Table 3.7: Sample of Final Drive Ratio Will Be Tested. ... 41
Table 3.8: Gear Ratio Testing. ... 42
Table 4.1: Parameter and Result of Default Suspension. ... 45
Table 4.2: Result of Time Laps and Maximum Speed for K Spring. ... 47
Table 4.3: Result of Time Laps and Maximum Speed for Jounce Start and Jounce End. 51 Table 4.4: Result of Laps Time and Maximum Speed for Camber Angle. ... 54
Table 4.5: Result of Time Laps and Maximum Speed for Torsion. ... 56
Table 4.6: Comparison of Default and Optimize Setting and Result. ... 58
Table 4.7: Default Value of Powertrain and Result ... 59
Table 4.8: Different Gear Shifting Tested. ... 59
Table 4.10: Drive Ratio and Result. ... 63 Table 4.11: Powertrain Optimize Setting and Result ... 64
•
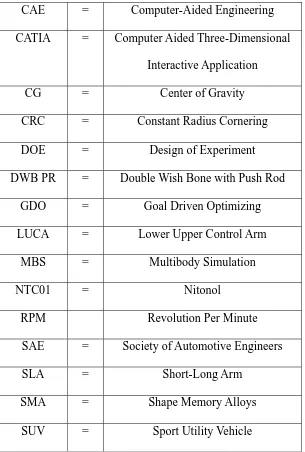
LIST OF SYMBOLS AND ABBREVIATIONS
CAE = Computer-Aided Engineering
CATIA = Computer Aided Three-Dimensional
Interactive Application
CG = Center of Gravity
CRC = Constant Radius Cornering
DOE = Design of Experiment
DWB PR = Double Wish Bone with Push Rod
GDO = Goal Driven Optimizing
LUCA = Lower Upper Control Arm
MBS = Multibody Simulation
NTC01 = Nitonol
RPM Revolution Per Minute
SAE = Society of Automotive Engineers
SLA = Short-Long Arm
SMA = Shape Memory Alloys
SUV = Sport Utility Vehicle
This project was focused on how to optimize the virtual race car dynamic and performance to achieve the best lap’s time using VI-Grade software. At the early stage of optimizing, there are two system required to be optimize on the virtual race car which are the suspension and powertrain. There are range of parameter that can be change based on rules and regulation given. In both system there is specific parameter should be determine in order to achieve the requirement of handling, stability and performance of the race car. A several type of suspension available for the virtual race car such as LUCA (lower upper control arm), double wishbone pushrod, double wishbone pushrod and U-bar and each default setting will reflect to various characteristic in virtual race car. The suspension parameters such as k-spring, jounce start, jounce end, chamber angle, toe angle and anti-roll bar are interrelated to the handling and stability of the virtual race car. The type of suspension use also give an important roles to make the race car stay on the track without understeer or oversteer. Since the displacement and engine power are fixed, powertrain configuration is the only option can be customized in order to increase the speed of the virtual race car. Powertrain is the system that drives the vehicle such as gearbox and differentials which require configuration of suitable gear shafting. Furthermore, gear ratio also must be setting for the correct timing gear when cornering and straight line acceleration by estimating the transmitted torque on each gear. Suspension and powertrain system are the most critical issue in order to achieve the best laps time while engine power cannot be changed. In this
study, type and parameter of suspension and powertrain was selected, configured and analysed.
• Problem Statement
The suspension system that commonly used on racing car are usually have fixed parameter which is difficult to tune in order to achieve high performance and might be far away from its optimum setting. Therefore, to test the suspension physically would take much costs and time. Same situation on powertrain system where the transmission must be configured in order to achieve top performance. To overcome this problem, multibody simulation (MBS) software is used to test and optimize the problem of both system. There are many software can be used such as ADAMS, CarSim and MatLab. Currently there is a new MBS software namely VI-Grade in the market which sparks interest among users due to its flexible parameters that can be changed directly. VI-Grade allows more parameters can be tested and the result is more in-depth compared to other software. In VI-Grade software, the parameter can be change and directly tested to the virtual race track. Therefore, it will be easier to understand the problem of the
system and find the optimum setting for each parameter.
• Objective
The objective of this study is:
i. To optimize the virtual race car dynamics and performance using VI-Grade.
ii. To achieve the best lap’s time at racing track on VI-Grade track.
• Scope
• Optimize the suspension of the virtual race car dynamics to achieve the best laps time.
• Optimize the powertrain of the virtual race car performance to achieve the best laps time.
Suspension system are very important in an automobile industry. It also give an important role to safety and the comfort of driving. The suspensions responsibility is quite large because it need to carry out the vehicle body and absorb forces between the road and the body was transmitted into the suspension. The most importance functions in this suspension system is to isolate the structure and passenger from various vibrations and shocks produced by the surface of
the road (Güler, 2006).
In suspension system there are components such as damper and spring to improve the driving comfort and increases the safety. To control the behaviour of the components, high knowledge about suspension system is required in order to adapt the parameter such as spring stiffness, damper, etc. This also requires the identification and detecting the fault involved. The suspension is designed with the goal of keeping all four tires flat on the ground throughout the performance range of the vehicle. Generally, suspension systems are designed under an assumption that the frame is a rigid body. Packaging of the suspension to the frame is generally not an interference problem since most of the components are outside the frame. However, it is important to attach the suspension components to stiff portions of the chassis to correctly
distribute the loads that will be passed through these components (Edmund et al., 1996).
• Type of Suspension
Type of suspension used for this literature review is double wishbone and solid axle.
Each type of suspension have their own function and will be discussed in details in this chapter.
• Double Wishbone
Double wishbone suspension is designed using two A shaped of arm that are attached to the chassis with spring and shock absorber. Two mounting was setup on the chassis of the car and another was located to the wheel. This two rods was mounted at two point is called double wishbone setup (Patil, 2013). The shock absorber and spring is mount at chassis. Usually they have unequal length of arm which is known as SLA (short-long arm). Double wishbone suspension design to allow the engineer to control the parameter such as camber angle, toe angle,
roll center height etc. to give good performance (Berkum, 2006).
The geometry of double wishbone suspension system design with spring and absorber give an importance role to improve the stability of the vehicle. This suspension also give more stability to the movements during high speed, where the camber angle can be reduced as the wheel is moving in rough surface road (Patil, 2013). This type also easy to make adjustment of the parameter such as camber because this type of suspension system will give the camber angle
to become more negative (Vivekanandan et al., 2014).
The design of coil spring will give advantage to the suspension system especially for the front suspension. There are two types of technique for coil spring is mount. First, the spring located between frame and lower control arm as shown in Figure 2.1. In this case, most of the load was carried by the lower arm. Second type of mounting where the spring is located between upper control arm and above of the frame as shown in Figure 2.2. Upper arm and the spring mount to absorb almost the load. However, the second type is not popular since it is consume a
lot of space (Güler, 2006).
Figure 2.1: A First Type Coil Spring Is Mount (Güler, 2006).
Figure 2.2: A Second Type Coil Spring Is Mount (Güler, 2006).
There are advantages when using the unequal length of double wishbone suspension system. Unequal length of double wishbone suspension is used to maintain stabilization and have
suitable roll center (Shun-Kai et al., 2006).
Unequal length of double wishbone suspension also can maintain good traction between the road and tire and reduce the interference between suspension and steer bar. With the proper structural parameters and arrangements, it effects the parameter of wheel spin and wheel location floating in permissible range. For formula SAE car, stabilization with high speed is more
important than ride comfort (Liu et al., 2013).
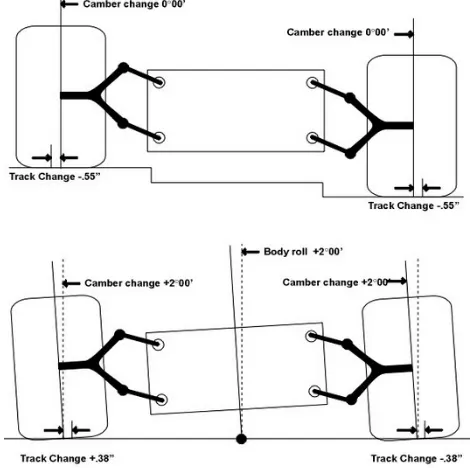
suspension do the job well for keeping the tire perpendicular to the ground (Attia et al., 2001). Double wishbone suspension have three type of arm. The first one is the wishbone are equal length and parallel as shown in Figure 2.3. The second one is the wishbone with unequal length and parallel suspension system as shown in Figure 2.4. Lastly, unequal length and
non-parallel wishbone suspension system as shown in Figure 2.5 (Unlusoy, 2000).
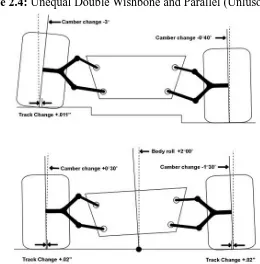
Figure 2.4: Unequal Double Wishbone and Parallel (Unlusoy, 2000).
Figure 2.5: Unequal Double Wishbone and Non-Parallel (Unlusoy, 2000).
degree change. The changing of camber will reduces the contact patch area between the tire and the ground. The tire tend to be slip and the gripping will reduce. Then, unequal length double wishbone and parallel was invented by engineers. The changing of camber and track width give a huge effect of reducing the body roll, but under bump there are some small trade-off in wheel control as shown in Figure 2.4. For unequal length and non-parallel double wishbone, camber angle during heavy loaded does not much effect the outside wheel and also it is not too good
under bump as shown in Figure 2.5 (Unlusoy, 2000).
• Pushrod Suspension
During racing, pushrod style suspension was chosen due to its easy adjustability. This type of suspension is used so that the spring and damper is mounted with the bell crank to give better absorption of large wheel loads. By moving the spring into the frame it can reduce the
car’s drag and this design will improve the performance of race cars (Bayer, 2009)
The alternative suspension that suitable for a race car is the pushrod system. The pushrod is mounted on the lower A-arm and its mount with bell crank near the top of the frame which can be seen in Figure 2.7. The damper can be mounted in a different orientation, in the figure show the damper mounted vertically. The pushrod is mounted on the upper or lower A-arm. This design will introduce a bending moment on the rods. The rods was made up by carbon fibre and coated with aluminium to hold the rods ends. As the result, the rods are high level of strength and
stiff in compression and tension. However, it cannot stand from bending (van den Bos, 2010).
Figure 2.7: Pushrods Suspension System Configuration (van den Bos, 2010).
During the race car take corner, the upper A-arm will experience tension, as the lower arm is in compression. There are 1.8 times higher the compressive force than the lateral tire force because of the force between the upper and lower wishbone and the ground surface. The failure of the system can happen when the lower connection rods of the system is longer than the upper connection rods. To avoid the failure of the pushrods suspension system, the toe link is mount on the same as the lower connection rods as shown in Figure 2.8. By choosing a suitable pushrod
configuration, it can reduce the load per rod more (Hwang et al., 2007).
Figure 2.8: Toe Link Position in Double Wishbone Suspension (www.eliseparts.com).
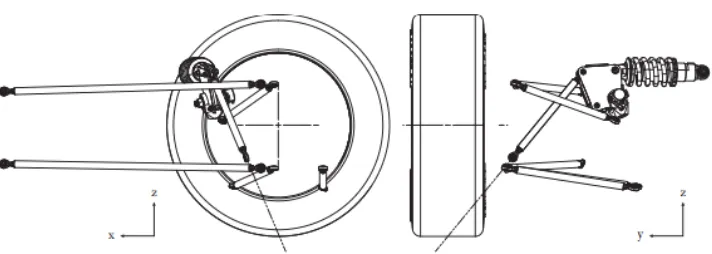
There are some theory that explain by van den Bos, (2010) when a vehicle hit a bump,
the upper connection rods, which are under tension from the lateral tire forces are (partially) unloaded. The compressive cornering force on the lower ones will also be reduced or switched to tensile. Then, the pushrods was setup on the center line of the tire as can see in Figure 2.9 and the toe link is mounted to the lower arm. As a result, this will create better distribution of load
between connection rods (van den Bos, 2010).
Figure 2.9: Left And Rear View of a Wheel and Its Suspension Showing That the Force Line
Runs through the Tire Contact Patch (van den Bos, 2010).
designing the bell crank and mount on the chassis members. By adding those thing above, the result is the center of gravity will be slightly higher. The design also could be heavier than
another suspension design as showed in Figure 2.10 (David, 2011).
Figure 2.10: Pushrod Actuated Shock Design (David, 2011)
The second method where the shock is actuated by the control arm directly. As the result, the design has decrease the moving part, easily to manufacture, and it require a minimum changes to the existing design. The shock directly located on the control arm partially contributes the unsprung weight. This will affect the ride and gripping when the wheel wants to keep contact with the road. Manufacturing cost of this design is also lower than a pushrod design. The idea of
Figure 2.11: Direct Acting Shock Design (David, 2011).
• Parameter Involve In Suspension
In this subtopic will explain the detail about parameter involve in suspension system. There are some types of parameter involved such as spring stiffness, anti-roll bar, chamber angle, etc.
• Spring Stiffness
Springs are generally purchased off the shelf and offer no tuning ability. Instead, many different stiffness with different spring coefficients may be swapped in and out of the spring/shock system to change wheel response against bump and roll. Typically, spring coefficients are held constant between left and right wheels but may be different between front
and rear (Kane, 2006).
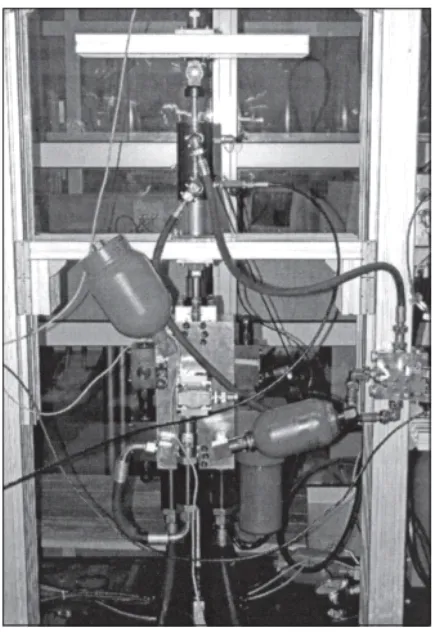
the frequency characteristic. Since spring is related to the frequency, the stiffness must be controlled precisely. To achieve and control the stiffness coefficient, choosing the right element such us elastic element or pneumatic element, and suitable material with controllable variable such as shape memory alloys (SMA) must be considered. Spring allows the design of vibrating system with controllable dynamic characteristic including reduction and vibration-generation systems. Modification of natural frequency was allowed by stiffness coefficient which increases the ability range of certain system and allow perform a solutions. After spring combined with controllable element, the stiffness coefficient value is change. What is the different parameters that will affect the stiffness of spring are shape, dimension, and material properties especially Young modulus of the material. There are various type of spring including helical, ring, disk, diaphragm and flat springs. Comparison was done by Waldemar, 2006 which used different types of the material including Nitonol (NTC01) springs type which are made of by steel 65G. NTC01 was made by two types of material which is martensite and austenite. The physical properties of NTC01 and steel 65G are shown by Table 2.1. Type of spring that be tested is cylindrical helical, cantilever bar, supported beam and tensile bar as shown in Table 2.1. Springs were tested in the experimental set-up shown in Figure 2.12. Table 2.2 shows that result of three parameter with two different properties which is NTC01 and steel 65G. The result of equivalent stress, maximal load and stiffness was founded after the experiment have done. Steel 65G have a strong material as the result is more than another properties and tensile bar is better
material than cylindrical helical, cantilever bar, and supported beam. (Waldemar, 2006).
Parameter name Martensite Austenite 65G
Young modulus 15 GPa 30 GPa 211 GPa
Ultimate tensile stress
1000 MPa 650 MPa 800 MPa
Figure 2.12: Testing Machine.
Table 2.2: Result Testing (Waldemar, 2006).