ANTIMICROBIAL AND ANTIOXIDANT ACTIVITIES OF
MICROWAVE-ASSISTED EXTRACTS FROM COFFEE GROUND
RESIDUE IN CHIANG RAI PROVINCE, THAILAND
SKRIPSI
ARIESTA ADLINE APRILIA
F24080028
DEPARTMENT FOOD SCIENCE AND TECHNOLOGY
FACULTY OF AGRICULTURAL TECHNOLOGY
BOGOR AGRICULTURAL UNIVERSITY
BOGOR
AKTIVITAS ANTIMIKROBA DAN ANTIOKSIDAN
HASIL EKSTRAKSI GELOMBANG MIKRO AMPAS KOPI
DARI PROVINSI CHIANG RAI, THAILAND
Ariesta Adline Aprilia1, Ratih Dewanti-Hariyadi1, Niramol Punbusayakul2
1
Departemen Ilmu dan Teknologi Pangan, Fakultas Teknologi Pertanian, Institut Pertanian Bogor, IPB Darmaga Kampus, PO. BOX 220, Bogor, Jawa Barat, Indonesia
2
School of Agro-Industry, Mae Fah Luang University, Muang, Chiang Rai 57100, Thailand
ABSTRAK
Ampas kopi adalah limbah utama yang dihasilkan kedai kopi dan biasanya hanya dibuang. Beberapa penelitian menunjukkan bahwa ampas kopi masih mengandung sejumlah kompenen bioaktif. Namun, konsentrasi atau jumlah dari komponen tersebut bervariasi tergantung dari beberapa faktor termasuk metode ekstraksi. Ekstraksi dengan gelombang mikro telah diketahui dapat menghasilkan konsentrasi komponen bioaktif yang tinggi dan hasil tersebut tergantung dari waktu dan suhu ekstraksi. Penelitian ini bertujuan untuk mengevaluasi aktivitas antimikroba dan antioksidan dari ampas kopi yang didapat dari 10 kedai kopi di Provinsi Chiang Rai, Thailand. Pertama, ampas kopi kering (kadar air kurang dari 13%) diperiksa kandungan lignin dan kandungan fitokimianya. Ampas kopi kering dicampur dengan air destilata dengan rasio 1:5 dan campuran diekstrasi dengan microwave pada beberapa waktu ekstrasi (3, 4, dan 5 menit). Setelah itu, campuran tersebut disaring dan dievaporasi dibawah tekanan untuk mendapatkan ekstrak kasar. Ekstrak dari ampas kopi tersebut diperiksa kandungan komponen bioaktifnya yang meliputi total fenolik, asam klorogenik, kafein, dan antosianin. Tiga sampel ekstrak ampas kopi dengan kandungan komponen bioaktif tertinggi diperiksa lebih lanjut aktivitas antioksidan dan antimikrobanya. Hasil penelitian menunjukkan bahwa ekstraksi dengan microwave dapat meningkatkan hasil ekstraksi dan kandungan bioaktif pada ampas kopi. Ekstrak ampas kopi memiliki kandungan total fenolik (126-751 mg/100 g), asam klorogenik (80-222 mg/100 g) dan kafein (12-192 mg/100 g) yang tinggi, namun memiliki kandungan antosianin (3-275 µg/100 g) yang rendah. Sampel B dengan waktu ekstraksi 3 menit (B3) memiliki kandungan bioaktif tertinggi diikuti oleh sampel B4 dan A4. Ketiga sampel ekstrak kopi tersebut juga memiliki aktivitas antioksidan (2.6-3 mmole/ 100 g TE) yang tinggi. Ekstrak ampas kopi memiliki daya hambat terhadap bakteri Gram negatif lebih baik dibandingkan pada Gram positif. Namun, ekstrak tersebut tidak memiliki daya hambat terhadap Pseudomonas aeruginosa. Penelitian ini menunjukkan bahwa ampas kopi berpotensi sebagai antioksidan dan antimikroba.
Ariesta Adline Aprilia. F24080028. Antimicrobial and Antioxidant Activities of Microwave-Assisted Extracts From Coffee Ground Residue in Chiang Rai Province, Thailand. Supervised by Ratih Dewanti-Hariyadi, Niramol Punbusayakul. 2012
SUMMARY
Thailand ranked third in coffee production in South East Asia (International Coffee Organization (ICO), 2012). Chiang Rai is a province in Thailand with the highest production of coffee (Coffea arabica). Nowadays, there are increasing number of coffee shops in Chiang Rai province and in other provinces in Thailand. Coffee beverage is normally made by extracting coffee ground with hot water or brewing. This process left a by-product known as coffee ground residue (CGR). Therefore, there are increasing amount of CGR because of increasing number of coffee shops. Although CGR is normally left in the ground, but the decomposition process is slow and could cause an environmental problem. Furthermore, some reports showed that CGR still contains certain amount of bioactive compounds such as phenolic compounds, chlorogenic acid and flavonoids (Mussato et al., 2011) which also known to have antioxidant and antimicrobial activity.
Recently, microwave assisted extraction (MAE) has been increasingly applied in various phytochemical extractions from plant. This extraction could obtain higher extraction yield and higher bioactive compounds in the extracts (Jain et al., 2009). MAE also led to higher yield of chlorogenic acid, caffeine, and total phenolic in green coffee bean (Upadhyay et al., 2011). The objectives of this research were to investigate the amount of several bioactive compounds in microwave-assisted extract from coffee ground residue obtained from 10 coffee shops in Chiang Rai Province, Thailand, and investigate antioxidant and antimicrobial activity of this extract.
The main ingredient used in this research was CGR obtained from 10 coffee shops in Chiang Rai Province, Thailand. This research was divided into four parts. The first parts were phytochemical screening of CGR and lignin content assay as preliminary research. The second parts were extraction of CGR with hot water and MAE method. The third part was bioactive compounds such as phenolic compounds, chlorogenic acid, caffeine, and anthocyanin assay in CGR. The last part was antioxidant activity (DPPH and FRAP assay) and antimicrobial activity (agar-wells diffusion and micro-broth dilution assay) in three best CGR samples with highest bioactive contents. For the extraction process, the microwave powers used in this study was 800 W. Meanwhile the extraction times used in this study were 3 minutes, 4 minutes, and 5 minutes.
The phytochemical screening revealed that the dried-CGR still have large amount of chlorogenic acid and phenolic compounds. The lignin content in dried-CGR was ranged between 406 – 444 mg/g. The MAE extraction yield from CGR samples ranged between 16.21 – 19.41 %. The highest yield obtained was from 3 minutes of extraction while the lowest was that from 5 minutes of extraction. The improvements in yield were not proportional to the duration of microwave heating. The shorter time of microwave heating gave higher extraction yield. The bioactive compound in material is normally sensitive to high temperature of extraction. Five minutes of extraction resulted in lowest yield, this extract still gave higher extraction yield as compared to that extracted by water. The high temperature and tremendous pressure from microwave energy could leach out the constituents from matrix faster (Mandal et al., 2007).
The bioactive compounds assay of the extracts showed that the phenolic content, chlorogenic acid, caffeine, and anthocyanin of the CGR extract ranged from 126 – 751 mg/100 g, 80 – 222 mg/100 g, 12 – 192 mg/100 g, and 3 – 275 µg/100 g, respectively. Generally, sample B obtained by 3 minutes of extraction (B3) had higher amount of these bioactive compounds followed by B4 and A4. Generally, three minutes of extraction had the highest amount of bioactive compounds than the other extraction time.
The antioxidant activity ranged between 2.6 – 3 mmole/100 g TE and 4.4 – 5.3 mmole/100 g AAE, respectively. The agar-wells diffusion method revealed that the CGR extracts generally could inhibit Staphylococcus aureus, Bacillus subtilis, Listeria monocytogenes, Escherichia coli and Salmonella
inhibition zone between 21 – 24 mm with 1.5 g/ml concentration of extracts. Furthermore, micro-broth dilution method (96-wells) also showed the same results with agar-wells diffusion method. The extracts had bactericidal and/or bacteriostatic activity against the microorganisms.
ANTIMICROBIAL AND ANTIOXIDANT ACTIVITIES OF
MICROWAVE-ASSISTED EXTRACTS FROM COFFEE GROUND
RESIDUE IN CHIANG RAI PROVINCE, THAILAND
MANUSCRIPT
In the partial fulfillment of the requirement for degree of
SARJANA TEKNOLOGI PERTANIAN
At the Department of Food Science and Technology Faculty of Agricultural Technology
Bogor Agricultural University
By
ARIESTA ADLINE APRILIA
F24080028
FACULTY OF AGRICULTURAL TECHNOLOGY
BOGOR AGRICULTURAL UNIVERSITY
Tittle
: Antimicrobial and Antioxidant Activities of Microwave-Assisted
Extracts From Coffee Ground Residue in Chiang Rai Province,
Thailand
Name
: Ariesta Adline Aprilia
Student ID
: F24080028
Approved by,
Advisor,
(Dr. Ir. Ratih Dewanti-Hariyadi, M.Sc)
NIP 19620920.198603.2.002
Acknowledged by:
Head of Departement of Food Science and Technology,
(Dr. Ir. Feri Kusnandar, M.Sc)
NIP 19680526.199303.1.004
STATEMENT LETTER OF MANUSCRIPT
AND SOURCES OF INFORMATION
Hereby I genuinely stated that the manuscript entitled Antimicrobial and Antioxidant Activities of Microwave-Assisted Extracts From Coffee Ground Residue in Chiang Rai Province, Thailand is an authentic work of mine under supervision of academic counselor and has never been presented in any forms and universities. All of the information taken and quoted from published or unpublished works of other writers had been mentioned in the text and attached in the bibliography at the end of this manuscript.
Bogor, February 2013 The undersigned,
© Copyright by Ariesta Adline Aprilia, 2013 All rights reserved
No part of this document may be reproduced or transmitted without prior written permission by Bogor Agricultural Institute in any form or by any means, electronic, mechanical, photocopying, microfilm, and
AUTHOR BIOGRAPHY
Ariesta Adline Aprilia was born in Jakarta on April, 7th 1990. She was graduated from SDK Lemuel II elementary school in 2002, SMPK Lemuel junior high school in 2005, SMA Negeri 112 Jakarta senior high school in 2008. In the same year, she joined Bogor Agricultural University through Undangan Seleksi Masuk IPB (USMI) and she was graduated her bachelor degree of major Food Science and Technology in 2013. She was much involved in student activities such as Badan Esekutif Mahasiswa (BEM) FATETA IPB (2010-2011). Besides, she was also active in committees such as Youth Agro-entrepreneurship Competition (YAC) (2009-2010), BAUR (2010), FBQ (2011) and several internal events in BEM FATETA and ITP 45.
FOREWORD
Alhamdulillahirobbil’alamin, the author would like to thank Allah SWT for the gifts, guidance, and merciful. Shalawat and salam always be to Nabi Muhammad SAW. The research project entitled ―Antimicrobial and Antioxidant Activities of Microwave-Assisted Extracts From Coffee Ground Residue in Chiang Rai Province, Thailand‖ was conducted at the School of Agro -Industry, Mae Fah Luang (MFU, Thailand) under Credit Transfer-MIT Program. The thanks and extensive gratitude of the author to:
1. My parents, Purwito and Luciana Suwarsilah (deceased), and my sister Desti Puspitasari, STP., my big family who always support me, for their love and understanding in my life.
2. My academic advisor Dr. Ir. Ratih Dewanti-Hariyadi, MSc., thank you for the considerable advice.
3. All the faculty member of the Department of Food Science and Technoloy, Bogor Agricultural University, for making the knowledge available.
4. Dr. Niramol Punbusayakul (Ajarn Anne), my kind advisor in MFU who always guided me during my research with her patience and knowledge.
5. The committee in School of Agro-Industry who have evaluated my research during presentation.
6. Directorate General of Higher Education, Ministry of National Education of the Republic Indonesia, which facilitated a student mobility program and for some financial support during MIT program.
7. Randy Oktan Susilo who always gives me supports, idea, encouragement, and prayer, also for his joyfulness, love, and affection for me.
8. All my classmate in ITP 45, especially for Himagabil Girls (Fiqa, Rathih, Gita, Ratna, and Rista), Ana, Citra, Sam hope we will always become one puzzle.
9. My joyful friends, Kontrakan Mami (Rullyana, Galuh, Farah, Ira, Kade, Novya), MIT Student 2012 (Icha, Taufiq, Dhini, Dini, Hafiz, Wilson), friends in MFU (Mameaw, Chase, Ni, Phi Joyce, Phi Noi, Phi Aiw, Emron) and the others (Debian, Nensi, Olin) thank you for the sweet friendship.
10. Laboratory assistants in both MFU and IPB, for the technical assistance and the knowledge sharing.
Finally, I wish this manuscript will be useful for anyone who read.
Bogor, February 2013
i
LIST OF CONTENT
Pages
LIST OF CONTENT ... i
LIST OF TABLES ... iii
LIST OF FIGURES ... iv
LIST OF APPENDIX ... v
I. INTRODUCTION ... 1
A.
Background ... 1
B.
Objetives ... 1
C.
Research Scope ... 1
II. LITERATURE REVIEW ... 2
A.
Coffee Processing ... 2
C.
Microwave Assisted Extraction (MAE)
...
4
D.
Bioactive Compounds ... 5
E.
Antioxidant Activity ... 6
F.
Antimicrobial Activity ... 7
III. RESEARCH METHODOLOGY ... 8
A. MATERIALS AND INSTRUMENTS ... 8
1. Materials ... 8
2. Instruments ... 8
B. EXPERIMENTAL DESIGN ... 8
1. Preliminary Research ... 8
2. CGR Extraction ... 11
3. Bioactive Compound Determination ... 11
4. Antioxidant Activity ... 12
5. Antimicrobial Activity ... 13
6.
Statistical Analysis ... 14
IV. RESULTS AND DISCUSSIONS ... 15
A. PHYTOCHEMICAL SCREENING AND LIGNIN CONTENT OF CGR
SAMPLES
... 15
1.
Phytochemical screening ... 15
ii
B.
EXTRACTION OF CGR
... 17
C.
BIOACTIVE COMPOUNDS IN COFFEE GROUND RESIDUE (CGR)
... 18
1.
Total Phenolic Compounds (TPC) ... 18
2.
Chlorogenic Acid Compounds (CGA) ... 19
3.
Caffeine ... 20
4.
Anthocyanin ... 20
D.
Antimicrobial Activity of Coffee Ground Residue Extract
... 23
1.
Agar-wells diffusion method ... 23
2.
Micro-broth Dilution Method (MIC and MBC Determination) ... 24
V. CONCLUSION AND RECOMMENDATION ... 26
1. CONCLUSION ... 26
2. RECOMMENDATION ... 26
REFERENCES ... 27
iii
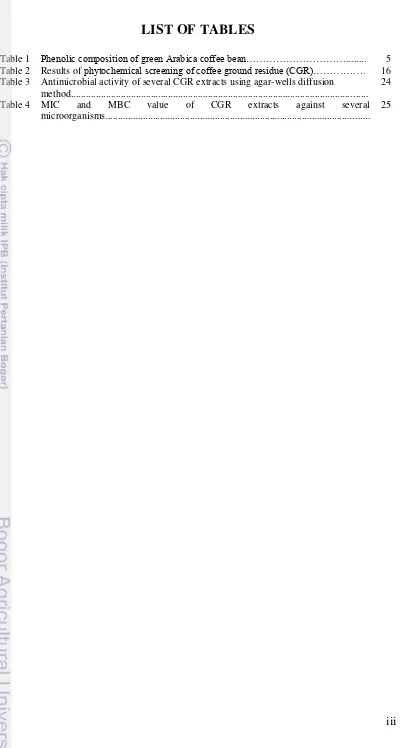
LIST OF TABLES
Table 1 Table 2 Table 3
Phenolic composition of green Arabica coffee bean………... Results of phytochemical screening of coffee ground residue (CGR)………. Antimicrobial activity of several CGR extracts using agar-wells diffusion
method... ... 5 16 24
Table 4 MIC and MBC value of CGR extracts against several microorganisms... ...
iv
LIST OF FIGURES
Figure 1 Composition of coffee fruit or berry.………... 2
Figure 2 Diagram of coffee processing……… 3
Figure 3 Antioxidant mechanism of phenols………... 7
Figure 4 Research diagram………... 10
Figure 5 Dried-coffee ground residue (CGR)………….………. 16
Figure 6 Total lignin of dried-CGR………... 18
Figure 7 Coffee ground residue (CGR) extract………..……….. 18
Figure 8 Extraction yield of CGR extract in several times…... 19
Figure 9 Total phenolic content (CGR) of CGR extract……….. 20
Figure 10 Chlorogenic acid (CGA) content of CGR extract ………... 21
Figure 11 Caffeine content of CGR extract….……….. 22
Figure 12 Anthocyanin content of CGR extract……… 23
v
LIST OF APPENDIX
Appendix 1 Coffee shops information... 31
Appendix 2a Results of lignin content of dried-CGR………... 32
Appendix 2b Analysis of variance of lignin content in dried-CGR... 32
Appendix 2c Post-hoc analysis effect of coffee shop to lignin content……… 32
Appendix 3 Results of effect of extraction time to yield analysis……… 33
Appendix 4a Results of bioactive compounds content of CGR extract……… 34
Appendix 4b Analysis of variance of CGR extract to bioactive compounds content………. 35
Appendix 4c Post-hoc analysis effect of extraction time to bioactive compounds content... 35
Appendix 5a Results of antioxidant activity of CGR extract……… 38
Appendix 5b Analysis of variance of antioxidant activity in CGR extract... 38
Appendix 5c Post-hoc analysis effect of CGR extract to antioxidant activity………. 39
Appendix 6a Pictures of antimicrobial activity of CGR extract (agar-wells diffusion method)... 40
1
I. INTRODUCTION
A.
BACKGROUND
Coffee is at the third rank of popular drinks after water and tea, respectively (Popkin et al., 2006), as a result of its stimulant effect and its unique aroma. There are approximately 60 tropical and subtropical countries produce and export coffee, for instance, Brazil, Vietnam, and Colombia (International Coffee Organization (ICO), 2012).
Arabica coffee (Coffea arabica) and Robusta coffee (Coffea canephora) are the most coffee varieties cultivated economically (Wringley, 1988). Arabica coffee has been known to have better flavor and distinctive aroma with lower caffeine content and acidity, whereas Robusta coffee has known to be more bitter and sour as a result of the higher caffeine content and acidity (Bicchi et al., 1995). Arabica coffee is usually cultivated in the highland area with cool climate and higher rainfall, whereas Robusta coffee is cultivated in the lowland area. Arabica coffee is mostly cultivated in the north part, while Robusta coffee is mostly cultivated in the south part of the country (Angkasith, 2001).
Chiang Rai Province is reported to have the most Arabica coffee cultivated area with 67 % productions of Arabica coffee cultivated in Thailand (Agricultural Statistic of Thailand Corp, 2010). Nowadays, the number of Arabica coffee shops are increasing in Chiang Rai Province and in other provinces in Thailand.
During coffee brewing process, coffee ground residues (CGR) amounted to 1.86 kg per a kilogram of coffee ground (Silva, 1998), is the main waste which is normally thrown away. This is normally left natural and used as a fertilizer in agricultural field. However, slow decomposition process of this waste causes environmental problems. These has motivated people to reutilize coffee ground residues such as for biofuel production (Silva, 1998), polysaccharide sources (Simones et al., 2009), pharmaceutical and nutraceutical compounds (anonymous, 2012), in order to reduce the environmental problem and to add up value to the residue. Some reports showed that CGR still contains certain amount of bioactive compounds such as phenolic compounds, chlorogenic acid, and flavonoids, which also known to have antioxidant and antimicrobial effects (Mussato et al., 2011). The amount of these compounds in CGR are depended on various factors, for instance, coffee varieties, pre and post-harvest handling, brewing machine performances (Cruz, 2011) and the extraction methods (Chirinos, 2011).
In recent years, microwave assisted extraction (MAE) has been increasingly applied in various phytochemical extractions from plant because of the higher extraction yield and higher bioactive compounds in the extracts (Jain et al., 2009). Microwave energy provides high localized temperature and pressure inside the material, consequently, provide selective migration of the target compounds from the material faster (Upadhyay, 2011). The MAE also enhances selectivity, improves reaction rate, provides milder reaction condition, produces cleaner products with higher yields, reduces wastes and energy consumption and is environmental compatibility (Mandal et al., 2007).
B.
OBJECTIVES
This research aimed to investigate the effect of Microwave-Assisted Extraction (MAE) on the amount of bioactive compounds in CGR and to evaluate the antimicrobial and antioxidant activity of MAE-CGR extracts.
C.
RESEARCH SCOPES
2
II. LITERATURE REVIEW
A.
COFFEE PROCESSING
Coffee, one of the most popular drinks worldwide, is a process product from the bean of coffee fruits (Coffea). Two commercially important species of coffee economically are Coffea arabica (Arabica coffee) which contribute to 60 % of world coffee production and the rest for
Coffea canephora (Robusta coffee). Arabica coffee is grown in Latin America, Central and East Africa, India and Indonesia, while, Robusta coffee is grown in West and Central Africa, South-East Asia and Brazil (Wrigley, 1988).
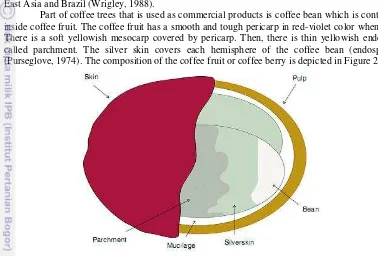
Part of coffee trees that is used as commercial products is coffee bean which is contained inside coffee fruit. The coffee fruit has a smooth and tough pericarp in red-violet color when ripe. There is a soft yellowish mesocarp covered by pericarp. Then, there is thin yellowish endocarp called parchment. The silver skin covers each hemisphere of the coffee bean (endosperm) (Purseglove, 1974). The composition of the coffee fruit or coffee berry is depicted in Figure 2.1.
Figure 1 Composition of the coffee fruit or berry (Esquivel, 2011)
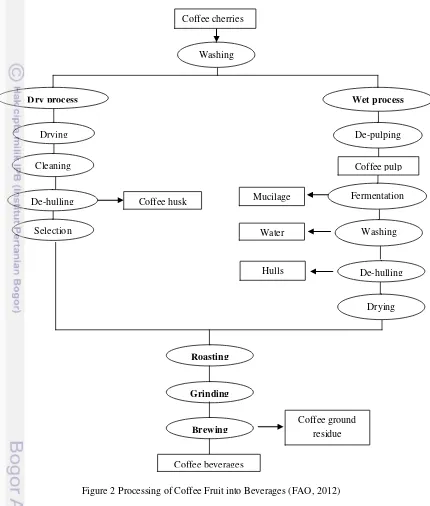
There are several steps to process raw coffee fruit into coffee beverages. The general steps in coffee processing are coffee fruit processing, roasting, and brewing as showed in Figure 2.
Coffee fruit processing is a process to remove the fruit from the beans followed by drying process. There are two basic methods of coffee fruit processing, i.e. wet and dry methods. These two methods produce different flavor and aroma in the bean. In wet process, the fruit pulp covering the beans is removed by a depulper machine. The depulpers machine is used to completely removed the mucilage from the parchment (Murthy et al., 2001). The fermentation in wet process is a process applied to break down the mucilage layer which will takes approximately 24-36 h for Arabica coffee and 72 h for Robusta coffee. After the fermentation process, the bean with the parchment is dried for 8-10 days under the sunlight to reduce its moisture until approximately 12.5 % (Murthy et al., 2001). Then, the parchment is removed to obtain the coffee bean. In dry process, the freshly harvested fruit is dried (12-15 days) and the parchment is removed to get the bean. The bean from both the wet and drying process is further cured for coffee bean flavor and aroma development.
During roasting process, green coffee bean is heated to the temperature ranging from 180ºC and 240oC for 8 to 15 minutes, depending on the degree of roast required (ICO, 2012). There are several chemical reactions (pyrolysis) occurred during the roasting process such as converting starches into sugar, breaking down of proteins and altering of the entire cellular structure of the bean. This process also creates the specific or unique flavor and aroma to the coffee bean. The process also lead to the releases some of volatile compounds such as caffeol (coffee oil) which responsible as coffee flavor.
3
obtained from the fermentation process, the curing process, the roasting process, as well as the brewing process. This brewing process is not only produced the drink, but also generates coffee ground residue (CGR) as the side product. CGR is normally dumped directly to the bin. This causes a lot of environmental problems to the community.
Figure 2 Processing of Coffee Fruit into Beverages (FAO, 2012)
B.
COFFEE GROUND RESIDUE (CGR)
Coffee ground residue (CGR) is a by-product of brewing process after the drink is extracted from coffee bean ground. Coffee ground residue usually discarded as a solid waste. Nowadays, there are increasing number of coffee ground residue as a result of the growth of coffee shop business. There are approximately 6,000,000 tons of coffee ground residue produced every year in the world (Tokimoto et al., 2005). Producing one kilogram of soluble coffee will generates 2 kg of wet CGR and about one ton of green coffee generates about 650 kg of CGR (Pfluger, 1975).
Coffee ground residue Mucilage
De-hulling Fermentation
Selection Water Washing
De-hulling Hulls
Drying Coffee husk
Roasting
Grinding
Drying
Cleaning Coffee pulp
Brewing
Coffee beverages
De-pulping Washing
Coffee cherries
4
The CGR will cause environmental problems. Although CGR is biodegradable materials, the better decomposition process will take much time and needs a large landfill. These has motivated people to reutilize CGR for biofuel production (Silva, 1998), polysaccharide sources (Simones et al., 2009), or pharmaceutical and nutraceutical compounds (anonymous, 2012), in order to reduce the environmental problem and to add up value to the residue. Various works also showed that coffee ground residue still contains a certain amount of bioactive compounds such as phenolic compounds, chlorogenic acid, and flavonoids (Mussato et al., 2011). These compounds especially chlorogenic acid are powerful in-vitro antioxidants (Yen et al., 2005). The amount of these compounds in CGR are depended on various factors, for instance, coffee varieties, pre and post-harvest handling , brewing machine performances (Cruz, 2011) and the extraction methods (Chirinos, 2011).
C.
MICROWAVE ASSISTED EXTRACTION (MAE)
Microwave oven has become an essential appliance in most of kitchen in the past 20 years. The primary benefits of microwave oven are faster cooking times and energy savings over conventional methods. Although the use of microwaves for cooking food is widespread, the application of this technology to the processing of materials is a relatively new development.
Nowadays, microwave has been applied to extract and isolate phyto-constituents. Microwave is electromagnetic non ionizing waves, frequented between 300 MHz to 300 GHz, positioned between X-Ray and infrared in electromagenetic spectrum. The microwave is made by two oscillating fields; electric field and magnetic field which are responsible for heating (Letellier
et al., 1999). Microwave-assisted extraction (MAE) is a system used to selectively extract target compounds from various raw materials with microwave energy (Jain et al., 2009). MAE is a close system that performed with higher temperature which can reduce extraction times drastically. As compared to conventional thermal processing that transferring the energy to the material trough convection, conduction, and radiation of heat from the surfaces of the material, microwave energy is delivered directly to materials trough molecular interaction with the electromagnetic field. In heat transfer, energy is transferred due to thermal gradients, but microwave heating is the transfer of electromagnetic energy to thermal energy and is energy conversion, rather than heat transfer. This difference in the way energy is delivered can result in many potential advantages to using microwaves for processing of materials.
There are two principles of heating using microwave; (1) based upon its direct impact with polar material/solvent, and (2) governed by two phenomenons: ionic conduction and dipole rotation (Letellie et al., 1999). Ionic conduction is electrophoretic migration of ions generate friction which responsible for heating the solvent, while dipole rotation is realignment dipoles of the molecules in changing of electric field rapidly (frequency 2450 MHz, 4.9 x 10⁴ times in changing the electric field) (Zuloaga, 1999).
The materials normally have moisture inside the matrix. Microwave will heat up the water molecules in the plant cells which then evaporated, and generated tremendous pressure to cell walls. The pressure will facilitate the leaching out of some constituents from the rupture cells into the solvent (Wang et al., 2006). Microwave extraction effect on some conditions, such as destroying the surface of sample because of sudden increasing of temperature and internal pressure, rapid exudation of the chemical substances within the cells into surrounding solvent, and the migration of dissolve ions increased solvent penetration into matrix (Garcia-Ayusa et al., 2000).
There are several factors affecting MAE systems; (1) type of solvent and the volume, (2) extraction time, (3) microwave power, (4) temperature and (5) matrix characteristic (Mandal et al., 2007). These factors can influence amount of materials leaching out from the matrix.
5
D.
BIOACTIVE COMPOUNDS
Bioactive compounds are compounds usually produced by plant which has pharmacological or toxicological effects in man and animals (Bernhoft, 2010). Typically, bioactive compounds are produced as secondary metabolites. Secondary metabolites are produced by plants or animals in addition to the primary metabolic routes of compounds as plant growth and development, such as carbohydrates, amino acids, proteins and lipids. Every plant contained different bioactive compounds and several compounds have specific function in plant metabolisms. Coffee fruit has several bioactive compounds such as phenolic compounds, alkaloid, flavonoids and etc.
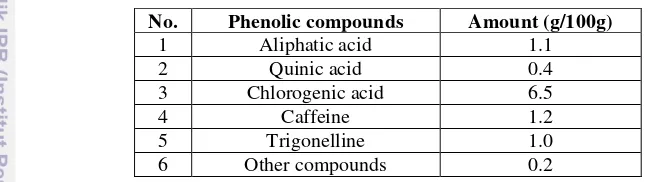
Phenolic compound is the largest class of bioactive compounds in plants. It has the highest amount than the other bioactive compounds in plants. Phenolics are chemical compounds consisting of a hydroxyl group (—OH) bonded directly to an aromatic hydrocarbon group (Rispail, 2005). Phenolic compounds like chlorogenic acid and caffeine are the mainly found in coffee and other phenolic compounds such as tannin, lignin, and anthocyanin are present in minor amounts (Farah et al., 2006). Phenolic composition of green Arabica coffee bean was shown Figure 3.
Table 1 Phenolic composition of green Arabica coffee bean (Wang, 2012)
No. Phenolic compounds Amount (g/100g)
1 Aliphatic acid 1.1
2 Quinic acid 0.4
3 Chlorogenic acid 6.5
4 Caffeine 1.2
5 Trigonelline 1.0
6 Other compounds 0.2
1. Chlorogenic acid
Chlorgenic acids are esters of trans-cinnamic acids and quinic acids. Coffee beans are part of coffees which have the highest amounts of chlorogenic acid approximately 14 % (Esquivel
et al., 2011). Chlorogenic acid has been reported that could be influence in determining coffee quality and play an important role in the formation of coffee flavor (Carelli et al., 1974). Esters of chlorogenic acid which usually found in the coffee beans are caffeic acid, ferulic acid, and p-coumaric acid (Cliford, 2003). Furthermore, these compounds have potential as antioxidant activity. Chlorogenic acid in coffee by products such as silver skin and spent waste contributed to antioxidant activity and contained antioxidant dietary fiber (Murthy et al., 2010). Chlorogenic acid, trigonelline, and caffeic acid from coffee exert inhibitory activity against the growth of
Streptococcus mutans (Anonio et al., 2010).
2. Caffeine
Caffeine is an alkaloid which belongs to xanthenes family. Approximately, coffee beans contained 1-4% dry basis of caffeine (Belitz et al., 2009). Caffeine has slightly bitter flavor. Therefore, caffeine strongly related to the quality of coffee beverages. Caffeine has strong stimulant effects. Caffeine could increase alertness through stimulation of the central nervous system, rise blood circulation and respiration (Belitz et al., 2009). The antioxidant capacity of coffee brew was contributed by caffeine and caffeolyquinic acid (Ludwig et al., 2011). Coffee bean (125 µg/mL conc.) also could inhibit the growth of some bacteria such as Staphylococcus aureus, Escherichia coli and Bacillus cereus.
3. Anthocyanin
Anthocyanins are one of flavonoid compounds, which are widely distributed plant. Anthocyanins just differ in oxidation state from the other flavonoids such as flavonols, flavan-3-ols, flavones, flavanones, and flavanonols (Einbond et al., 2002). Fresh coffee husk (outer skin and pulp) was investigated as potential source of anthocyanins. Cyanidin 3-rutinoside was characterized as the dominant anthocyanin in fresh coffee husks and its recommended fresh coffee husks to be a good candidate as pigment source (Emille et al., 2007).
6
4. Lignin
Lignin is a phenolic polymer in large amounts in plant cells and wood tissues. Lignin acts naturally as antioxidant against chemical, biological and mechanical stress in plants (Kosikova, 2009). Coffee pulp contains the highest amount of lignin in coffee berry than the other parts (Murthy, 2011). As antioxidant agent, lignin acts as a stabilizer of reaction induced by oxygen (Kratzl et al., 1967).
E.
ANTIOXIDANT ACTIVITY
Autoxidation is a spontaneous reaction between oxygen in atmosphere and organic compounds (Chan, 1987). Autoxidation is responsible to rancidity and loss of nutritional value in foods and to condition of cellular damages and cytotoxicity. Autooxidation via free radical chain reaction proceeds into three steps: initiation, propagation and termination. These steps are generally addition of triplet oxygen to organic compounds. Besides free radicals which produced in autoxidation process, lipid hydroperoxides are also produced as primary products and decomposition of hydroperoxides such as aldehydes, ketones, alcohols, hydrocarbons, volatile organic acids, and epoxy compounds, known as secondary oxidation products (Shahidi et al., 2002).
Antioxidant defines as compounds which can delay, inhibit or prevent oxidation by scavenging free radicals and diminishing oxidative stress (Dai et al., 2010). Oxidative stress is an imbalance condition where quantities of reactive oxygen such as ROS and superoxide anion, overcome capacity of endogenous antioxidant (Ames et al., 1993). This process will impact on degenerative diseases in human body such as coronary disease and cancer.
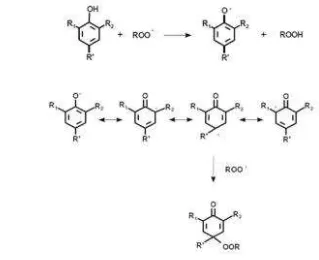
Phenolic compounds are majority compounds in plant which have antioxidant activity. Base on its chemical structures, phenolic compounds could have antioxidant (free radical scavenging) activities because of phenolic hydroxyl groups that donating a hydrogen atom or electron to a free radicals and its conjugated aromatic system that delocalizing an unpaired electron (Dai et al., 2010). The antioxidant mechanism of pheolic was showed in the figure 3.
Phenolic compounds in coffee have been studied as antioxidant agent. Coffee beans roasted by using microwave methods showed strong activity in DPPH scavenging and protect linoleic acid from oxidation where the antioxidative effectiveness is correlated with polyphenol concentration (Nebesny et al., 2003). Furthermore, chlorogenic acid and caffeine were contributed to high antioxidant activity (0.10mM Fe(II)/g SCG) of spent coffee ground extracts (Mussatto et al., 2011).
7
F.
ANTIMICROBIAL ACTIVITY
Food is a good vehicle for dispersion of harmful agents such as biological pathogen, toxin, heavy metals, parasites, radio-isotopes and other illness-causing agents. Pathogen contamination is a major concerning problem in food safety. Food-borne pathogen is pathogen present in food, which may cause human diseases or illness through consumption of food contaminated with pathogen and/or biological products produced by the pathogen (Codex Alimentarius Comission (CAC), 2011). There are some efforts to prevent food-borne pathogen growth in food products such as food process controlling, GMP (Good Manufacturing Practices)/GAP (Good Agricultural Practices) and HACCP system (Karaca, 2011). The processes usually are insufficient to prevent contamination in food products. Consequently, addition of antimicrobial agent must be included in the processes.
Antimicrobial agent is a substances of natural, semi-synthetic or synthetic origin which kills or inhibits microbial growth yet results in minimal or no damage to the host (Prescott et al.,2000). Increasing of consumer demand for foods with lesser chemical/synthesized food addictives, have been impacted increasing utilization of antimicrobial agent derived from plants as natural substitutes for chemical food preservatives (Roller and Lusengo, 1997). Nowadays, phenolic compounds which contained in plant materials has been reported to have antimicrobial activity against several pathogen bacteria such as Staphylococcus aureus, Salmonella, Escherichia coli, and etc (Cueva et al., 2010). Besides preservative function, the use of phenolic compounds as antimicrobial agent in foods provides health benefits.
Generally, there are four major modes of antimicrobial agent mechanism for bacterial infections, for instance, (1) interference with cell wall synthesis, (2) inhibition of protein synthesis, (3) interference with nucleic acid synthesis, (4) inhibition of metabolic pathways (Neu, 1992). Antimicrobial action of phenolic compounds mostly is related to inactivation of cellular enzymes of microorganisms and changing membrane permeability (Moreno et al., 2006). Therefore, effectiveness of antimicrobial action of phenolic compounds is depended to cell surfaces structure of the microorganism. Generally, Gram-positive bacteria such as Bacillus subtilis and
Staphylococcus aureus, are more susceptible to the action of phenolic compounds than Gram-negative bacteria such as Escherichia coli and Salmonella sp. (Karaca, 2011). This is because of the complexity of cell surfaces structure of Negative Bacteria comparing with Gram-positive bacteria.
Phenolic compounds derived from various plants have been intensively studied as antimicrobial agent. The phenolic compounds could be potentially natural substitutes for chemical food preservatives and develop new healthy food ingredients, medical compounds, and pharmaceuticals. Antimicrobial action of phenolic compounds was related with increasing of membrane permeability where compounds may disturb membranes and cause a loss of cellular integrity (Moreno et al., 2006). The antimicrobial potential of the phenolic acids against microorganisms were influenced by the number and position of substitutions in the benzene ring of the phenolic acids and the saturated side-chain length (Cueva et al., 2010).
Most of phenolic compounds have been proved their antimicrobial activity. Tannin and anthocyanin in pomegranate peels extracts both in vitro (agar diffusion) and in situ (chilled fish) could inhibit the growth of Listeria monocytogenes (Al-zoreky, 2009). Bacillus sp. and
Escherichia coli showed the highest susceptibility to flavonoids from mango extracts (Kanwal et al., 2009).
Phenolic compounds in coffee such as chlorogenic acid, caffeine and tannin also have been studied as antimicrobial agent. Chlorogenic acid (5-CQA) and caffeine (caffeic acids) from coffee exert inhibitory activity against Streptococcus mutan cell-growth and Streptococcus mutan
biofilm formation (Antonio et al., 2010). The addition of coffee extract into pasteurized milk could extend the storage life of milk (Fardiaz, 1995). Caffeine contributed to the antibacterial activity of coffee extracts against some bacterial such as Lactobacillus bulgaricus, Bacillus cereus and
8
III. RESEARCH METHODOLOGY
A. MATERIALS AND INSTRUMENTS
1. Materials
The main ingredient used in this research was coffee ground residues (CGR) that were collected from 10 coffee shops in Chiang Rai Province, Thailand. The microorganisms used for the antimicrobial activity assay were Stapphylococcus aureus ATCC25923, Pseudomonas aeruginosa ATCC27853 purchased from the American Type Culture Collection; Escherichia coli
TISTR780, Bacillus subtilis TISTR008, Salmonella Typhimurium TISTR292 purchased from the Thailand Institute of Scientific and Technological Research; and Listeria monocytogenes
DMST17303 purchased from the Department of Medical Sciences Thailand. Chemicals used in phytochemical screening were HCl 2 N, ammonia, FeCl3, gelatin and NaCl. While those for the bioactive compounds assay were Folin-Ciocalteu, gallic acid, caffeine, chlorogenic acid, 72% H2SO4, 7.5% Na2CO3, and dichloromethane. Chemical that used in antioxidant activity assay are trolox ((±)-6-Hydroxy-2,5,7,8-tetramethylchromane-2-carboxylic acid) , DPPH (2,2-diphenyl-1-picryhydrazyl), ascorbic acid, 1% K3Fe(CN)6, 10% trichloroacetic acid, and FeCl3. Chemicals used in antimicrobial activity assay were BD DifcoTM Muller Hinton Agar (MHA), BD DifcoTM Muller Hinton Broth (MHB), ampicillin, and polymicin B sulphate.
2. Instruments
Instruments that used in this research were microwave/convention oven, UV-Vis Spectrofotometer, rotary evaporator, homogenizer, separatory funnel, laminar, vacuum suction, and glassware.
B. EXPERIMENTAL DESIGN
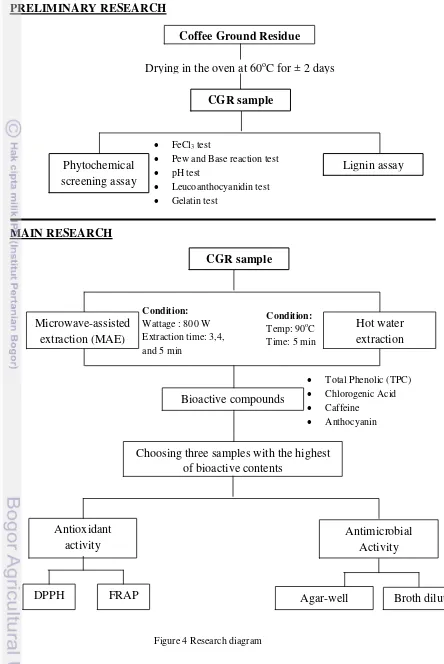
This research was divided into four parts. The first part was phytochemical screening of CGR and lignin content assay as preliminary research. The second part was extraction of CGR with hot water and MAE method. The third part was bioactive compounds such as phenolic compounds, chlorogenic acid, caffeine, and anthocyanin assay in CGR. The last part was antioxidant and antimicrobial assay in three best CGR samples with highest bioactive contents. The diagram of the whole research is shown in Figure 4.
1. Preliminary Research
Coffee ground residue (CGR) collected from 10 coffee shop in Chiang Rai Province, Thailand was dried in the oven at temperature of 60oC until less than 13% moisture content was obtained. Then, the samples were kept in the desiccator until used.
Moisture content of the samples were determined by drying samples (~1 g) for 24 h at 105 ± 0.5 ⁰C to a constant mass (AOAC, 1995). The average moisture content in dry basis, expressed in percents, is calculated using the following equation:
where: m1 = mass of samples before drying
m2 = mass of samples after drying
1.1. Phytochemical Screening (Fransworth, 1966)
Phytochemical screening was done in order to check qualitatively the dominated-bioactive compounds in CGR with several methods. First, sample (50 mg) was mixed with 50 mL distilled water in a beaker. Then, the mixture was homogenized for 2 min and placed in the water bath (60-65oC) for 15 min. After that, it was cooled in the room temperature then the extract was used for phytochemical screening. The phytochemical screening was done by several methods as follows:
1. Ferric Chloride Test (Phenolic compounds and Gallic Acid)
9
PRELIMINARY RESEARCH
MAIN RESEARCH
Figure 4 Research diagram
Drying in the oven at 60
oC for ± 2 days
Coffee Ground Residue
Phytochemical
screening assay
Lignin assay
FeCl3 test
Pew and Base reaction test
pH test
Leucoanthocyanidin test
Gelatin test
CGR sample
Total Phenolic (TPC)
Chlorogenic Acid
Caffeine
Anthocyanin
Bioactive compounds
assay
Antimicrobial
Activity
Agar-well
diffusion
Broth dilution
Choosing three samples with the highest
of bioactive contents
Antioxidant
activity
DPPH
FRAP
CGR sample
Hot water
extraction
Condition:
Wattage : 800 W Extraction time: 3,4, and 5 min
Condition:
Temp: 90oC Time: 5 min
10
2. Pew Test and Base Reaction (Flavonoids)
Flavonoids compounds were determined by two different methods, as follows:
Pew Test
One milliliter of extract was transferred to a test tube. Then, 0.5 g of Zn powder and 2 drops of 2 N HCl were added in the tube and the mixture was vortexed for 1 min. After that, 10 drops of 37 % HCl were added in the mixture. The dark red color solution indicates the presence of flavanonol, and flavonol -3- glycoside, while the light color of solution indicates flavanone, and flavonol.
Base Reaction
One milliliter of extract was transferred to a test tube. Then, 5 drops of 9.5-10.5% ammonia solutions were added in the mixture. The yellow, red, red-brown, or orange-brown color solutions indicated the presences of flavones, flavanol, and xanthone, flavanone, chalcone, ourone and flavanonol.
3. pH Test (Anthocyanins)
Briefly, one milliliter of the extract was transferred in a test tube then a drop of 2N HCl was added in the mixture. After that, 5 drops of 9.5-10.5% ammonia solutions were added in the mixture. The red color solution appeared after HCl addition and changed into blue color after ammonia addition indicated the presence of anthocyanin.
4. Leucoanthocyanidin Test (Leucoanthocyanidin and catechin)
One milliliter of the extract was transferred in the tube then 2 mL of HCl were added in the mixture. After that, the tube was heated in the water bath (50oC). The red color solution and the yellow-brown color solution indicate the presence of leucoanthocyanidin and catechin, respectively.
5. Gelatin Test (Tannin)
Briefly, one milliliter of extract was transferred in the tube then 10 drops of 0.5-1% gelatin solution were added in tubes and adjusted the pH until 4.0 or added with NaCl for showing clear solution. Precipitation in the bottom of the tube indicates the presence of tannin.
1.2. Lignin Content Determination (Aldaeus, 2010)
The CGR (1 g) was transferred into the beaker with volume at least 150 mL. In hydrolysis process, 5 mL of 72% H2SO4 was added into beaker and stirred with glass rod until the sample begins to be dissolved. Then, the beaker was placed in the water bath at 30 ± 0.5oC for 1 hr and stirred occasionally. After that, 85 mL of distilled water was added and beaker was closed by aluminum foil and heated in an autoclave at 120 ± 5oC for 1 hr. After that, the solution was cooled down to 80oC.
Lignin content was determined by total amount of insoluble residue (AIR) and acid-soluble lignin (ASL) in the sample. In determining AIR, sample which has been cooled down to 80oC was filtered with glass filter. Then, the filtrate was transferred into beaker for ASL content determination. The residue on the glass filter was washed with hot water until the acidity of sample became neutral. Then, the glass filter containing the residue was dried in an oven at 105oC overnight. After that, it was cooled down in a desiccator and weighted.
To determine ASL, first, the absorbance of the obtained filtrate was determined at 205 nm. The filtrates must be diluted in order to obtain the absorbance at the range between 0.2-0.7. Then, the AIR, ASL, and total lignin content of the sample were calculated using the following equations;
Acid Insoluble Residue (AIR)
11
Acid-soluble lignin (ASL)
where: A = absorption at 205 nm D = dilution factor
V = volume of the filtrate (L)
A = extinction coefficient of lignin (110 g/l cm) b = cuvette path length (cm)
Total Lignin Content
Total lignin content = AIR + ASL
2. CGR Extraction
CGR was extracted with two methods as follows:
2.1. Hot Water Extraction
Hot water extraction was done in order to be the control treatment that could be compared with microwave assisted extraction. Briefly, 200 mL of distilled water (90oC) was mixed with 20 g of the CGR. The temperature of the mixture was maintained at 90oC for 5 min with occasionally stirred. The mixture was then filtered through Whatman filter paper No.1 with vacuum pump suction. Then, the pH of the filtrate was determined. Then, the filtrate was evaporated using a evaporator (50oC, 120 rpm) to obtain the crude extract. The crude extract was transferred to the vial and closed with perforated-paraffin paper and kept in a desiccator until the weight was stable. The vials was tightly closed with aluminum foil and kept in a refrigerator (4oC) until used for analysis.
2.2 Microwave Assisted Extraction (Upadhyay, 2011)
The CGR was transferred into a beaker. Then, distilled water (200mL) was added into the beaker and the mixture was homogenized for 2 min and pH of mixture was determined. After that, the beaker was placed in a microwave with the power of 800 watt for various extraction time (3, 4 and 5 min). The mixture was then filtered through Whatman filter paper No.1 with vacuum pump suction. Then, the filtrate was evaporated using a evaporator (50oC, 120 rpm) to obtain the crude extract. The crude extract was transferred to the vial and closed with perforated-paraffin paper and kept in a desiccator until the weight was stable. The vials was tightly closed with aluminum foil and kept in a refrigerator (4oC) until used for analysis.
3. Bioactive Compound Determination
The bioactive compounds of the CGR extract were determined quantitatively, as follows:
3.1. Phenolic Compounds (Singhelton and Rossi, 1965)
The total phenolic content was determined by Folin-Ciocalceteu method. Gallic acid was used as standard. Gallic acid stock solutions (1000 µg/mL) were prepared by dissolving 10 mg of dry gallic acid in 10 mL distilled water. Working standards (10-100 µg/mL) were prepared by diluting the stock solution with distilled water in 10mL volumetric flasks.
Diluted extract (0.5mL) and standard (0.5mL) were transferred in the tube. Then, 2.5 mL of 10% (v/v) Folin and 2 mL of 7.5% (w/v) Na2CO3 were added in the mixture. The mixture was kept for an hour in the room temperature. After that, the absorbance was measured at 765nm. Distilled water was needed as the blank. The standard calibration curves of gallic acid (10-100 µg/mL) were plotted and the total phenolic content was expressed as gallic acid equivalent (µg/mL).
3.2. Chlorogenic Acid (Belay and Gholap, 2009)
12
acids (40 mg) with distilled water in 500mL volumetric flask. Working standards (4-16 µg/mL) were prepared by diluting chlorogenic acid stock solutions with distilled water in 100 mL volumetric flask. After that, the mixture was measured the absorbance at 324nm and distilled water was used as the blank.
In determination of chlorogenic acid in the extract, the diluted extract was mixed with dichloromethane at ratio 25:25 and the mixture was stirred for 10 minutes. After that, the mixture was separated using separatory funnel. The caffeine extraction process was repeated 4 times by adding 25 mL dichloromethane in the mixture. The caffeine which dissolved in dichloromethane was kept for caffeine analysis and the chlorogenic acid which dissolved in distilled water was measured the absorbance at 324nm. Every step in this procedure must be avoided from light.
3.3. Caffeine (Belay
et al.
, 2007)
First, the caffeine stock solution (1000 ppm) was prepared by dissolving dried-caffeine (198.2 mg) with dichloromethane in 200 mL volumetric flasks. Then, the working standards (5-50 ppm) were prepared by diluting caffeine stock solution with dichloromethane in 50 mL volumetric flask. The absorbance was measured with spectrophotometer at 260 nm and dichloromethane was used as the blank.
For caffeine extraction, the diluted extract was mixed with dichloromethane at ratio 25:25 and the mixture was stirred for 10 minutes. After that, the mixture was separated using separatory funnel. The caffeine extraction process was repeated 4 times by adding 25 mL dichloromethane in the mixture. The caffeine extract which dissolved in dichloromethane was measured at 260nm.
3.4. Anthocyanin (Lee
et al.
, 2005)
Determination of anthocyanin in CGR was determined by pH differential method. Diluted extract (0.4mL) was transffered into two 10mL volumetric flasks. The first volumetric flask was adjusted the volume with buffer pH 1.0 (1.49 g of KCl in 100 ml of water and 0.2 M HCl, with a ratio of 25:67) and mixed. Then, the second volumetric flask was adjusted the volume with buffer pH 4.5 (1.64 g of sodium acetate in 100 ml of water) and mixed. The mixtures were measured the absorbance at 510 nm and 700 nm. The concentration of total anthocyanin was calculated using the following equation:
Where: A = absorbance; (A510 nm - A700 nm) pH 1.0 - (A510 nm - A700 nm) pH 4.5 MW = molecular weight of cyanidin-3-glucoside (433.2)
DF = dilution factor
e = extinction coefficient for cyanidin 3-glucoside of 31,600 L = cell path length (1 cm)
4. Antioxidant Activity
The antioxidant activity was determined by using three extracts with the highest amounts of bioactive compounds. The activity was determined with two different methods, as follows:
4.1. FRAP (Ferric Reducing Antioxidant Power) Assay (Molyneux, 2004)
The ascorbic acid stock solution (10,000 µM) was prepared by dissolving ascorbic acid (0.0176 g) with distilled water in 10 mL volumetric flask. Then, the working standard (200-1000 µM) was prepared by diluting ascorbic acid stock solution with distilled water in 10mL volumetric flasks.13
4.2. DPPH (2,2-diphenyl-1-picrylhydrazyl) Assay (Molyneux, 2004)
The trolox stock solution (10,000 µM) was prepared by dissolving trolox (0.0250 g) with methanol in 10 mL volumetric flasks. Then, the working standards (200-1000 µM) were prepared by diluted trolox stock solution with methanol in 10 mL volumetric flasks. The DPPH solutions were prepared by dissolving DPPH (0.0024 g) with methanol in 100 mL volumetric flask.
Standard or diluted extracts (50 µL) were transffered into the tube and followed by DPPH solutions (1950 µL). The mixture was kept in the room temperature for 30 min before analysis. The absorbance of solution was measured at 517 nm. Every step in DPPH assay must be avoided from the light. The antioxidant capacity of coffee ground residue extracts were expressed in mg trolox in 100 g dry basis.
5. Antimicrobial Activity
Three CGR extracts with highest bioactive compounds were measured the antimicrobial activity against several bacteria culture such as Bacillus subtilis, Listeria monocytogenes, and
Staphylococcus aureus as Gram-positive bacteria; Escherichia coli, Salmonella typhimurium, and
Pseudomonas aeruginosa as Gram-negative bacteria.
There were several preparations before starting antimicrobial activity as follows: a. Antibiotic Preparation
Ampicillin and polymycin B sulphate were used in this work as positive control in agar well diffusion method. Ampicillin was used for all bacteria except P. aeruginosa, while Polymycin B sulphate was used for P. aeruginosa. The ampicillin stock solution (100mg/mL) was prepared by dissolving 1000 mg ampicillin powder with 10 mL sterile distilled water. Furthermore, the polymycin B sulphate solution (10mg/mL) was prepared by dissolving 100 mg polymycin B sulphate powder with 10mL sterile distilled water. The antibiotic solution was filtered into filter syringe before put in sterile sentrifuge tubes. The ampicillin stock solution (40 µL) was diluted with distilled water in 10mL sterile volumetric flask to get 20µg/50µL concentration of amphicilin. Then, the polymycin B sulphate stock solution (300µL) was diluted with distilled water in 10mL sterile volumetric flask to get 300 unit/50µL concentration of polymycin B sulphate.
b. Mc Farland Preparation
0.5 Mc Farland solution was made by mixing 0.5 mL 1.175% w/v BaCl2 and 99.5 mL 1% v/v H2SO4. The solution was checked the absorbance at 625 nm. The absorbance of 0.5 Mc Farland solutions must be between 0.08-0.13. Mc Farland solutions were kept in the room temperature at dark condition until used.
c. Cultures Preparation
The culture was activated in Nutrient Broth (NB) and incubated at 37oC for 18-24 h. Then, the activated culture was subcultured before using in the antimicrobial assay. Muller Hinton Agar (MHA) was poured into petri dish and the culture was scratched on the agar. The petri dish was incubated at 37oC for 18-24 h.
After preparation, antimicrobial activity of CGR extracts was determined with two different methods as follows:
5.1. Agar-Well Diffusion Assay (Lalitha, 2004)
Agar well diffusion assay measured the effect of an antimicrobial agent against bacteria. The diameter of inhibition zone was measured by seeing the ability of the samples to inhibit the growth of the bacteria. The microorganism was cultured in Muller Hinton Broth (MHB). Then, the turbidity of the culture was compared with 0.5 Mc Farland in black-white paper. If the cultures and Mc Farland had the same turbidity, the culture could be used in the analysis. The sample was prepared with different concentration (0.75 g/mL, 1 g/mL and 1.5 g/mL). Before put into sterile vials, the sample was filtered into filter syringes.
14
laminar for 2 h until the solution was absorbed into the agar. Then, the dish was incubated at 37oC for 18-24 h. Antimicrobial activity of the extract was determined by measuring clear zone diameter around the well.
5.2.Micro-Broth Dilution Assay (Lalitha, 2004)
Micro-broth dilution assay (96-wells plate method) in the CGR is determined antimicrobial activity by measuring minimum inhibition concentration (MIC) and minimum bactericidal concentration (MBC) of the extracts.
Extract was prepared in several concentrations. The initial concentration of each extract was 1500 mg/mL. Further 1:2 serial dilution was performed by addition of culture broth to reach concentrations ranging from 500 to 0.98 mg/mL. Extract (100 µL) was transffered in 96-wells plates and 100 µL of bacterial culture in MHB was added in each well (2nd-11st well). Sterile control (200µL MHB) and growth control (100 µL MHB and 100 µL bacterial cultures) were also added in the well (1st well and 12th well, respectively). Positive control (0.01% BHT) was also added in a well by added 100 µL BHT and 100 µL MHB. Then, 96-wells plates were incubated at 37oC for 18-24 h.
The MIC value was evaluated after incubation, as the lowest concentration that completely inhibited the formation of visible growth (have a clear turbidity compared with sterile controls and growth controls). The MBC determination was used to assess if the inhibitory effect observed in MIC determinations was through a lethal (bactericidal) action. Extract from well where the MIC results showed no bacterial growth was removed with a loop, inoculated into Muller-Hinton Agar (MHA) plate, and incubated at 37oC for 18-24 h. MBC was considered to be the concentration at which microorganisms were totally unable to grow.
6.
Statistical Analysis
15
IV. RESULTS AND DISCUSSIONS
A.
PHYTOCHEMICAL SCREENING AND LIGNIN CONTENT OF CGR
SAMPLES
Coffee ground residue (Coffea arabica) that were collected from 10 coffee shops in Chiang Rai Province, Thailand were labeled as A, B, C, D, E, F, G, H, I and J as shown in Appendix 1. The coffee shops were chose by several criterias such as scale of production, location and coffee bean distributor.
The preliminary research included the phytochemical screening and determination of lignin content in dried-coffee ground residue (less than 13% of moisture content) (Figure 5)
Figure 5 Dried-CGR
1.
Phytochemical screening
Phytochemical screening normally is used as preliminary research to know the chemical constituent contained in plant material. This screening could investigate qualitatively presence of some phythochemicals (Kantamreddi et al., 2010). The presence of phytochemicals was shown by changing of color, turbidity, pH or other physical properties when small portions of extract was dissolved with tested chemical or reagents.
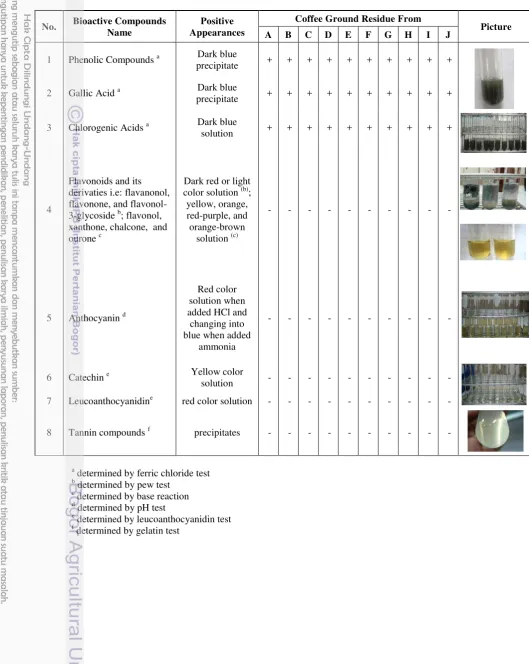
Phytochemical screening in CGR revealed the presence of phenolic compounds, gallic acid, and chlorogenic acid in all samples and negative for the presence of anthocyanin, leucoanthocyanidin, flavonoids, tannin, and catechin (Table 2). This result showed that CGR still had a large amount of those compounds. The other compounds that showed negative results in the test might be contained at the small amount in the dried-CGR. Therefore, the amount of phenolic compounds and chlorogenic acid were determined in the CGR extracts in the next part of this work. The amount of caffeine and anthocyanin were also determined.
2.
Determination of Lignin Content
Lignin is complex non-soluble phenolic polymers and integral part of secondary cell walls of plants (Poeteau et al., 2003). Lignin acts naturally as antioxidant against chemical, biological and mechanical stress in plants (Kosikova, 2009).
16
Table 2 Results of phytochemical screening of coffee ground residue (CGR)
No. Bioactive Compounds Name
Positive Appearances
Coffee Ground Residue From
Picture
A B C D E F G H I J
1 Phenolic Compounds a Dark blue
precipitate + + + + + + + + + +
2 Gallic Acid a Dark blue
precipitate + + + + + + + + + +
3 Chlorogenic Acids a Dark blue
solution + + + + + + + + + +
4
Flavonoids and its derivaties i.e: flavanonol, flavonone, and flavonol-3-glycoside b; flavonol, xanthone, chalcone, and ourone c
Dark red or light color solution (b); yellow, orange, red-purple, and orange-brown
solution (c)
- - - -
5 Anthocyanin d
Red color solution when added HCl and
changing into blue when added
ammonia
- - - -
6 Catechin e Yellow color
solution - - - -
7 Leucoanthocyanidine red color solution - - - -
8 Tannin compounds f precipitates - - - -
a
determined by ferric chloride test b
determined by pew test c
determined by base reaction d
determined by pH test e
determined by leucoanthocyanidin test f
17
[image:32.595.117.529.93.319.2]The values with different letters (a-h) in each column show a significant difference(p<0.05)
Figure 6 Total lignin of dried-coffee ground residue
B.
Extraction of CGR
[image:32.595.114.528.105.563.2]The dried-CGR samples were extracted by MAE method using water as the solvent under the MAE conditions of 800 W and times (3, 4 and 5 minutes). The CGR extract was shown in Figure 7.
Figure 7 CGR extracts obtained for (A) three minutes of MAE extraction and (B) non-microwave extraction
Water was chosen as the solvent because of the higher dielectric constants of water which made it had higher diffusivity into matrix (Jain et al., 2009), additionally, water is considered safe for application in food. A 800 W of microwave power were used based on earlier studies (Upadhyay, 2011). This research used household microwave to extract the CGR. The household microwave could not control the temperature of extraction. Times of extraction became a crucial factor to control the risk of bioactive compounds degradation and to get the maximum yield of extracts.
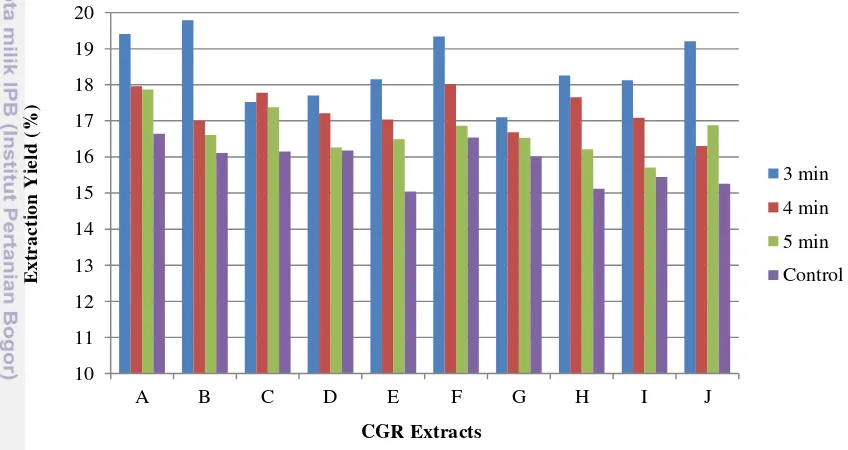
The graph showing the relationship between time of extraction to the CGR extract yield produced was shown in Figure 8. The shorter time, the greater extraction yield of CGR was obtained. Although the increasing of the extraction time could increase the quantity of analytes/yield extracted into the solvent, the shorter time could maintain the temperature below the
fg h de
c ef b cd
g
a
ef
0 50 100 150 200 250 300 350 400 450 500
A B C D E F G H I J
L
ig
nin
(
m
g
/g
)
Dried-Coffee Ground Residue
18
solvent boiling temperature (Mandal et al., 2007). The over exposure of the higher temperature may lead to thermal degradation of constituents which sensitive to high temperature. MAE of polyphenols and caffeine was found to increase up to 3 min and later decreased with the increase of time (Pan et al., 2003).
[image:33.595.113.537.263.488.2]MAE for 3 minutes resulted in higher yield than longer times of extraction (4 and 5 minutes). Earlier studies have reported that 5 minutes was the best time of MAE (temperature 50oC) that yield gave higher chlorogenic acid in coffee bean ground (Upadhyay, 2011). The different results occurred because this work used household microwave with uncontrolled temperature of extraction while Upadhyay used close-vessel microwave. In this study, the temperature of water and CGR mixtures measured after 3, 4, and 5 minutes extraction were 75oC, 90oC, and 105oC, respectively. Therefore, the high temperature of extraction was thought to increase the risk of bioactive compounds degradation. As compared to the control treatment, MAE had higher extraction yield. Tremendous pressure from microwave energy could leach out the constituents from matrix faster (Mandal et al., 2007).
Figure 8 Extraction yield of CGR extract with various time of extraction
C.
BIOACTIVE COMPOUNDS IN COFFEE GROUND RESIDUE (CGR)
Bioactive compounds are secondary metabolites of plants that having pharmacological or toxicological effects in man and animals (Bernhoft, 2010). This part of work determined the amount of several bioactive compounds (i.e. total phenolic compounds, chlorogenic acid, caffeine, and anthocyanin) in CGR extracts. From the phytochemical screening, the phenolic compound and chlorogenic acid content were assayed qualitatively in CGR. Caffeine and anthocyanin also were determined in this work because of the relationship of those bioactive compounds and antioxidant activity.
1.
Total Phenolic Compounds (TPC)
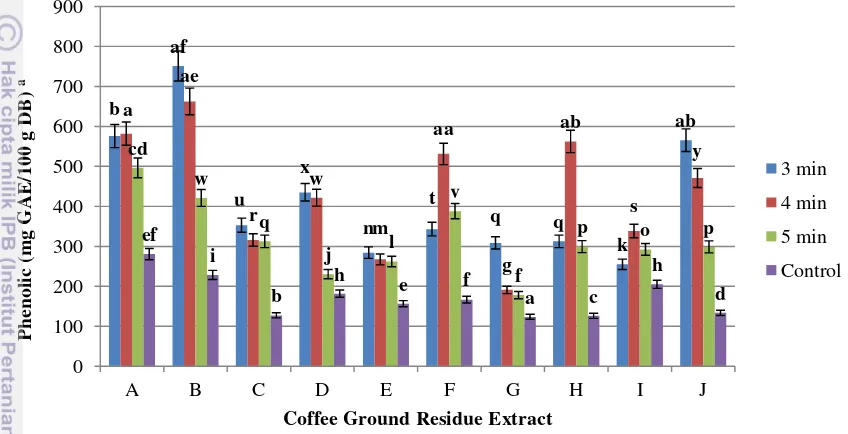
The TPC content in the CGR extract obtained with different time of MAE was shown in Figure 9. The results showed that sample B (3 minutes), B (4 minutes) and A (4 minutes) had higher amount of phenolic compounds (751.15 mg GAE/100 g; 662.40 mg GAE/100 g; and 582.07 mg GAE/100g, respectively) than the others.
Furthermore, different times of MAE also generated different amount of phenolic compounds in the extracts. Generally, 3 minutes of MAE generated higher amount of phenolic compounds (255-751 mg GAE/100 g) than the other times. MAE could generate higher amount of phenolic compounds in the extract than the control treatment (123 – 280 mg GAE/100 g). The amount of phenolic compounds in MAE of CGR extracts were approximately five-fold lower than those in coffee beans (1200-2400 mg GAE/100 g in aqueous extractions) (Upadhyay, 2011).
10 11 12 13 14 15 16 17 18 19 20
A B C D E F G H I J
19
However, the amount of phenolic compounds in CGR extract using hexane as solvent (1300 mg GAE/100 g) was higher than those extracted with water (Ramalakshmi et al., 2009). In this study, the extraction of CGR using water as solvent also had lower of phenolic compounds (300 mg GAE/100 g) than those extracted with hexane resulted in Ramalakshmi study. This could be explained by the fact that phenolic compounds are generally more soluble in organic solvents less polar than water (Kim et al., 2002). Alcohols, particularly methanol and ethanol were also more efficient than water in extracting phenolics from different natural sources such as citrus peel, black tea, barley and medicinal plants (Rehman, 2006).
a
The amount of phenolic compounds expressed as gallic acid equivalent (GAE)
[image:34.595.114.538.196.413.2]The values with different letters (a-af) in each column show a significant difference (p<0.05)
Figure 9 Total phenolic compounds of coffee ground residue extracts
2.
Chlorogenic Acid Compounds (CGA)
The amount of CGA in the CGR extracts obtained with different time of MAE was shown in Figure 10. The results had the same tendency with total phenolic compounds. Sample B (3 minutes), B (4 minutes) and A (4 minutes) also had higher amount of CGA compounds (222.45 mg/100 g; 216.72 mg/100 g; and 207.15 mg/100 g, respectively) than the others.
Four minutes of MAE overall showed the higher CGA in the extracts (123-216 mg/100 g) than the others. MAE extracts also had the higher amount of CGA than the control e