FLUORIMETRIC BASED PROCEDURE FOR MEASURING
CURCUMIN CONCENTRATION IN COMMERCIAL
HERBAL MEDICINES
SITI NURMA NUGRAHA
GRADUATE SCHOOL
BOGOR AGRICULTURAL UNIVERSITY BOGOR
DECLARATION OF THESIS AND INFORMATION SOURCES OF INFORMATION AND PATENT
I hereby declare that the thesis of “Fluorimetric Based Procedure for
Measuring Curcumin Concentration in Commercial Herbal Medicines” is true of my own work under the direction of thesis committee and has not been submitted in any form to any university. The content of this thesis has been examined by the thesis committee and external examiner. Sources of information which is derived or cited either from published or unpublished scientific paper from other writers have mentioned in the script and listed in the reference at the end of this thesis.
I hereby assign the copyright of my thesis to Bogor Agricultural University.
Bogor, May 2016
Siti Nurma Nugraha
RINGKASAN
SITI NURMA NUGRAHA. Prosedur Pengukuran Berbasis Fluorimetri untuk Mengukur Konsentrasi Kurkumin di dalam Obat-obat Herbal Komersial. Dibimbing oleh HUSIN ALATAS dan IRMANIDA BATUBARA.
Masyarakat Indonesia telah secara turun-temurun menggunakan obat herbal tradisional, yang dikenal sebagai jamu, untuk mengobati dan melindungi tubuh dari penyakit. Kebiasaan penggunaan jamu ini memberi implikasi akan pentingnya kebutuhan untuk meningkatkan dan mengembangkan beberapa standar kualitas jamu. Atas dasar ini, sistem standardisasi yang baik sangat diperlukan untuk mendapatkan kualitas jamu yang memenuhi standar kelayakan, efektif, dan berkualitas tinggi. Kunyit (Curcuma longa) dan temulawak (Curcuma Zanthorrhiza) adalah tanaman obat yang banyak dimanfaatkan sebagai bahan utama jamu oleh orang Indonesia. Kedua bahan tersebut mengandung kurkumin yang merupakan komponen aktif utama pada rhizoma (akar rimpang).
Berbagai jenis metode telah dikembangkan dalam penentuan kadar kurkumin di dalam tumbuhan obat, seperti (1) teknik spektrofotometri UV-Vis, (2) teknik kromatografi lapisan tipis (Thin-Layer Chromatography), dan (3) teknik High
Performance Liquid Chromatography (HPLC). Meskipun metode-metode
tersebut tersedia dan dapat digunakan, suatu teknik analisis kurkumin yang penerapannya sederhana, memberikan hasil yang cepat, peka, tepat, dan berbiaya murah masih menjadi masalah utama di Indonesia. Dalam studi ini kami mengajukan dan menggunakan sebuah metode penentuan kadar kurkumin alternatif berbasis fluorimetri. Metode ini dapat diterapkan untuk analisis obat herbal yang mengandung komponen zat yang dapat berfluoresensi, seperti kurkumin, yang menunjukkan gejala fluoresensi kuat di dalam pelarut organik. Metode fluorimetri ini memiliki kadar sensitivitas dan selektivitas yang lebih tinggi dibandingkan dengan teknik spektrofotometri dan metode ini juga lebih sederhana dan murah dibandingkan dengan teknik analisis kromatografi.
Tiga tahap utama dalam studi ini meliputi: persiapan kurva standar kalibrasi kurkumin, penentuan konsentrasi kurkumin di dalam sampel, dan perbandingan terhadap hasil yang diperoleh menggunakan teknik HPLC. Pengukuran fluoresensi dilakukan pada fluorometer FLUOstar Omega yang menggunakan spektrometer UV-Vis. Level fluoresensi yang muncul berbanding lurus dengan intensitas cahaya yang datang dan konsentrasi dari bahan fluoresen yang diamati. Kurva kalibrasi standar yang dihasilkan menunjukkan hubungan yang linear dan positif antara konsentrasi dan intensitas fluoresensi. Tingginya nilai koefisien determinasi juga menunjukkan bahwa hubungan tersebut sangat jelas. Evaluasi kinerja dari metode fluorimetri ini dilakukan dengan membandingkan konsentrasi-konsentrasi yang diperoleh dari pembacaan hasil fluorometer terhadap hasil yang diperoleh dari HPLC.
SUMMARY
SITI NURMA NUGRAHA. Fluorimetric Based Procedure for Measuring Curcumin Concentration in Commercial Herbal Medicines. Supervised by HUSIN ALATAS and IRMANIDA BATUBARA.
People in Indonesia have historically used the traditional herbal medicines, known as jamu, for the treatment and protection of diseases. It implies a need to improve and develop some quality standard of jamu. To develop a jamu, various species of medicinal plants were selected and identified carefully prior extraction and manufacturing into jamu components. Standardization in this area is necessary to achieve the quality of jamu that are eligible, effective, and of high quality. Turmeric (Curcuma longa) and temulawak (Curcuma zanthorrhiza) are medicinal plants, widely used as the main ingredients in jamu by Indonesian people. Both have curcumin as the major active components of the rhizomes.
Numerous methods have been developed on curcumin determination in medicinal plants such as (1) UV-vis spectrophotometry, (2) Thin Layer Chromatography, and (3) High Performance Liquid Chromatography (HPLC). Despite the availability of these methods, the implementation of a simple, rapid, sensitive, precise, and more economic technique for curcumin analysis is still considered an important issue in Indonesia. An alternative fluorimetric method is proposed and used in this study. It can be applied for the analysis of herbal medicines containing a fluorescent component, such as curcumin, that exhibits strong fluorescence in organic solvents. The fluorimetric method has higher sensitivity and selectivity compared to the spectrophotometric technique and it is also simpler and less expensive compared to the chromatographic analysis.
Three main parts of this study include: preparation of standard calibration curve of curcumin, determination of curcumin concentration in samples, and comparison against measurements from HPLC.Fluorescence measurements were performed on a FLUOstar Omega fluorometer which uses a UV-vis spectrometer. Fluorescence is directly proportional to the intensity of the exciting light and the concentration of the fluorescent material being investigated. The standard calibration curve shows linear and positive relationship between concentration and fluorescence intensity. High coefficient of determination also indicates that the relationship is strong. Performance evaluation of the fluorimetric method was carried out by comparing concentrations derived from the instrument with that from HPLC.
© Copyright of IPB, the year 2016
Copyright reserved by the law
Forbidden to quote part or all of these writings without including or mentioning the source. Citing is only for educational purposes, research, writing papers, drafting reports, writing criticism, or review an issue, and citing it does not harm the interests of fair Bogor Agricultural University.
A Thesis submitted in partial fulfillment of the requirement for Master Degree
in Biophysics Program
FLUORIMETRIC BASED PROCEDURE FOR MEASURING
CURCUMIN CONCENTRATION IN COMMERCIAL
HERBAL MEDICINES
GRADUATE SCHOOL
BOGOR AGRICULTURAL UNIVERSITY
BOGOR
2016
Thesis title : Fluorimetric Based Procedure for Measuring Curcumin Concentration in Commercial Herbal Medicines
Name : Siti Nurma Nugraha
ID : G751130151
Approved by
The Commission of Supervisors
Dr. Husin Alatas, M.Si Supervisor
Dr. Irmanida Batubara, M.Si Co-Supervisor
Certified by:
Head of Biophysics Graduate Program
Dr. MersiKurniati, M.Si
Dean of the IPB Graduate School
Dr.Ir. DahrulSyah, MSc.Agr
ACKNOWLEDGEMENTS
Firstly, I am grateful to Allah SWT for this amazing life, abundant favors and blessings during my graduate study until I finish this thesis.
I wish to thank Dr. Husin Alatas as my thesis supervisor for devoting his time for discussion and giving me his continued support, motivation and suggestions for my research work. I have learned and improved more than I ever expected.
I also would like to thank my thesis co-supervisor, Dr. Irmanida Batubara for her expertise, guidance, and comments. My thanks also go to Dr. Kiagus Dahlan as my thesis external examiner for his valuable suggestion and motivation, Dr. Akhiruddin Maddu, Tony Sumaryada, PhD and Dr. Mersi Kurniati for their support and useful suggestion, and also Dr. Mamat Rahmat and Sugianto Arjo, M.Si for their helpful contribution.
I would like to thank the people at Biofarmaka Research Center, in particular, Ms. Nunuk Kurniati, Ms. Laela Wulan Sari, Ms. Wiwi Widiyanti and Mr. Endi Suhendi for their general help and technical support. I thank my classmates in Biophysics IPB who all have been great friends and helped me in this study.
This master study opportunity was made possible in part by the support from the Bogor City Government and Principal of SMPN 2 Bogor. I also thank my colleagues in SMPN 2 Bogor for their support, especially Ibu Yani Herliani, M.Pd for her profound encouragement.
I would like to give my special gratitude to my husband for his tremendous love and patience, my parents for giving those powerful words of advice, my loving sister and brother for always being truthful to me. Without their love and companionship, I could not go on to achieve what I have today.
Lastly, I dedicate this thesis to my students who have become the sources of my inspiration.
Bogor, May 2016
TABLE OF CONTENS
TABLE LIST ii
FIGURE LIST iii
APPENDICES LIST iv
1 INTRODUCTION 1
Background 2
Objective 2
Hypotheses 3
Benefit 3
2 MATERIALS AND METHODS 4
Instruments 4
Fluorimetric Method 4
Chemical and Reagents 5
Determination of Curcumin Concentration and Comparison 5 Detection Limit (LOD) and Quantitation Limit (LOQ) 6
3 RESULTS AND DISCUSSION 7
4 CONCLUSION AND RECOMMENDATION 14
REFERENCES 15
TABLE LIST
1Linear Regression Parameters of Calibration Curve for Curcumin 8
2LOD and LOQ value 9
3Curcumin Concentration in Temulawak 10
4Curcumin Concentration in Turmeric 11
FIGURE LIST
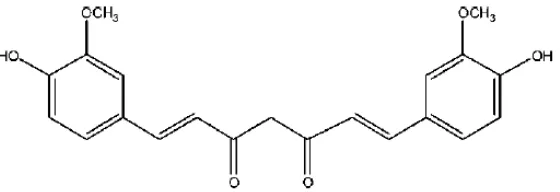
1Chemical Structure of Curcumin 1
2Fluorometer FLUOstar Omega 4
3Fluorescence Diagram 7
4Standard Calibration Curve 9
5Percentage Difference Diagram of Temulawak 12
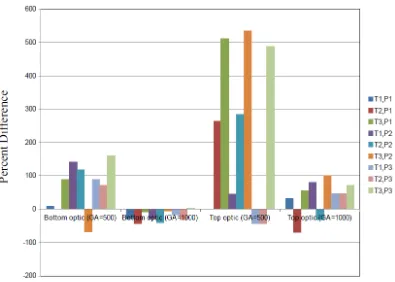
6 Percentage Difference Diagram of Turmeric 13
APPENDIX LIST
1 Flow chart of research 18
2 Concentration of temulawak for every fluorescence intensity 19 3 Concentration of turmeric for every fluorescence intensity 20
4 Percentage difference table 21
5 HPLC data for temulawak extract 21
6 HPLC data for turmeric extract 21
1
1 INTRODUCTION
Background
Indonesia has the second biggest biodiversity in the world expressed by 30,000 plant species and is a home to about 80% of the world’s medicinal plants. Based on this plenteous source of medicinal plants, it is estimated that 40 million of Indonesian have historically used the traditional herbal medicines, known as
jamu, for the treatment and protection of diseases (Elfahmi et al., 2014). In the country, jamu is popular and common practice on diet and general health. It implies a need to improve and develop some quality standard of jamu. Various researches utilizing advanced technology have been carried out to improve the quality of jamu and, eventually, to further boost consumer confidence. To develop a jamu, various species of medicinal plants were selected and identified carefully prior extraction and manufacturing into jamu components. Standardization in this area is necessary to achieve the quality of jamu that are eligible, effective, and of high quality.
Turmeric (Curcuma longa) and temulawak (Curcuma zanthorrhiza) are medicinal plants, widely used as the main ingredients in jamu by Indonesian people. Both main ingredients have curcumin [1,7-bis (4-hydroxy-3methoxyphenyl)-1,6-heptadiene-3,5-Dione] (Figure 1) as the major active components of the rhizomes (Tonnesen et al., 1992; Sutrisno et al., 2008). Curcumin, having nearly a two centuries old scientific history, is still attracting researchers from all over the world. Starting from 1815, when curcumin was first isolated from turmeric, there were only a few reports till the 1970s on its chemical structure, synthesis, biochemical and antioxidant activity (Sharma, 1976). It has three chemical entities in its structure: two aromatic ring systems containing o-methoxy phenolic groups, connected by a seven carbon linker consisting of an α,β-unsaturated β-diketone moiety (Grykiewicz, 2012).
Recent pharmacological researches revealed that curcumin is functioned as anti-oxidant (Namita et al., 2012), anti-inflammatory (Anand et al., 2008), anti-carcinogenic (Basnet et al., 2011), anti-diabetes (Merrel et al., 2009), antimicrobial effects (Maheshwari et al., 2006), anti-tumor (Kunnumakkara et al., 2007), anti-bacterial and anti-coagulant (Maiti et al., 2007).
2
Numerous methods have been developed on curcumin determination in medicinal plants such as (1) UV-vis spectrophotometry (Jasim et al., 1988; Sharma et al., 2012; Liu et al., 2016), (2) Thin Layer Chromatography (TLC; Zhang et al., 2007), and (3) High Performance Liquid Chromatography (HPLC; Pak et al., 2003). Although spectrophotometry is widely used for the quantification of curcumin, it lacks of reproducibility (Govindrajan, 1980) and need some complicated sample-preparation steps (Liu et al., 2016). On the other hand, the chromatographic methods (TLC and HPLC) give some good performances in producing simultaneous separation and determination of various components with high accuracy and good precision (Yang et al., 2012). The HPLC analysis has also been employed to detect low quantities of curcumin in biofluids (Kim et al., 2013). However, it has the disadvantages of being more time-consuming and expensive (Bisht et al., 2007; Nam et al., 2007; Tiyaboonchai et al., 2007; Sou et al., 2008).
Despite the availability of these methods, the implementation of a simple, rapid, sensitive, precise, and more economic technique for curcumin analysis is still considered an important issue in Indonesia. An alternative fluorimetric method (Diaz et al., 1992; Mazzarino et al., 2010) is proposed and used in this study. It can be applied for the analysis of herbal medicines containing a fluorescent component, such as curcumin, that exhibits strong fluorescence in organic solvents (Diaz et al., 1992). The fluorimetric method has higher sensitivity and selectivity compared to the spectrophotometric technique and it is also simpler and less expensive compared to the chromatographic analysis (Zhang et al, 2007). However, a standard procedure based on fluorimetric method for measuring the curcumin concentration in commercial herbal medicines has not yet been addressed scientifically.
Objectives
The objectives of this study are as follows:
1.To develope the corresponding simple procedure based on the corresponding fluorimetric method for measuring curcumin concentration in two commercial herbal medicines, containing turmeric and temulawak
2.To evaluate the result by comparison with the HPLC analysis. Hypotheses
3
Benefits
4
2 MATERIALS AND METHODS
Instruments
Fluorescence measurements were performed on a FLUOstar Omega fluorometer (BMG Labtech, USA) which uses a UV-vis spectrometer that instantaneously captures wavelengths in a range of 220-850 nm at 1 nm resolution (Figure 2). This device do not need scanning or calibration since there is no installed monochromator, and it is equipped with a high-intensity xenon flash lamp and selected PMTs, coupled with high transmission band pass filters, to provide a stable, low-noise signal platform for ultra-sensitive fluorescence reading. All the measurements were carried out in triplicate (three repetitions).
Figure 2. Fluorometer FLUOstar Omega
Fluorimetric Method
5
possible to avoid interfering radiation caused by direct scattering of the exciting radiation or by fluorescence of other substances, by using spectrally selective filters in the fluorescence detectors. For this study, the excitation and emission wavelengths were 420 nm and 530 nm, respectively (Wang et al, 2006). The fluorescence intensity of all curcumin standards was measured by four different experiments: (1) Bottom optic with Gain Adjustment (GA) equal to 500; (2) Bottom optic with GA = 1000, (3) Top optic with GA = 500, and (4) Top optic with GA = 1000. Bottom and top optics are illumination optics inside fluorometer which are used to measure fluorescence, luminescence, and absorbance. Their difference is located at the optic position that determines the light inlet, which is at the left (right) side of reagent box for bottom (top) reading. GA is a parameter for light intensity that is projected into the sample. The two selected GA levels (500 and 1000) have been tested to give optimum fluorescence intensity. Next, the fluorescence intensity was measured by the fluorometer for the above series of standard solutions. The calibration graph was obtained by plotting the fluorescence intensity of the standard solutions against the theoretical standard concentrations. The linearity was evaluated by linear least-square regression analysis.
Chemical and Reagents
Curcumin (ChromaDex: CDXA-09-1789, MW: 166.7) was prepared at concentration of 0.4, 0.8, 1.6 and 2.4 g/mL using methanol as the solvent. For sample preparation, 10 milligrams of each extract (temulawak and turmeric extract) were dissolved in 10 ml methanol to get a concentration of 1000 g/mL and diluted to appropriate concentration with methanol as needed. Curcumin has extensive absorption around 420 nm and can emit the fluorescence around 530 nm in aqueous solution, but their intensities is very low (Feng Wang, 2006).
Determination of Curcumin Concentration and Comparison
Fluorescence intensity of the samples, as read out from the instrument, was put into the regression equation (obtained from previous step) to get a final estimate of curcumin concentration contained in sample. The result was in g/mL unit which was then converted to mg/g according to the following formula
1000 where y′ is the curcumin concentration in mg/g, y is the concentration in g/mL,
and csample is the sample concentration (100 g/mL for temulawak and 10 g/mL for turmeric). The factor 1000 was used to convert milligram to gram.
6
100
HPLC HPLC r
fluoromete d
c c c
P (2) with c denoting curcumin concentration in mg/g.
Detection Limit (LOD) and Quantitation Limit (LOQ)
7
3 RESULTS AND DISCUSSIONS
Fluorimetry, the measurement and use of fluorescence, is a technique of quantitative chemical analysis ideally suited to field use (Smith et al, 1981). Fluorimetry is chosen for its extraordinary sensitivity, high specificity, simplicity, and low cost as compared to other analytical techniques. It is a widely accepted and powerful technique that is used for variety of environmental, industrial, and biotechnology applications.
Fluorescence is an absorption and instantaneous re-emission of radiant energy from a molecule or atom accompanied by a change in wavelength as well as direction. When a quantum of light is absorbed by a molecule, the molecule is raised to an excited state. There are a variety of ways the excited molecule can manifest or dissipate this energy. The simplified diagram below shows absorption by molecules to produce excited state and then emitted light (Figure 3).
Figure 3. Jablonski Energy Diagram of Fluorescence
Fluorescence is directly proportional to the intensity of the exciting light and the concentration of the fluorescent material being investigated. The level of fluorescence is proportional to concentration, frequently over a range of concentration of several orders of magnitude. The linearity breaks down at a very high concentration but this can be overcome either by simple dilution or by preparing a calibration curve of fluorescence versus concentration. The standard calibration curve of curcumin from the first replicate whereas the regression parameters and the coefficient determinations (R2) from all experiments and replications are summarized in Table 1.
8
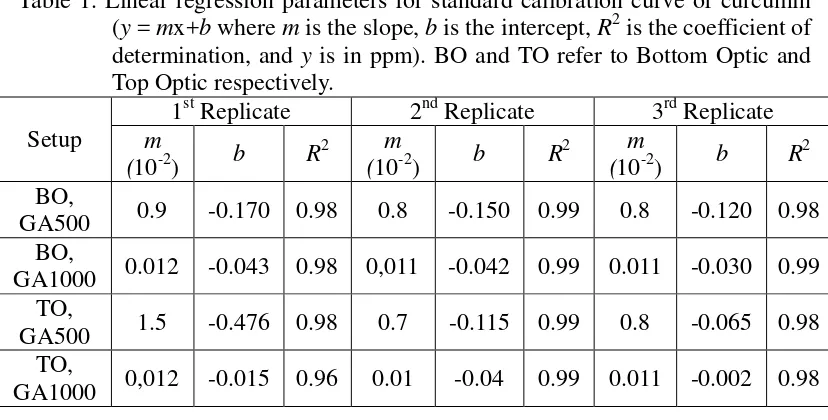
Table 1. Linear regression parameters for standard calibration curve of curcumin (y = mx+b where m is the slope, b is the intercept, R2 is the coefficient of determination, and y is in ppm). BO and TO refer to Bottom Optic and Top Optic respectively. This finding indicates that, at identical fluorescence intensity, curcumin concentration read out from the instrument at GA500 is larger than that read out at GA1000. In general, real-time molecule-based experiments, it is beneficial to read from the bottom of the microplate and not from the top. Bottom reading offers several advantages for molecule detection. The light collector can be placed closer to the sample, the cell layer adherent to the bottom of the well, decreasing light dissipation. This factor positively affects sensitivity.
A measurement from the top of the microplate without lid will always give higher signal-to-blank ratios (S:B) than measurements from the bottom. This is mainly due to the fact that the plastic of the bottom of the microplate negatively affects the light transmission, both for excitation and emission, resulting in lower overall signals. Light reflection caused by the plastic surface and the plastic type also increase blank values. This factors affect the value of LOD and LOQ (Table 2).
9
Figure 4. Standard calibration curve of curcumin from the first replicate. X-axis shows fluorescence intensity (counts) and Y-axis shows curcumin concentration (g/mL).
The LOD and LOQ were found to be between 0.0165-0.1113 g/mL and 0.0549-0.371 g/mL, respectively for all experiments, indicating that the method was sufficiently sensitive to be used for curcumin determination in herbal medicine. Detailed information for LOD and LOQ are summarized in Table 2. Table 2. LOD and LOQ for quantitative analysis of standard curcumin. BO and
TO refer to Bottom Optic and Top Optic respectively.
Setup LOD (g/mL) LOQ (g/mL)
BO, GA500 0.0316 0.1053
BO, GA1000 0.0165 0.0549
TO, GA500 0.1113 0.3710
TO, GA1000 0.0569 0.1896
10
P3 while three regression equations (per experiment) will be hereinafter referred to as T1, T2 and T3.
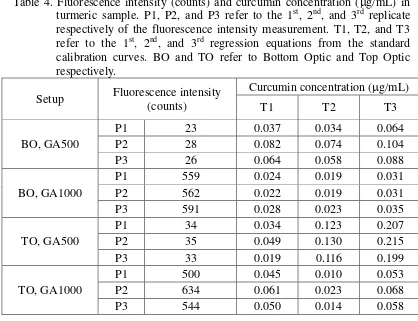
For temulawak, fluorescence intensity is in the range of 24-1734 counts (Table 3). The intensity is higher at GA1000 than that at GA500 with ratio between the two reaching up to 75. Comparing both optic positions, bottom reading gives fluorescence intensity that is smaller than the top reading (at the same GA level) and their difference ranges between 1-15 counts for GA500 and 154-236 counts for GA1000. Regarding the curcumin content, concentration varies between 4.2-24.7 mg/g, being maximal in T3 and minimal in T2, as seen in all replicates (P1-P3) and experiments. For experiment using top optic and GA500, the curcumin content is relatively higher than the other three experiments. Table 3. Fluorescence intensity (counts) and curcumin concentration (g/mL) in temulawak sample. P1, P2, and P3 refer to the 1st, 2nd, and 3rd replicate respectively of the fluorescence intensity measurement. T1, T2, and T3 refer to the 1st, 2nd, and 3rd regression equations from the standard
11
Table 4. Fluorescence intensity (counts) and curcumin concentration (g/mL) in turmeric sample. P1, P2, and P3 refer to the 1st, 2nd, and 3rd replicate
12
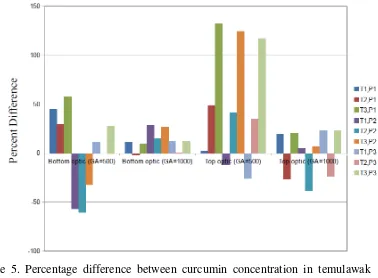
Figure 5. Percentage difference between curcumin concentration in temulawak from fluorometer and that from HPLC (Y-axis). P1, P2, and P3 refer to the 1st, 2nd, and 3rd replicate respectively of the fluorescence intensity measurement. T1, T2, and T3 refer to the 1st, 2nd, and 3rd regression equation of the curcumin calibration curve. Curcumin concentration measured by HPLC is 10.636 mg/g.
13
14
4 CONCLUSION AND RECOMMENDATION
Conclusion
We have developed a standard procedure for measuring the concentration of herbal medicines containing temulawak and turmeric, using fluorimetric method. Three main parts of the study include: preparation of standard calibration curve of curcumin, determination of curcumin concentration in samples, and comparison against measurements from HPLC. The standard calibration curve shows linear and positive relationship between concentration and fluorescence intensity. High coefficient of determination also indicates that the relationship is strong. For both samples, fluorometer yields higher fluorescence intensity on higher GA level. Comparing optic position, top optic reading shows greater intensity than the bottom optic counterpart. Using information the fluorescence intensity of sample and regression equation fitting from the curve, the results imply that curcumin concentration in temulawak is higher compared to that in turmeric. It is partially due to different source where the samples were obtained. Performance evaluation of the fluorimetric method was carried out by comparing concentrations derived from the instrument with that from HPLC. It was found that the fluorometer estimates are closer to HPLC only for bottom optic measurement at GA1000. Hence, it can be concluded that this method has a potential to be used as an alternative quality standard for curcumin content determination in temulawak and turmeric as a sample.
Recommendation for Future Work
15
REFERENCES
Anand P, Thomas SG, Kunnumakkara AB, Sundaram C, Harikumar KB, Sung B, et al, 2008, Biological activities of curcumin and its analogues (congeners) made by man and mother nature, Biochemical pharmacology, 76: 1590-1611 Basnet P, Skalko-Basnet N, 2011, Curcumin: An anti-inflammatory molecule from
a curry spice on the path to cancer treatment, Molecules,16: 4567-98
Bisht S, Feldmann G, Soni S, Ravi R, Karikari C, Maitra A, 2007, Polymeric nanoparticle-encpasulated curcumin (nanocurcumin): a novel strategy for human cancer therapy, J. Nanobiotechnology, v.5, n.3
Diaz NA, Ramos PMC, 1992, Fluorimetric Determination of Curcumin in Yogurt and Mustard, Journal of Agricultural and Food Chemistry, 40:56-59
Elfahmi, Herman J, Oliver K, 2014, Jamu: Indonesian traditional herbal medicine towards rational phytophamacological use, Journal of herbal medicine, 4: 51-73
Govindrajan VS, 1980, Turmeric-Chemistry, Technology and Quality, Critical Review in Food Science Nutrition, 12: 199-301
Jasim F, Ali F, 1988, A Novel Method for the Spectrophotometric Determination of Curcumin and Its Application to Curcumin Spices, Microchemical Journal, 38: 106-110
Kim YJ, Lee HJ, Shin Y, 2013, Optimization and Validation of High Performance Liquid Chromatography Method for Individual Curcuminoids in turmeric by Heat-Refluxed Extraction, Journal of Agricultural Food and Chemistry, 61: 10911-10918
Kunnumakkara AB, Guha S, Krishnan S, Diagaradjane P, Gelovani J, Aggarwal B, 2007, Curcumin potentiates antitumor activity of gemcitabire in an orthotopic model of pancreatic cancer through suppression of prolifitation,
angiogenesis, and inhibition of nuclear factor-KB-regulated gene
products, Cancer research, 67: 3853-3861
Liu X, Zhu L, Gai X, Wang Y, Lu H, Tang Y, Li J, 2016, Magnetic molecularly imprinted polymers for spectrophotometric quantification of curcumin in food, Food chemistry, 202: 309-315
Long GL, Winefordner JD, 1983, Limit of detection, A Closer Look at the IUPAC Definition, Analytical Chemistry, 55: 712A-724A
Mazzarino L, Bellettini IC, Minatti E, Lemos-senna E, 2010, Development and validation of a fluorimetric method to determine curcumin in lipid and polymeric nanocapsule suspensions, Braz. J. Pharm. Sci, Vol. 46 no 2 Maheshwari R, Singh A, Gaddipati J, Srimal R, 2006, Multiple biological activities of curcumin: a short review. Life Sci., 78: 2081-2087
Maiti K, Mukherjee K, Gantait A, Saha BP, Mukherjee PK, 2007, Curcumin
Phospholipid Complex: Preparation, Therapeutic Evaluation and
Pharmacokinetic Study in Rats, International Journal of Pharmaceutics, 330: 155-163
Merrel JG, Mclaughlin SW, Yie L, Laurrencin CT, Chen AF, Nair LS, 2009,
Curcumin-loaded poly(e-caprolactone) nanofibres: Diabetic wound dressing with anti-oxidant and anti-inflammatory properties, clinical, and experimental
16
Nam S, Nam H, Joo J, Baek I, Park J, 2007, Curcumin-loaded PLGA nanoparticles coating onto metal stent by electrophoretic deposition techniques, Bull. Korean chem. Soc., 28: 397-402
Namita P, Muskesh R, 2012, Medicinal plants used as antimicrobial agents: A review, Int Res J Pharm, 3: 31-40
Pak Y, Patek R, Mayersohn M, 2003, Sensitive and Rapid Isocratic Liquid Chromatography Method for The Quantitation of Curcumin in Plasma, Journal of Chromatography B, 796: 339-346
Sharma K, Agrawal SS, Gupta M, 2012, Development and validation of UV spectrophotometric method for the estimation of curcumin in bulk drug and
pharmaceutical dosage forms, International Journal of Drug
Development & Research, 4(2): 375-380
Smith R, karen S, Phillip D, 1981, Fluorometric techniques for the measurement of oceanic chlorophyll in the support of remote sensing, SIO ref. 81-17
Sou K, Inenaga S, Takeoka S, Tsuchida E, 2008, Loading of curcumin into macrophages using lipid-based nanoparticles, Int. J. Pharm., 352: 287-293 Sutrisno D, Sukarianingsih, Saiful A, Putrika DI, Kusumaningtyas, 2008,
Curcuminoids from Curcuma xanthorrhiza roxb: Isolation, characterization, identification and analysis of antioxidant activity, Proceeding of the first international symposium on temulawak, Biopharmaca, Res. Center Bogor Agri Univ., 225-233
Tiyaboonchai W, Tungpradit W, Plianbangchang P, 2007, Formulation and characterization of curcuminoids loaded solid lipid nanoparticles, Int. J. Pharm., 337: 299-306 Mixed Micelle, Journal of Fluorescence, 16: 53-59
Yang F, Shen Y, Camp DGII, Smith RD, 2012, High pH Reversed-Phase Chromatography with Fraction Concatenation for 2D Proteomic Analysis, Expert Review Proteomics, 9: 129-134
Yang F, Liu C, Wei Y, 2012, Fluorimetric Analysis of Paeonol in Chinese Herbal Medicine Cynanchi Paniculati Radix by Aluminum Ion-Sensitized Fluorescence, Acta Pharmaceutica Sinica B, 2: 294-299
18
Appendix 1 Flow chart of the research
Materials and Equipment Preparation
Solution Preparation
Preparation of Standard Calibration of Curcumin
Determination of LOD and LOQ
Measurement of Fluorescence Intensity for Temulawak and Turmeric Extracts
Determination of Curcumin Concentration in Samples
Comparison Against Measurements from
HPLC
19
Appendix 2 Concentration of temulawak for every fluorescence intensity Bottom Optic (GA=500)
Temulawak (Intensity)
curcumin (1) curcumin (2) curcumin (3)
36 0.154 0.138 0.168
curcumin (1) curcumin (2) curcumin (3)
1340 0.1178 0.1054 0.1174
curcumin (1) curcumin (2) curcumin (3)
39 0.109 0.158 0.247
curcumin (1) curcumin (2) curcumin (3)
1186 0.12732 0.0786 0.12846
1734 0.19308 0.1334 0.18874
20
Appendix 3 Concentration of turmeric for every fluorescence intensity Bottom Optic (GA=500)
turmeric (intensity) curcumin (1) curcumin (2) curcumin (3)
23 0.037 0.034 0.064
28 0.082 0.074 0.104
26 0.064 0.058 0.088
Bottom Optic (GA=1000)
turmeric (intensity) curcumin (1) curcumin (2) curcumin (3)
559 0.02408 0.01949 0.03149
562 0.02444 0.01982 0.03182
591 0.02792 0.02301 0.03501
Top Optic (GA=500)
turmeric (intensity) curcumin (1) curcumin (2) curcumin (3)
34 0.034 0.123 0.207
35 0.049 0.13 0.215
33 0.019 0.116 0.199
Top Optic (GA=1000)
turmeric (intensity) curcumin (1) curcumin (2) curcumin (3)
500 0.045 0.01 0.053
634 0.06108 0.0234 0.06774
21
Appendix 5 HPLC data for temulawak extract
Sample
40IV15 BISDESMETOKSI KURKUMIN 0.0521 50 0.2382 0.0238
DESMETOKSI KURKUMIN 0.0521 50 4.1203 0.412
KURKUMIN 0.0521 50 10.6365 1.0636
Appendix 6 HPLC data for turmeric extract
Sample 050/XI BISDESMETOKSI KURKUMIN 0.0500 50 0.1007 0.01007
DESMETOKSI KURKUMIN 0.0500 50 0.1301 0.01301
22
CURRICULUM VITAE