SUPERVISOR DECLARATION
“I hereby declare that I have read this thesis and in my opinion this thesis is sufficient in terms of scope and quality for the award of the degree of
Bachelor of Mechanical Engineering (Plant & Maintenance)”
Signature : ………..
Name : DR NOR SALIM BIN MUHAMMAD
EFFECT OF SIZE PZT ELEMENTS ON THE EXCITATION OF PHASED ARRAY TRANSDUCER IN BEAM STEERING AND BEAM FOCUSING
TECHNIQUE
MUHAMMAD SHAZWAN BIN ABDUL RAZAK
A thesis submitted in partial fulfilment of the requirement for the award of the degree of
Bachelor of Mechanical Engineering (Plant & Maintenance)
Faculty of Mechanical Engineering Universiti Teknikal Malaysia Melaka
ii
DECLARATION
“I hereby declare that the work in this thesis is my own except for summaries and quotation which have been duly acknowledged”
Signature : ………..
Name : MUHAMMAD SHAZWAN BIN ABDUL RAZAK
iii
Dedicated to my parents, Abdul Razak bin Hussain and
Zaiton binti Ramli My supporting siblings,
Muhammad Shamier bin Abdul Razak Muhammad Shauqi Izham bin Abdul Razak and
Nur Hidayah binti Abdul Razak and
iv
ACKNOWLEDGEMENT
I would like to express my gratitude and respect to my supervisor, Dr. Nor Salim bin Muhammad
for the guidance and assistance throughout this project.
My deepest gratitude is to my parents and my siblings for always staying on my side. Their constant support, encouragement, love and patience
gave me security and sustained me through my journey.
I also would like to acknowledge anyone who has supported me in anyway during my four years degree studies at
v
ABSTRACT
vi
ABSTRAK
vii
TABLE OF CONTENTS
CHAPTER CONTENT
PAGES
DECLARATION ii
DEDICATION iii
ACKNOWLEDGEMENT iv
ABSTRACT v
ABSTRAK vi
TABLE OF CONTENT vii
LIST OF TABLE x
LIST OF FIGURE xi
LIST OF SYMBOL xvi
LIST OF APPENDIX xvii
CHAPTER I INTRODUCTION 1.0 Overview 1.1 Background
1.1.1 Ultrasonic Testing on Plate 1.1.2 Ultrasonic Testing on Pipe
1.2 Problem Statement in Ultrasonic Testing Method
1.2.1 Linear Beam Separation 1.2.2 Mechanical Scanning
1.2.3 Difficult Access On Testing Material
1.3 Advantages in Using Ultrasonic Phased Array 1.4 Objectives
1.5 Scope of Study
viii
CHAPTER II LITERATURE REVIEW 2.0 Overview
2.1 Introduction of Phased Array Transducer 2.1.1 Beam Focusing and Beam Steering of Phased Array
2.1.2 Effect on Number and Size of Transducer 2.2 Guided Wave
2.2.1 Modes of Lamb Wave
2.2.2 Dispersion Curve of Group Velocities and Phase Velocities 13 13 13 16 17 18 19 19
CHAPTER III METHODOLOGY 3.0Overview 3.1Flowchart
3.2Dispersion Curve of Group Velocity for Aluminium
3.3Algorithm of Time Delay
3.3.1 Time Delay of Beam Focusing 3.3.2 Time Delay of Beam Steering 3.4Finite Element Modelling On Defects 3.5 Excitation of Guided Wave on FEM
22 22 23 24 27 27 29 30 35
CHAPTER IV RESULT AND ANALYSIS 4.0 Overview
4.1 Effect of Size PZT Elements on the Excitation Guided Wave Beam Focusing Phased Array of A0 mode at 1600 mm
4.1.1 The Excitation Guided Waves Phased Array of Rectangular Shape of Elements
4.1.2 The Excitation Guided Waves Phased Array of Square Shape of Elements
4.1.3 The Excitation Guided Waves Phased Array
36 36
37
37
ix
of Distance Between Elements
4.2 Effect of Size PZT Elements on the Excitation Guided Wave Beam Steering Phased Array of A0 mode at 1600 mm
4.2.1 The Excitation Guided Waves Phased Array of Rectangular Shape of Elements
4.2.2 The Excitation Guided Waves Phased Array of Square Shape of Elements
4.2.3 The Excitation Guided Waves Phased Array of Distance Between Elements
45
49
49
53
56
CHAPTER V CONCLUSION AND RECOMMENDATION 5.0 Conclusion
5.1 Recommendation
61 61 62
REFERENCES
63 APPENDIX
x
LIST OF TABLE
NO. TITLE PAGES
1.1 The dimension parameters of the pipe and other
experimental conditions for guided wave inspection 8 2.1 Comparisons of small pipe weld inspections time and
conditions for manual UT, RT and phased arrays 15
2.2 Properties of the aluminium 20
3.1 Proposed size of PZT elements used in simulation 34
xi
LIST OF FIGURES
NO. TITLE PAGES
1.1 Ultrasonic waves from transducer (a) without flaw and
(b) with flaw 2
1.2. Longitudinal wave
(Source: Diligent, (2003)) 3
1.3 Transversal wave
(Source: Diligent, (2003)) 3
1.4 Guided wave inspections for corrosion defect on plate 4 1.5 Data presentation in ultrasonic testing (a) A-scan (b)
B-scan and (c) C-B-scan 5
1.6 Ultrasonic testing on plate using (a) contact transducer
(b) immersion transducer 7
1.7 Schematic diagram of guided ultrasonic wave
inspections on pipe 8
1.8 Beam separation (a) normal beam (b) phased array
beam 10
1.9 Mechanical scanning of conventional ultrasonic
transducer 10
2.1 Linear array geometry and typical field of view
(Source: Lawrence, (1998)) 14
2.2
Beam focusing with time delays
xii
(Source: NDT, (2007))
2.3 Beam steering with time delays
(Source: NDT, (2007)) 17
2.4 Grating lobe, main lobe and side lobe 18
2.5 Mode of guide propagation in (a) S-mode and (b)
A-mode 19
2.6 Group velocity dispersion curve 20
2.7 Phase velocity dispersion curve 21
3.1 Flowchart of simulation 23
3.2 Group velocity dispersion curve 25
3.3 Phase velocity dispersion curve 25
3.4 Applied force using Tone Burst signal frequency
100kHz (4 cycles). 26
3.5 Centre of frequency at 100 kHz 26
3.6 Direction of the beam focusing phased array transducer 28 3.7 S0 mode array signal of beam focusing at 600 mm 28 3.8 Direction of the beam steering phased array transducer 29 3.9 Array signal of beam steering at angle -30 degrees 30 3.10 Plate with blind defect for (a) beam focusing and (b)
beam steering 31
3.11 Mesh control used in modelling 32
3.12 Assembly of PZT element and aluminium plate in
ABAQUS 33
3.13 Schematic diagram of element used in simulation 33
3.14 Direction force applied of S0 mode 35
3.15 Direction force applied of A0 mode 35
4.1 Wave interaction behaviour in z-direction for A0 mode
with element height at 6mm 38
4.2 Time waveform at receiver point with element height
xiii
4.3 Wave interaction behaviour in z-direction for A0 mode
with element height at 12 mm 39
4.4 Time waveform at receiver point with element height of
12 mm 39
4.5 Wave interaction behaviour in z-direction for A0 mode
with element height at 24 mm 40
4.6 Time waveform at receiver point with element height of
24 mm 40
4.7 Time waveform for different rectangular size elements
at receiver point in beam focusing 41
4.8 Wave interaction behaviour in z-direction for A0 mode
with square element of 3 mm 42
4.9 Time waveform at receiver point with square elements
size of 3 mm 42
4.10 Wave interaction behaviour in z-direction for A0 mode
with square element of 6 mm 43
4.11 Time waveform at receiver point with square elements
size of 6 mm 43
4.12 Time waveform for different square size of elements at
receiver point in beam focusing 44
4.13 Wave interaction behaviour in z-direction for A0 mode
with distance of element at 1/4 λ 45
4.14 Time waveform at receiver point with distance between
elements at 1/4 λ 46
4.15 Wave interaction behaviour in z-direction for A0 mode
with distance of element at 3/4 λ 46
4.16 Time waveform at receiver point with distance between
elements at 3/4 λ 47
4.17 Wave interaction behaviour in z-direction for A0 mode
with distance of element at 5/4 λ 47
4.18 Time waveform at receiver point with distance between
elements at 5/4 λ 48
xiv
at receiver point in beam focusing 48
4.20 Wave interaction behaviour in z-direction for A0 mode
with element height at 6mm 49
4.21 Time waveform at receiver point with element height of
6 mm 50
4.22 Wave interaction behaviour in z-direction for A0 mode
with element height at 12 mm 50
4.23 Time waveform at receiver point with element height of
12 mm 51
4.24 Wave interaction behaviour in z-direction for A0 mode
with element height at 24 mm 51
4.25 Time waveform at receiver point with element height of
24 mm 52
4.26 Time waveform for different rectangular size elements
at receiver point in beam steering 53
4.27 Wave interaction behaviour in z-direction for A0 mode
with square element of 3 mm 54
4.28 Time waveform at receiver point with square elements
size of 3 mm 54
4.29 Wave interaction behaviour in z-direction for A0 mode
with square element of 6 mm 55
4.30 Time waveform at receiver point with square elements
size of 6 mm 55
4.31 Time waveform for square size of elements at receiver
point in beam steering 56
4.32 Wave interaction behaviour in z-direction for A0 mode
with distance of element at 1/4 λ 57
4.33 Time waveform at receiver point with distance between
elements at 1/4 λ 57
4.34 Wave interaction behaviour in z-direction for A0 mode
with distance of element at 3/4 λ 58
4.35 Time waveform at receiver point with distance between
xv
4.36 Wave interaction behaviour in z-direction for A0 mode
with distance of element at 5/4 λ 59
4.37 Time waveform at receiver point with distance between
elements at 5/4 λ 59
4.38 Time waveform for different distance between elements
xvi
LIST OF SYMBOL
= Element width, m
= Material wave speed, = Angular velocity, rad/s
= Wave number
xvii
LIST OF APPENDIX
NO. TITLE PAGES
A MATLAB Coding for Beam Focusing 66
1
CHAPTER I
INTRODUCTION
1.0 OVERVIEW
This chapter covers the introduction of this project that involved the project background, problem statement, objectives of the project and scope of study.
1.1 BACKGROUND
2
PZT elements is defined as lead zirconate titanate (Pb[Zr(x)Ti(1-x)]O3) that have been widely used in piezoelectric transducer. According to (Ting hai Cheng, Xiang-dong Guo and Gang Bao, 2011), PZT elements is used to produce bending cylindrical transducer that transforms input electrical energy to output mechanical energy in ultrasonic transducer, their excitation position and excitation modes. Length and thickness of PZT elements need to consider in order enhancing the output characterization type transducer.
Pulse-echo inspection technique is most widely used for ultrasonic inspection of components. In pulse-echo inspection technique, ultrasonic sound energy is transmitted between the face of the transducer and the surface of the test component. When ultrasonic energy penetrates into a material and strike a discontinuity or flaw, part of energy will be reflected back to the probe and the remaining part propagates in the material in forward direction as shown in Figure 1.1 (a) and (b). To facilitate the transmission of ultrasonic energy between the transducer and the test component, a couplant that made from water based material is used between the transducer and the surface of the plate. (Baldev Raj, T. Jayakumar, and M. Thavasimuthu, 2008).
Transducer Transducer
Flaw
Plate Plate
(a) (b)
Couplant
3
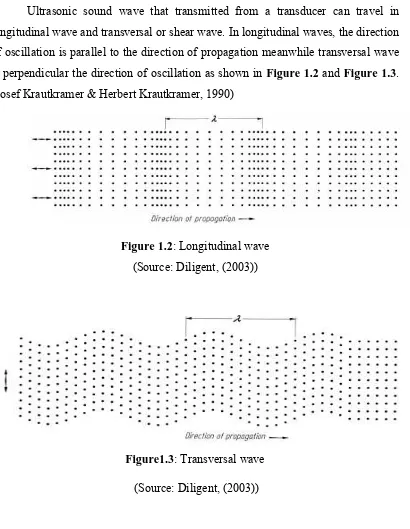
Ultrasonic sound wave that transmitted from a transducer can travel in longitudinal wave and transversal or shear wave. In longitudinal waves, the direction of oscillation is parallel to the direction of propagation meanwhile transversal wave is perpendicular the direction of oscillation as shown in Figure 1.2 and Figure 1.3. (Josef Krautkramer & Herbert Krautkramer, 1990)
Figure 1.2: Longitudinal wave (Source: Diligent, (2003))
Figure1.3: Transversal wave (Source: Diligent, (2003))
4
echo mode for the corroded plate at each level of corrosion and the readings were compared with the healthy readings. (Ramandeep Singh, Shruti Sharma & Sandeep Sharma, 2014)
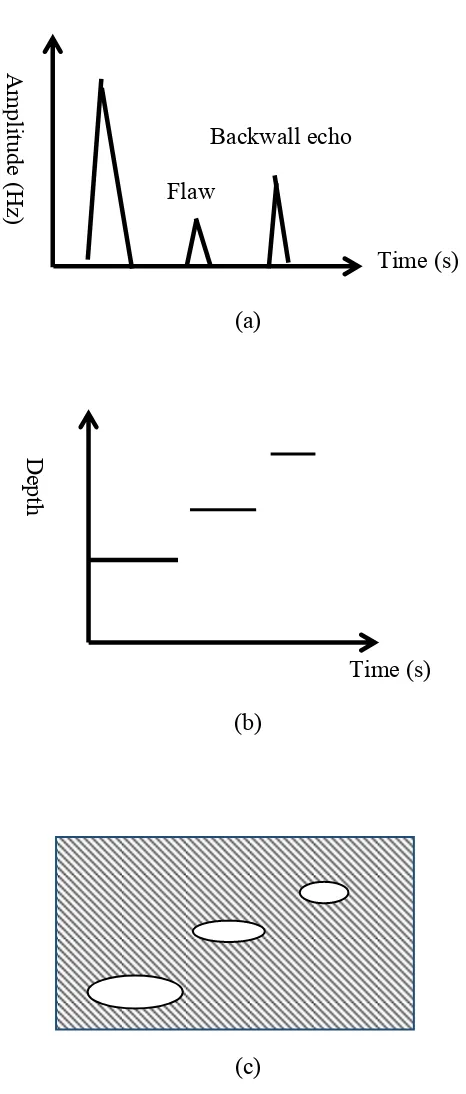
In ultrasonic testing, the results can be displayed in several conditions which called A-scan, B-scan and C-scan presentation.
Figure 1.5 (a) shown A-scan that display amount of received ultrasonic energy as a time waveform. The relative amount of received energy is plotted in along the vertical axis against the time elapsed in horizontal axis. Relative discontinuity size can be estimated in A-scan by comparing the signal amplitude obtained with unknown reflector to known reflector.
Figure 1.5 (b) shown B-scan that display the cross sectional view or depth of the test material. In this B-scan presentation, the depth of reflector and its linear dimension in the scan direction can be visualized
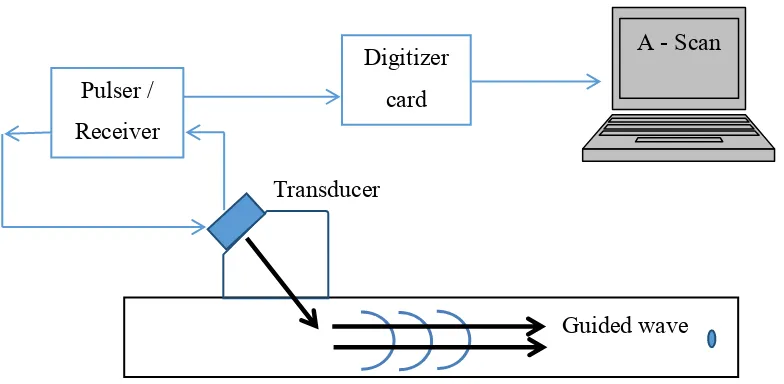
Figure 1.4: Guided wave inspections for corrosion defect on plate Guided wave Transducer
Pulser / Receiver
Digitizer card
5
Figure 1.5 (c) shown C-scan presentation that visualise the image in two dimensions that from reflected ultrasound signal that provides a top view of the location and size of the test material using an automated data acquisition system.
(a)
(b)
(c)
Figure 1.5: Data presentation in ultrasonic testing (a) A-scan (b) B-scan (c) C-scan Flaw
Backwall echo
A
m
pl
itude
(H
z)
Time (s)
Time (s)
D
ept
h
(m
m
6
Ultrasonic testing had been used since 1940’s applied by Firestone and Simon that developed pulsed ultrasonic testing using a pulse-echo technique. This testing is continually improved after World War II when a group of researchers from Japan develop medical diagnostic using ultrasound (History of Ultrasonic, 2014). At the same time, Nobel Laureate Luis Alvarez used phase array transmission in a rapidly-steer in “ground controlled approach”, a system to help the landing aeroplanes in Britain (Swapana Koganti & Kaapaarapu Satish Babu, 2012). A phased array consist several sets of elements that pulsed to produce sound beam by means controlled interference pattern in a desired direction. The ultrasonic phased array is widely used in medical applications that used multi-elements piezoelectric device which individually excited by electric pulse at programmed time delay (Joon Hyun Lee & Sang Woo Choi, 2000).
1.1.1 ULTRASONIC TESTING ON PLATE
Manufacturing stages of plate type nuclear fuel elements produced structural discontinuity such as cracks and bonding due to mechanical and thermal processing conditions. This discontinuity reduces the performance of the nuclear fuel during its operational life. Mucio Jose and teammates has conducted the non-destructive test using ultrasonic testing to detect bonding failures at core interface during hot rolling process. They has been used two different types of ultrasonic transducer which is contact transducer as shown in Figure 1.6(a) range in 10 MHz and 15 MHz and immersion transducer as shown in Figure 1.6(b) range from 4 MHz and 10 MHz.