Income sources, poverty, and forest encroachment: Implications for rural development policies in Central Sulawesi, Indonesia
Stefan Schwarze1, Manfred Zeller2, and Nunung Nuryartono3 5
1
Institute of Rural Development, University of Göttingen, Waldweg 26, D-37073 Göttingen, Germany, email: [email protected]
2
Institute of Agricultural Economics and Social Sciences in the Tropics and Subtropics (490a), University of Hohenheim, D-70593 Stuttgart, Germany,
10 email: [email protected] 3
Departement of Economic Sciences. Faculty of Economics and Management. Bogor Agricultural University. Jl Lingkar Kampus Gd Wing Rektorat Lt 3. Bogor, Indonesia, email : [email protected]
15
20
Contributed paper prepared for presentation at the International Association of Agricultural Economists Conference, Gold Coast, Australia, August 12-18, 2006
Abstract
This paper analyses the determinants of income generating activities of rural households in the vicinity of the Lore-Lindu National Park in Central Sulawesi, Indonesia. The focus is on activities which threaten the integrity of the national park (perennial crop production and sale of forest products) and on non-agricultural activities (wage labour and self-employment) which are able to reduce poverty without threatening the national park. The analysis allows to identify factors which are essentially for the design of policies and programmes aiming to promote rural development and to protect the
national park. Perennial crop production and activities outside the agricultural sector are particularly important for the less-poor households, whereas the selling of forest
products is especially important for the poorest households. The econometric analysis shows that the possession of irrigated land, the access to social capital, and the
participation in formal credit markets positively influences perennial crop production, which is a major source of deforestation. The possession of irrigated land, education, and the access to road infrastructure have a negative influence on the sale of forest products which are mainly collected inside the national park. A key factor influencing income from non-agricultural wage labour is the level of education. Policy conclusions with respect to poverty alleviation and protection of the national park are drawn. 5
10
15
20
1. Introduction
The province of Central Sulawesi is one of the poorest provinces in Indonesia.
source of deforestation, often located inside the LLNP (Maertens, 2003). This ongoing encroachment and the collection of forest products threaten the integrity of the park. Alternative income sources that are able to reduce poverty as well as reduce the pressure on the national park are needed for rural households.
5
10
15
20
This paper aims to identify and analyse the determinants of income generating activities of rural households in the vicinity of the Lore-Lindu National Park. The focus is on activities, which threaten the integrity of the national park (perennial crop production and sale of forest products) and on non-agricultural activities (wage labour and self-employment), which represent alternative income sources. The paper helps to identify factors which are essentially for the design of policies and programmes aiming to promote rural development and to protect the national park. Specifically, the following research questions will be addressed: (1) In which income activities are rural households engaged? (2) Do poor households differ from less-poor households in their activities? (3) Which factors influence the participation in different activities? (4) Which factors influence the income gained from different activities? (5) Which policy conclusions can be drawn from the results, with respect to poverty alleviation, deforestation, and rural development?
The paper contributes to the scarce empirical literature on the linkages between activity choice of rural households, poverty, and forest encroachment. As a novel feature in this context, the econometric model takes into account simultaneity and endogeneity of activity choice.
2. Conceptual framework
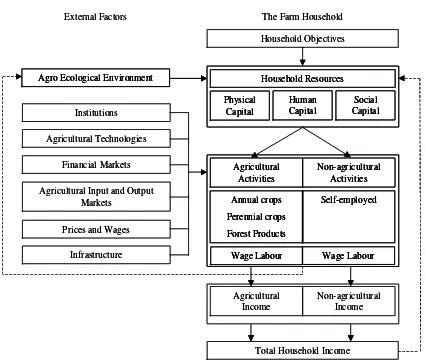
household’s resources as determinants of activities (Ellis 2000). The conceptual framework used in this work builds on the features of this approach. A similar
framework has been used by Zeller and Minten (2000) to evaluate the consequences of market liberalisation on the income of rural households. The household is assumed to maximise its utility, which is a function of the consumption of goods and leisure. It is subject to a time and budget constraint. According to its objective, the household
allocates its resources to activities subject to factors which are external to the household (see Figure 1). These activities generate outcomes which will meet the objectives. The activities as well as the income generated have an effect on the stock of resources available to the household in the future as well as on the agro ecological environment. 5
10
15
20
Figure 1 3. Definition and classification of income
Income is measured for a time period of 12 months and includes both cash and in-kind contributions. All the goods and services produced are valued at market producer prices regardless of their use. Cash-expenditures incurred in the production process are
subtracted from the gross-output to derive net incomes (Ellis, 2000). Due to difficulties in valuing firewood, which is only gathered for home consumption, income from forest products contains the value of products sold only.
Income sources are classified according to sectors (agriculture and non-agriculture) and functions (wage and self-employment) as proposed by Barrett et al. (2001), but further disaggregate agricultural self-employment into three different activities: annual crops, perennial crops, and forest products.
4. Econometric issues
models. Similar models have been widely used in the literature, for example in Corral and Reardon (2001) and Lanjouw et al. (2001). A feature of all these income activities is that many households do not participate in them, which can cause sample or, more precisely, self-selection bias (Wooldridge, 2002). As the commonly used Heckit model is not able to account for the simultaneity of activity choice and because in Tobit models the selection process is modelled only implicitly, we follow an approach
proposed by Taylor and Yunez-Naude (2000) for the analysis of activity incomes. They use a seemingly unrelated regression model in which the dependent variables are censored by unobserved latent variables. Moreover, they control for the endogeneity of activity choice by including the activity specific Inverse Mills Ratio (IMR) as right-hand variables in the corresponding activity income equations. The econometric
approach follows a generalisation by Lee (1978) of an estimation principle by Amemiya (1977). Only assets which are expected to affect the income level of that activity are included as explanatory variables in the corresponding income equation. Winters et al. (2002) and Yunez-Naude and Taylor (2001) used the same approach in similar settings. 5
10
15
20
5. Income and activities
In the research area perennial crop production is the most important activity
agriculture, just 17% of the households earned income from this activity. In contrast, 81% take part in the production of annual crops and 76% cultivate perennial crops.
Table 1
The analysis so far referred to all households, but how does this change if we look at different wealth groups? Applying a poverty index as calculated in Abu Shaban (2001), incomes and activities have been differentiated by poverty terciles: poorest (poverty group 1), poor (poverty group 3), and less-poor households (poverty group 3).
Agricultural self-employment activities are the most important source of income for all socio-economic groups, but for the poorest households they contribute almost three-quarters to their total household income (see Table 2). The same also applies for income from forest products and agricultural wage labour, which is more important for the poorest households than for the poor and less-poor households. For income derived from outside the agricultural sector it is the other way around. Self-employment outside agricultureis particularly important for households that are better off. Also, the number of households participating is statistically different between socio-economic groups for all activities except for the cultivation of annual crops. Participation in the sale of forest products and in agricultural wage labour activities is comparatively low for households that are better off. In the case of perennial crop production and non-agricultural
activities it is the other way around. In the production of perennial crops 87% of the better-off households are involved, whereas only 67% of the poorest households generate income from this activity. In agricultural self-employment and in non-agricultural wage employment 26% and 25% of the better-off households participate, respectively.
5
10
15
20
6. Results of the econometric analysis
In all models a common set of explanatory variables has been used to enable
comparisons of the influence of variables across models. Table 3 presents a description of the regressors used.
5
10
15
20
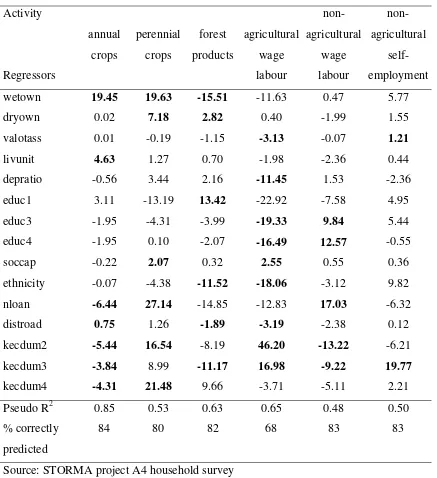
Table 3 6.1 Participation by activity
Table 4 presents the regression results for activity participation, with coefficients with a significance level greater than 90% in bold. The possession of land has a strong positive influence on the participation in annual and in perennial crop production. The first relationship is not surprising, since annual crops are grown on irrigated as well as rainfed land. In the case of perennial crops, which are grown on rainfed land only, the positive influence of irrigated land owned may indicate that participation in the production of perennial crops, which are mainly cash crops, requires at least some production of rice for home consumption. The possession of irrigated land also reduces the likelihood of participation the selling of forest products. The possession of other assets reduces participation in agricultural wage labour, whereas it increases the
likelihood of participation in non-agricultural self-employment activities. This indicates that less-poor households are more likely to participate in the latter activity, whereas poorer households tend to participate in agricultural wage labour activities.
Table 4
households are more likely to participate in agricultural wage labour and in the selling of forest products. Borrowing money from the Bank Rakyat Indonesia (BRI) during the last 5 years increases the probability of participating in perennial crop production. This result suggests that formal loans are used to start the production of perennial crops. Increasing distance to a tarmac road reduces the likelihood of participating in wage labour activities and in the selling of forest products.
5
10
15
20
6.2 Income by activity
While the previous section evaluated the probability of participation in activities, this section analyses factors influencing the level of income from each activity. The same income activities are used with the same set of explanatory variables, but only those physical assets that are expected to influence the income level of a certain activity are included. Table 5 presents the regression results, with coefficients with a significance level greater than 90% in bold.
As expected, the area of land owned plays an important role not only in crop
production, but also in the selling of forest products and in wage labour activities. Thus, the very labour intensive production of paddy rice not only reduces the likelihood of participation, but also reduces the income gained from these activities.
Table 5
production and non-agricultural self-employment. The distance to the next tarmac road has a statistically significant influence on income from agricultural wage labour
activities and the selling of forest products. 7. Conclusions
5
10
15
20
An important area of concern is the income derived from perennial crops, because coffee and cocoa are a major source of deforestation. Perennial crop production is more important for better-off households and the econometric analysis shows that the
possession of land and the participation in credit markets positively influences
participation in perennial crop production. The positive influence of borrowing money from the BRI on participation suggests that such loans are used to start the production of perennial crops, which accelerate the conversion of forest into cocoa plantations.
Therefore, formal credit should be redirected into activities which do not threaten the integrity of the national park. Nevertheless, all such policies aiming to protect the park should be accompanied by better law enforcement, either through the National Park Authority or community agreements (for an evaluation of such agreements in the research area see Mappatoba, 2003).
Utara with Lore Selatan (ANZDEC, 1997). Alternative plans to build these roads further away from the national park boundaries would be preferable. Another discouraging factor is the area of irrigated land owned. Fostering the construction of irrigated rice fields for poor households can absorb their labour force and prevent them from collecting forest products.
5
10
15
20
The descriptive analysis shows that non-agricultural activities are particularly important for less-poor households, whereas poor households are more engaged in agricultural activities. Reardon et al. (1998) call this the “interhousehold paradox”: the poorest households, while having the greatest need for non-agricultural income, are also the most constrained. The econometric analysis shows that the endowment of other assets is one such constraint in the case of non-agricultural self-employment. Poorer households, because of their lower endowment with physical capital not related to agriculture, have fewer opportunities to participate and derive income from non-agricultural
self-employment. Therefore, potential non-agricultural activities have to be carefully evaluated as to whether they suit the assets owned by poor households.
Another key factor influencing income from non-agricultural wage labour is education. The improvement of the access to secondary and tertiary education is a prerequisite for wage labour employment outside the agricultural sector. Therefore, rural development policies could promote the establishment of additional junior and senior high schools. But, the demand for better-educated people also has to be improved, especially in the private sector. So far, the state is the most important employer and governmental budgets are tight.
References
programs in Central Sulawesi – Indonesia. MSc-Thesis, Institute of Rural Development, Georg-August University, Goettingen.
Amemiya, T. 1977. The estimation of a simultaneous-equation Tobit model. Technical Report 236, Institute for Mathematical Studies in the Social Sciences, Stanford University, Stanford.
5
10
15
20
ANZDEC 1997. Report on the Central Sulawesi Integrated Area Development and Conservation Project. Central Sulawesi Integrated Area Development and Conservation Project, Palu.
Barrett, C. B., Reardon, T., Webb, P. 2001. Nonfarm income diversification and household livelihood strategies in rural Africa: Concepts, Dynamics, and Policy Implications, Food Policy 26, 315-331.
Corral, L., Reardon, T. 2001. Rural nonfarm incomes in Nicaragua, World Development 29, 427-442.
Ellis, F. 2000. Rural livelihoods and diversity in developing countries, Oxford University Press, Oxford.
Lanjouw, P., Quizon, J., Sparrow, R. 2001. Non-agricultural earnings in peri-urban areas of Tanzania: Evidence from household survey data’, Food Policy 26, 385-403. Lee, L.-F. 1978. Simultaneous equation models with discrete and censored dependent
variables’. In: Manski, P., McFadden, D. (Eds.), Structural analysis and discrete data with econometric applications, MIT Press, Cambridge, pp. 346-364.
Maertens, M. 2003. Economic modeling of agricultural land-use patterns in forest frontier areas. Ph.D.-thesis, Institute of Rural Development, Georg-August University, Goettingen.
agreements on conservation in the Lore Lindu National Park, Central Sulawesi, Indonesia. Ph.D.-thesis, Institute of Rural Development, Georg-August University, Goettingen.
Reardon, T., Stamouis, K., Balisacan, A., Cruz, M. E., Berdegue, J., Banks, B. 1998. Rural non-farm income in developing countries. In: FAO (Eds.), The State of Food and Agriculture 1998. FAO, Rome, pp. 281-356.
5
10
15
20
Suryahadi, A., Sumarto, S. 2001. The chronic poor, the transient poor, and the vulnerable in Indonesia before and after the crisis. Working paper, SMERU Research Institute, Jakarta.
Taylor, J. E., Yunez-Naude, A. 2000. The returns from schooling in a diversified rural economy, American Journal of Agricultural Economics 82, 287-297.
Winters, P., Davis, B., Corral, L. 2002. Assets, activities and income generation in rural Mexico: Factoring in social and public capital’. Agricultural Economics 27, 139-156.
Wooldridge, J. M. 2002. Econometric analysis of cross section and panel data, MIT Press, Cambridge and London.
Yunez-Naude, A., Taylor, J. E. 2001. The determinants of nonfarm activities and incomes of rural households in Mexico, with emphasis on education, World Development 29, 561-572.
Table 1: Income and participation by activity
Income (IDR 1000)
% of total income
Number of households participating
% of all households
Total household income 5909 100 278 96
Agricultural income –
Self-employed 3521 59 236 81
Income from annual crops 1165 20 221 76
Income from perennial crops 1460 24 183 63
Livestock Income 477 8 49 17
Income from forest products 399 7 134 46
Agricultural income –
Wage labour 626 11 51 18
Non-agricultural income –
Self-employed 991 17 50 17
Non-agricultural income -
Wage labour 766 13
Table 2: Income and participation by activity and poverty group Income in % of total
household income
% of households participating
Poverty group 1 2 3 1 2 3
Agricultural income -
Self-employed 73 54 57 96 96 95
Annual crops 23 26 16 86 79 78
Perennial crops 23 17 28 67 77 87
Livestock income 6 3 11 73 52 65
Income from forest products 21 7 1 30 14 4
Agricultural income -
Wage labour 17 19 5 47 58 31
Non-agricultural income -
Self-employed 3 10 25 7 21 26
Non-agricultural income -
Wage labour 6 17 14 10 18 25
Table 3: Variable descriptions and summary statistics
Variable Description Mean Std. dev. Min. Max.
wetown Irrigated area owned (ha) 0.32 0.54 0 4.52 dryown Rainfed area owned (ha) 1.34 1.67 0 10.50 valotass Value of other assets (IDR 1 mill) 3.30 9.23 0 170.20 livunit Livestock units owned 0.58 0.91 0 6.36
depratio Dependency ratio 0.70 0.61 0 5.00
Highest level of schooling of the adult household membersa
educ1 not finished primary school 0.05 0.21 0 1 educ3 finished secondary school 0.29 0.45 0 1
educ4 finished tertiary school 0.27 0.44 0 1
soccap Social capital index 1.96 2.49 0 16.00
ethnicity Ethnicity of head of household (1=non-indigenous)
0.19 0.39 0 1.00
nloan Household received loan from BRI in last 5 years (1=yes)
0.06 0.24 0 1.00
distroad Walking distance house - road (hours) 1.43 3.62 0 13.00 Sub district dummiesb
kecdum2 Sub district dummy for Palolo 0.22 0.42 0 1.00 kecdum3 Sub district dummy for Sigi-Biromaru 0.36 0.48 0 1.00 kecdum4 Sub district dummy for Kulawi 0.23 0.43 0 1.00 Source: STORMA project A4 household survey
Number of observations=291
Notes: a In contrast to finished primary school. b In contrast to the sub district of Lore Utara.
Table 4: Probit results for activity participation Activity
Regressors
annual crops
perennial crops
forest products
agricultural wage labour
non-agricultural
wage labour
non-agricultural
self-employment
wetown 19.45 19.63 -15.51 -11.63 0.47 5.77
dryown 0.02 7.18 2.82 0.40 -1.99 1.55
valotass 0.01 -0.19 -1.15 -3.13 -0.07 1.21
livunit 4.63 1.27 0.70 -1.98 -2.36 0.44
depratio -0.56 3.44 2.16 -11.45 1.53 -2.36
educ1 3.11 -13.19 13.42 -22.92 -7.58 4.95
educ3 -1.95 -4.31 -3.99 -19.33 9.84 5.44
educ4 -1.95 0.10 -2.07 -16.49 12.57 -0.55
soccap -0.22 2.07 0.32 2.55 0.55 0.36
ethnicity -0.07 -4.38 -11.52 -18.06 -3.12 9.82
nloan -6.44 27.14 -14.85 -12.83 17.03 -6.32
distroad 0.75 1.26 -1.89 -3.19 -2.38 0.12
kecdum2 -5.44 16.54 -8.19 46.20 -13.22 -6.21
kecdum3 -3.84 8.99 -11.17 16.98 -9.22 19.77
kecdum4 -4.31 21.48 9.66 -3.71 -5.11 2.21
Pseudo R2 0.85 0.53 0.63 0.65 0.48 0.50
% correctly predicted
84 80 82 68 83 83
Source: STORMA project A4 household survey Number of observations=291
Notes: The coefficients in the table are the percentage change in the probability for an infinitesimal change in each independent, continuous variable and the discrete change in the probability for dummy variables. Coefficients with a significance level greater than 90% are in bold.
Table 5: Selectivity corrected estimates of income equations Activity
Regressors
annual crops
perennial crops
forest products
agricultural wage labour
non-agricultural
wage labour
non-agricultural
self-employment
wetown 360 315 -313 -222 -418
dryown 103 679 -48 -128
valotass -2 -5 79
livunit 572
depratio -84 -459 12 -316 -49 -5
educ1 -181 -160 637 -208 -221 171
educ3 43 -265 -350 -158 348 16
educ4 -88 387 -311 -333 887 107
soccap 108 -71 23 16 -28 -23
ethnicity 350 1079 -30 -144 103 569
nloan 314 -211 -382 -459 3047 -299
distroad 25 -6 -127 -68 21 -3
kecdum2 -600 2283 -333 31 -1542 -584
kecdum3 88 1251 -436 -237 -1444 21
kecdum4 -395 1577 748 -152 -1560 11
constant 540 -636 876 1348 1852 200
Inverse Mills Ratio
785 828 1304 855 2333 1237
R2 0.60 0.71 0.80 0.71 0.79
Source: STORMA project A4 household survey Number of observations=291
Figure 1: Conceptual framework
Agro Ecological Environment
Household Objectives Household Resources Physical Capital Social Capital Human Capital
Total Household Income Agricultural Income Non-agricultural Income Agricultural Activities Non-agricultural Activities Annual crops Perennial crops Forest Products Self-employed
Wage Labour Wage Labour
The Farm Household External Factors
Institutions
Financial Markets
Agricultural Input and Output Markets
Prices and Wages
Infrastructure Agricultural Technologies Agro Ecological Environment Agro Ecological Environment
Household Objectives Household Resources Physical Capital Social Capital Human Capital Household Resources Physical Capital Social Capital Human Capital
Total Household Income Agricultural Income Non-agricultural Income Agricultural Activities Non-agricultural Activities Annual crops Perennial crops Forest Products Self-employed
Wage Labour Wage Labour
Agricultural Activities Non-agricultural Activities Annual crops Perennial crops Forest Products Self-employed
Wage Labour Wage Labour
The Farm Household External Factors
Institutions
Financial Markets
Agricultural Input and Output Markets
Prices and Wages
Infrastructure Agricultural Technologies