APPLICATION OF TOTAL PRODUCTIVE MAINTENANCE TO REDUCE NON-STICK ON PAD PROBLEM IN IC PACKAGING
D. Sivakumar, S.M. Sapuan, N. Ismail and M.Y. Ismail Department of Mechanical and Manufacturing Engineering
Universiti Putra Malaysia 43400 Serdang, Selangor, Malaysia
__________________________________________________________________________
RINGKASAN:
Kaedah peningkatan penumpuan (FI) telah digunakan untuk meningkatkan kualiti produk litar separa alir. Tiga punca tertinggi kemerosotan kualiti dalam unit per juta (ppm) adalah disebabkan oleh: “non-stick on pad” (2715 ppm), “chip dan crack” (782 ppm) dan “missing wire” (687 ppm). “Non stick on pad” (NSOP) adalah disebabkan oleh unit terapung, saiz bola yang kecil, bendasing pada pad dan kaca pada pad. 48% NSOP disebabkan oleh unit terapung. Kertas ini menunjukkan bagaimana FI digunakan untuk mengurangkan NSOP disebabkan oleh unit terapung. Setelah megenalpasti punca unit terapung yang disebabkan ketiadaan asas penahan dan kelemahan sistem vakum langkah-langkah telah diambil untuk menghapuskan dan mengawalselia punca tersebut. Hasilnya NSOP pada unit terapung dikurangkan dari 1300 ppm kepada 650 ppm, pengurangan sebanyak 50% dalam tempoh setahun.
___________________________________________________________________________
ABSTRACT
Focus improvement activity was employed to improve front-end assembly yield in integrated circuit packaging. The top three yield losses in parts per million (ppm) in front-end assembly were contributed by the following defects: non-stick on pad (NSOP) (2715 ppm), chip and crack (782 ppm) and missing wire (687 ppm). NSOP was due to floating die, bonded ball small in size, foreign matter on pad and glassifications. Floating die contributed 48% of the NSOP defect. Detailed explanation on how focus improvement activity used to reduce NSOP due to floating die is demonstrated. Upon identifying the root cause of die floating, which was due to no support and weakness in the vacuum system, actions were taken to eliminate and to control the identified causes. As a result NSOP due to floating die was reduced from 1300 ppm to 650 ppm, a reduction of 50% within one year.
KEYWORDS: Focus improvement, overall equipment effectiveness, total productive maintenance, yield improvement.
INTRODUCTION
Total Productive Maintenance (TPM) method is used to eliminate profit loss or waste due to equipment failure or defect. TPM is designed to achieve maximum efficiency from the equipment while creating a satisfactory working environment.
Manufacturing organisations striving for world-class performance had shown that the contribution of an effective maintenance strategy can be significant in providing competitive advantage through its total productive maintenance (TPM) programme. Furthermore, TPM is considered to be an indispensable contribution to lean production supporting just in time (JIT) manufacture and total quality management (TQM) and has been shown as an essential pillar alongside JIT and TQM to companies seeking world class manufacturing status. TPM is a key value adding business activity that provides an effective and efficient maintenance in manufacturing industry (Bamber et al., 1999).
TPM is a maintenance programme, which involves a newly defined concept for maintaining plants and equipment. The goal of the TPM programme is to markedly increase production while, at the same time, increase employee morale and job satisfaction. The TPM programme closely resembles the popular Total Quality Management (TQM) programme (Amar and Zain, 2002). Many similar tools such as employee empowerment, benchmarking and documentation
are used to implement and optimise TPM (Sivakumar, 2004).
TPM consists of eight pillars; which are autonomous maintenance, focused improvement, planned maintenance, quality maintenance, training and development, office TPM, safety and environment and finally initial flow control (Suzuki, 1994). Focus improvement activities were designed to minimise targeted losses that had been carefully measured and evaluated in TPM. In this research focus improvement is employed to improve yield at the front-end assembly process in integrated circuit (ic) packaging.
There are few processes involved in the front-end assembly of ic packaging. Figure 1 illustrates the process flow of the front-end assembly process in ic packaging.
Figure 1. Front-end assembly process in ic packaging.
START WAFER
MOUNT
DIE BOND SAW
Front-end assembly of ic packaging comprises four types of machines namely wafer mounter, saw, die bond and wire bond.
There are three models of wire bond machine in front-end assembly namely Esec 3088, Esec 3008 and Kns 8020 that are used in the research.
Integrated circuit (IC) also known as die in the assembly floor of semiconductor industry comes in wafer shape from the wafer fabricators. The wafer is circular in shape with 8 inches diameter. The wafer consists of 100 to 1000 or more dies depending on the die size, which can fit on the wafer radius.
Wafer is mounted to wafer ring by means of Mylar tape. It is cut into die form at saw machine. At die bond machine the dies are attached to lead frame flag using glue known as epoxy. Wire bond machine attaches wire to the input/output (I/O) of the die to the lead of the frame. The I/O point on the die is known as bond pad.
The main objective of this paper is to present the results of the study on the reduction of NSOP defect for floating die on rectangular die in semiconductor industry using focus improvement activity.
Six big losses and overall equipment effectiveness.
It is of vital importance to understand and measure disturbances to the manufacturing process. Jonsson and Lesshammar (1999) classify such disturbances as chronic and sporadic according to their frequency of occurrence. Chronic disturbances are usually small, hidden and complicated because they are the result of several concurrent causes. Sporadic disturbances are more oblivious since they occur quickly and as large deviations from the normal state. Sporadic disturbances occur irregularly and their dramatic effects are often considered to lead to serious problems. However, research evidence suggests that it is the chronic disturbances that result in the low utilisation of equipment and the large costs because they occur repeatedly. Overall equipment effectiveness (OEE) attempts to identify these losses (Dal et.al, 2000). Nakajima’s definitions of the “six big losses” are as follows (Nakajima, 1988):
Equipment failure/breakdown losses are categorised as time losses when productivity is reduced and quantity losses caused by defective products.
Set up/adjustment time losses result from downtime and defective products that occur when production of one item ends and the equipment is adjusted to meet the requirements of another item.
The first two big losses are known as downtime losses and are used to help calculate a true value for the availability of a machine.
Idling and minor stop losses occur when the production is interrupted by a temporary malfunction or when a machine is idling.
The third and fourth big losses are speed losses that determine the performance efficiency of a machine, i.e. the losses which occur as a consequence of operating at less than the optimum conditions.
Reduced yield occurs during the early stages of production from machine start up to stabilisation.
Quality defects and rework are losses in quality caused by malfunctioning production equipment.
The final two losses are considered to be losses due to defects, the larger the number of defects the lower the quality rate of parts within the factory.
OEE is measured in terms of these six big losses, which is essentially a function of the availability, performance rate and quality rate of the machine, production line or factory whichever is the focus of OEE application.
OEE (%) = Availability (%) x Performance rate (%) x Quality rate (%) (1)
Where:
Availability (%) = Actual operating time (mins) x 100 (2)
Planned operating time (mins)
Performance rate (%) = (Net operating rate x Operating speed rate) x 100 (3)
Quality rate (%) = Total no. produced – No. scrapped x 100 (4) Total no. produced
The most important objective of OEE is not to get an optimum measure, but to get a simpler measure that indicates the areas for improvement (Johnson and Lesshammar, 1999).
METHODOLOGY
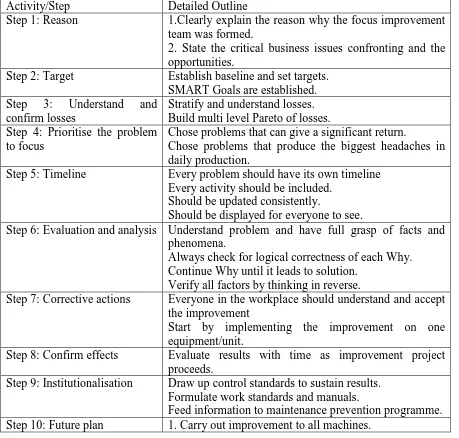
The research had customised focus improvement into 10 steps. These steps are shown in Table1.
Table 1. Step by step procedure for focused improvement
Activity/Step Detailed Outline
Step 1: Reason 1.Clearly explain the reason why the focus improvement team was formed.
2. State the critical business issues confronting and the opportunities.
Step 2: Target Establish baseline and set targets. SMART Goals are established. Step 3: Understand and
confirm losses
Stratify and understand losses. Build multi level Pareto of losses. Step 4: Prioritise the problem
to focus
Chose problems that can give a significant return.
Chose problems that produce the biggest headaches in daily production.
Step 5: Timeline Every problem should have its own timeline Every activity should be included.
Should be updated consistently.
Should be displayed for everyone to see.
Step 6: Evaluation and analysis Understand problem and have full grasp of facts and phenomena.
Always check for logical correctness of each Why. Continue Why until it leads to solution.
Verify all factors by thinking in reverse.
Step 7: Corrective actions Everyone in the workplace should understand and accept the improvement
Start by implementing the improvement on one equipment/unit.
Step 8: Confirm effects Evaluate results with time as improvement project proceeds.
Step 9: Institutionalisation Draw up control standards to sustain results. Formulate work standards and manuals.
Table 2. Complete activities and timeline for NSOP reduction due to floating die
Activity J AN F EB M AR AP R M AY J UN J UL AUG S EP OC T NOV DEC
Te am Formation
A.Fan in Standard & Fuguai Re storation
B. Planning & Data C olle ction
- T racking Defect
- Process mapping
- Device to Device Comparison
- Why - Why Analysis for NSOP
C . Expe rime nt & Re sult Analysis
- Why- Why Analysis for Die Floating
- Die Bending
-- Finite Element Analysis
- Flag T ilt
-- General Vacuum mechanism -- Good Vacuum condition -- T otal vacuum Block -- Partial Vacuum Block
- Order Prototype
- Confirm Prototype Result with t-T est
D. Imple me ntation & Future Plan
- AM Standard
T echnician
-- Add Vacuum T ube change on Quaterly basis -- Add Vacuum Valve Check on Quaterly basis
Operator
-- Add Insert Clean on Daily Basis
-Fan O ut Plan
--Replace All Ekb Insert For Esec 3088 & Esec 3008 ( 29 units)
--Fan Out Insert Design to Other Devices on Esec 3088 & 3008
--Fan out to Other Model Wirebond Kns 8020
Frame : 680,675,676
PLAN ACT UAL
A timeline shown in Table 2 was prepared to keep track of the team progress. The timeline consists of team formation, fan in of autonomous maintenance standards and fuguai/machine restoration, planning and data collection, experiments and result analysis, and finally implementation and future plan. New activities were added in the timeline as the need arises based on evaluations, analyses and new findings. Planned time frame to complete a task and the actual time taken to complete it is also shown in the timeline. This helped to have complete picture of the team progress.
RESULTS
Initial conditions
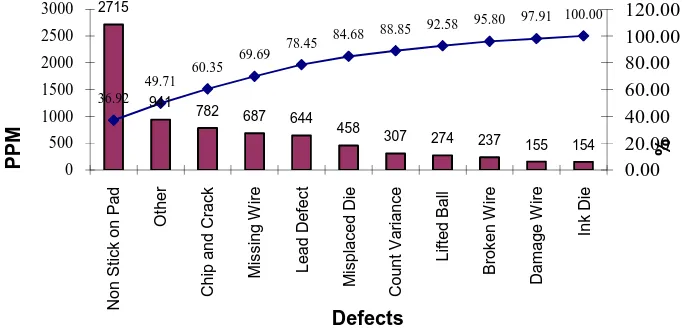
Figure 2 illustrates the Pareto of defects recorded over a 5-month period from August to December 2000. It is an accumulation of defects during that period. From this data, it was determined that NSOP defect exerted 2715 defects per million which contributed to 36.92% of the total quality problem. Consequently this category of defect was selected for further investigation.
Figure 2. Pareto of defects at front-end assembly from August to December 2000
The next part of the study was to analyse the type of NSOP. From the Pareto analysis (Figure 3) it was determined that floating die had produced 1300 ppm, which contributed
48% to total NSOP.
Figure 3. Pareto on causes of NSOP at front end assembly from August to December 2000
2715
941
782 687 644
458
307 274 237 155 154
36.92 49.71
60.35
69.69 78.45
84.68 88.85 92.58
95.80 97.91 100.00
0.00 20.00 40.00 60.00 80.00 100.00 120.00 0 500 1000 1500 2000 2500 3000 N o n S ti c k o n P a d O th e r C h ip a n d C ra c k M is s in g W ir e L e a d D e fe c t M is p la c e d D ie C o u n t V a ri a n c e L if te d B a ll B ro k e n W ir e D a m a g e W ir e In k D ie % P P M Defects 1300
248 247 250 220 200 150 100
48 57
66 75 83
91 96 100
0 20 40 60 80 100 120 0 200 400 600 800 1000 1200 1400 F loa ti ng D ie F or ei g n M at te r E dg e D ie B al l In it ia l C on ta ct F ai l G la ss if ic at io n B on de d B al l S m al l S aw D u st on P ad T ra n du ce r n ot S ta bl e % P P M
Wire bond model that produces the highest NSOP was determined. Figure 4 shows that wire bonder from Esec 3088 model contributes 55% of the NSOP rejects.
Figure 4. Wire bond model versus percentage of NSOP rejects from August to December 2000
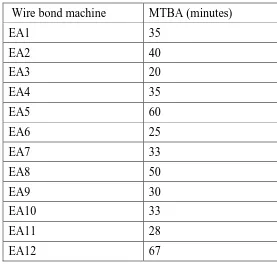
A wire bond machine selection from the model was carried out based on the Mean Time Between Assist (MTBA) data. MTBA is an indicator of how frequent a machine stops during production. The lower the MTBA, the more frequent it stops and that machine needs more focus to reduce the stoppages.
MTBA = Total running hours
Number of stoppages
This model consists of 12 wire bonders namely EA1 to EA12. Table 3 shows that wire bond machine EA3 had the lowest MTBA for the month of December 2000, which is only 20 minutes. The wire bonder EA3 had been chosen by the team to be focussed on improving NSOP due to floating die and the solution had been implemented (fan out) to all the other machines.
Table 3. MTBA for Esec 3088 model for the month of December 2000
Wire bond machine MTBA (minutes)
EA1 35
EA2 40
EA3 20
EA4 35
EA5 60
EA6 25
EA7 33
EA8 50
EA9 30
EA10 33
EA11 28
EA12 67
1493
815
407
55
85
100
0 20 40 60 80 100 120
0 200 400 600 800 1000 1200 1400 1600
Esec 3088 Esec 3008 Kns 8020
%
P
P
M
PROBLEMS IDENTIFIED
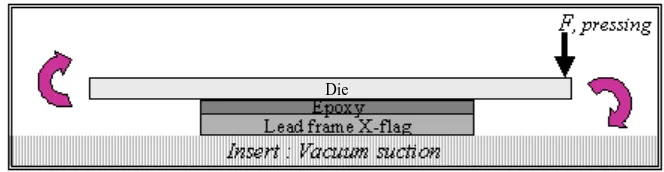
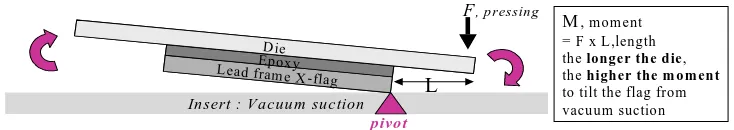
Figure 5 shows how floating die causes pad foundation to be unstable resulting in bonded ball to be over squashed and unable to stick on pad. During bonding a force F, acted on the die. This causes moment effect that tilts the die and makes the pad unstable thus causing NSOP.
Figure 5. Die floating
SOLUTIONS
The following evaluations and analyses were carried out to solve NSOP due to floating die. There were three types of process mapping performed namely device mapping, machine model mapping and device-to-device comparison.
Device mapping
Three devices were running in Esec 3088 model namely Epic, Ekb short die and Ekb long die. A comparison was made to check for similarities and differences between the devices, which were running in this model. Table 4 shows NSOP contributed according to the type of device. It can be seen that Ekb long die is the biggest NSOP contributor.
Table 4. NSOP contributor according to the type of device
Device Epic Ekb Short Die Ekb Long Die Total
PPM of NSOP 224 224 1045 1493
% of NSOP 15% 15% 70% 100 %
The following factors were common in all the devices: Same bonding parameters
Same capillary
Same wafer fabricator
Same lead frame (Ekb long and short die) Same insert (Ekb long and short die)
Machine model mapping (Ekb long die only)
Machine model mapping was carried out in Ekb long die to see whether NSOP rejects were found in all wire bond models running in this device. Table 5 shows that all wire bond machine models that was running this device gives high NSOP.
Table 5. Machine modules versus NSOP contributor
Machine Model Esec 3088 Esec 3008 Kns 8020
NSOP Yes Yes Yes
At this point it was concluded that there is something unique to this device that can result in high NSOP on all machine models.
Device-to-device comparison
A device-to-device comparison was performed to check for any clues of the cause of rejects. The questions were:
1. Why only Ekb long die
2. Why only at die left and right sides the NSOP defects are higher
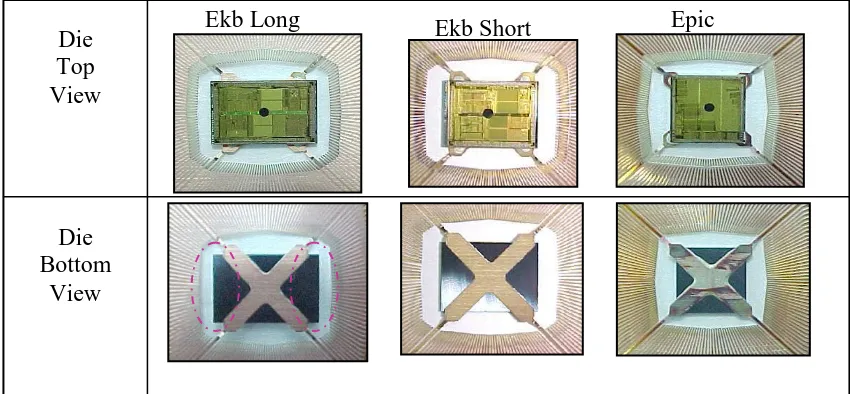
Figure 6 shows the top and bottom view of the devices. It can be seen that for Ekb long die, there is no support on the left and right sides of the die thus giving the floating effect.
Figure 6. Top and bottom views of the devices
Brainstorming (Wright, 1998) session carried out among the engineers and technicians yielded the Why-Why Analysis for die floating as shown in Figure 7. As can be seen from this figure, in Why 1 there could be two reasons for die floating namely die bending and flag tilt during bonding.
Ekb Long Ekb Short Epic
Die Top View
Die Bottom
Displacement vs Length
2.0E-05 2.5E-05 3.0E-05 3.5E-05 4.0E-05 4.5E-05 5.0E-05 5.5E-05 6.0E-05 6.5E-05 7.0E-05
0 1 2 3 4 5 6 7 8 9 10
Length (mm)
D
is
p
la
ce
m
en
t(
m
m
)
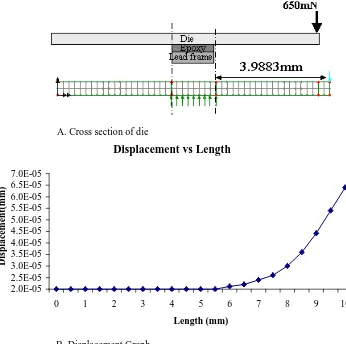
Finite element analysis to confirm whether the die could bend during bonding
Finite element analysis (FEA) was carried out using LUSAS Modeller version 13.1 to confirm whether the die could bend during bonding and the results were shown here. During bonding, a force of 650 mN is applied in z-axis on each pad to stick the ball. The following assumptions were made:
The effect of Ultra Sonic Generator (USG) on deflection is negligible since it is only acting on Y-axis.
Lead frame and epoxy that are supporting the die made in one block. Lead frame is firmly placed on the insert during bonding
The dimension of die was 9.5326 x 6.024 x 0.34 mm. From Figure 8, it can be seen that the maximum deflection of die is only 0.064 m, which is only 0.019% of the die thickness. Since the bending is very small, it was concluded that it is insignificant to cause NSOP.
B. Displacement Graph A. Cross section of die
Then, the second level of Why was carried out on flag tilt during bonding and the following weaknesses were highlighted:
No vacuum due to fully blocked vacuum tube. Weak vacuum due to partially blocked vacuum tube.
Insufficient vacuum due to high moment induced by the force during bonding.
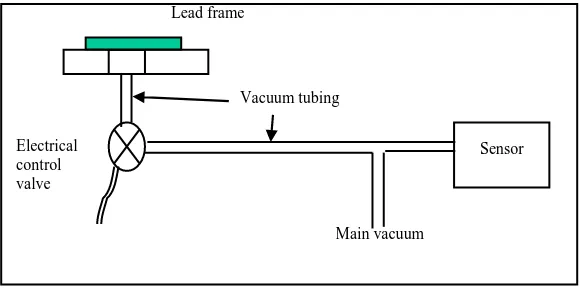
The third level Why on no vacuum and weak vacuum due to contamination on insert hole and foreign matter in vacuum hose is explained here. Figure 9A shows the general mechanism of the vacuum in Esec wire bonder. There is an electrical control valve, which turns on and off the vacuum on the insert (heater plate) during bonding. The vacuum sensor is connected to the insert by vacuum tubing. When the vacuum level is low an alert is displayed on the wire bond monitor. The vacuum is generated by the plant-centralised vacuum pump, which is distributed through piping systems throughout the plant. Every wire bonder has its own regulator to regulate the incoming vacuum level in the machine this avoids fluctuation in incoming vacuum. Figure 9B shows a firmly placed frame with no contamination on the heater plate and in the tubing.
Figure 9. A. Esec 3088 vacuum general mechanism, B. Good vacuum condition
A. General Mechanism
B. Good Vacuum Condition
Main vacuum
Sensor Heater plate
Electrica l control valve
Vacuum tubing
Vacuum tubing
Sensor Electrical
control valve
Lead frame
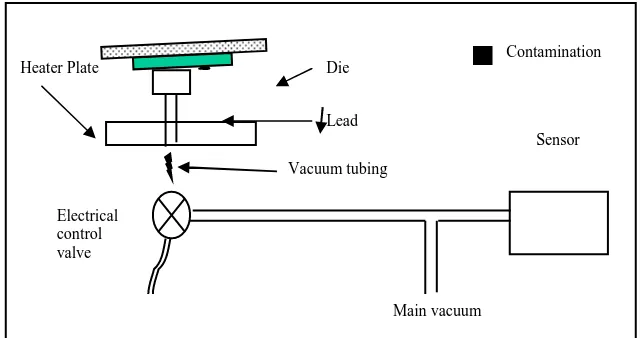
The weaknesses of wire bond insert vacuum system are:
The sensor is unable to differentiate the vacuum reading if there was a total blockage in the vacuum tubing by foreign matter, since the sensor will still detect the same negative vacuum pressure as shown in Figure 10.
Figure 10. Total vacuum blocked
If there is partial vacuum (see Figure 11) due to frame misalign, flag tilted or vacuum tubing partially blocked which causes weak suction on die firmness, as long as it is within the tolerance of -38+/- 5 mbar, the machine does not detect. In this condition lesser vacuum is holding the frame on the insert.
Figure 11. Partial vacuum blocked
Sensor
Main vacuum
Contamination Die
Electrical control valve
Vacuum tubing Lead Heater Plate
Sensor Electrical
control valve
Vacuum tubing
Main vacuum Contamination
Heater plate
Actions were taken to resolve the weakness. A study was carried out on the life of the vacuum tubing and vacuum tubing cleaning was established once every 3 months by the technicians. Operators carried out insert cleaning on a daily basis.
The third level Why, i.e. on excessive moment due to die and frame configurations is explained here. It is clearly seen from Figure 12 that both dies do not have sufficient support due to the X-flag frame. This is more obvious on Ekb long die especially on the left and right side of the die.
Figure 12. Die bottom view
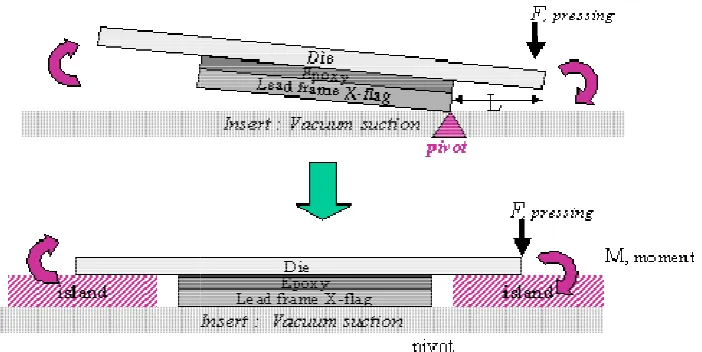
The lead frame itself creates a pivoting effect (Figure 13). Furthermore X-flag frame is more difficult to be held by the vacuum properly due to insufficient area for vacuum contact and also it is more sensitive to set up alignment to the vacuum hole on the insert.
Figure 13. Die tilt due to pivoting effect
To reduce or eliminate die deflection due to shifted die by die bond process or vacuum system not holding the X-flag strong enough, a permanent base is provided as support at the two non-supported sides in order to prevent the die deflection (Figure 14 and Figure 15).
Ekb long die Ekb short die
M, m om ent = F x L ,length the longer th e die, the higher the m om ent to tilt the flag from vacuum suction
Insert : Vacuum suction
L ead frame X-flagEpoxy D ie L ead frame X-flagEpoxy
D ie
F, pressing
L
Figure 14. Islands to provid
Figure 15. Modified insert
After insert modification w insert. Figure 16 shows th control the epoxy thickne deflection as much as poss the lead frame X-flag hang the frame.
Figure 16. Insert dimension
Before Modification
vide permanent support
ert
with the flag down set, it improved the die f s the dimensions of the new insert design. It ness and such new clamp insert design is to ossible. If the island is too high, the die sits on anging on the air causes the vacuum to be inef
ions
After Modification
A prototype was made to effective in reducing die ti side of Ekb long die becau deflection due to no suppo targeted ball size of 56+/-clamp and new 56+/-clamp inse the t-Test it can be seen th variation on the reading w the average ball diameter w ball variation is minimal. is significant difference be ball size on the affected tw New insert helped to bring insert brings the process supported sides.
Figure 17. t-Test on the bal
to confirm the action taken and to ensure the i tilt. The response taken was the ball size on th cause the floating effect is very prominent on th
pport on the old clamp causes the ball to be b -3 µm. Ball size was measured after bonding nsert design. A t-Test (Figure 17) result was p that average ball diameter for old clamp was was high due to the deflection of the die. On er was 56 µm, which was within the targeted ba
l. t-Test result with Prob > t less than 0.000 between the new and old clamp insert design two ends.
ing the ball size back to targeted range of 56 ± ss back to control by reducing the deflection
ball size
e insert design is the left and right n those sides. Die e bigger than the ing using the old s plotted. From as 68 µm and the n the new clamp ball size and the 0001 shows there ign effect on the
non-Once the new design effect was confirmed the design was fanned out to all the other wire bonders in all the three models and the improvement data was collected. A drastic improvement in the yield trend was seen once the new design was implemented. The yield trend in Table 6 had been monitored for 6 months and the improved trend persists.
The new design was successful in reducing NSOP for floating die by almost 50%. The goal of this research was achieved.
Table 6. NSOP yield trend (January 2001 to February 2002)
CONCLUSION
The research work provided some insight into how focus improvement was used to improve NSOP in ic packaging. It took a unique set of methodologies, which focus on the steps and directions to make the strides necessary. It provided the information and decision making tools necessary to determine where and how to make process improvements, to improve the quality and reduce the cost of final product.
The research work had also provided excellent insight into the power of TPM and focus improvement activity as a process improvement tool.
The improvements introduced by focus improvement activities had brought down NSOP from 1300 ppm to 650 ppm within one year. The actual benefit obtained by working on all the NSOP problems by carrying out focus improvement activities, which included the process recipe improvement, fan in of AM standards and fuguai restorations reduced NSOP from 2716 ppm to 650 ppm. The total benefit was 2066 ppm. This was a big achievement in improving the yield of the department.
Focus improvement team carried out a new Pareto analysis to focus on the next highest yield lost to focus and improve. It is a systematic approach in problem solving, which is well documented. Full commitment by higher management towards implementing TPM also helped in the success of focus improvement activities and thus had improved yield.
Description Aug-dec 2000 Jan 01 Feb 01 Mar 01 Apr 01 May 01 Jun 01 July 01 Aug 01 Sept 01 Oct 01 Nov 01 Dec 01 Jan 02 Feb 02
Non- stick on
REFERENCES
Amar, K. and Zain, Z.M. (2002). Barriers to implementing TQM in Indonesian manufacturing organisations. Proceedings of 2nd World Engineering Congress, Manufacturing Engineering, Automation and Robotics, pp. 136-139.
Bamber, C., Sharp, J. M. and Hides, M. T. (1999). Factors affecting successful implementation of total productive maintenance A UK manufacturing case study perspective. J. Quality in Maintenance Eng, 5(3): pp.162-181.
Dal, B., Tugwell, P. and Greatbanks, R. (2000). Overall equipment effectiveness as a measure of operational improvement – A practical analysis. Int. J. Operations &
Production Management, 20(12): pp. 1488-1502.
Jonsson, H.T. and Lesshammar, M. (1999). Evaluation and improvement of manufacturing performance measuring systems – role of OEE. Int. J. Operations &
Production Management, 19 (1): pp. 55-78.
Nakajima, S. (1988). Introduction to Total Productive Maintenance. Cambridge, Mass: Productivity Press.
Sivakumar, D. (2004). Application of Focus Improvement to Reduce Non-Stick on Pad Problem in IC Packaging, MS. Thesis, Universiti Putra Malaysia, Malaysia.
Suzuki, T. (1994). TPM in Process Industries. Portland, Oregon: Productivity Press.