ABSTRACT
ANALYSIS THE INFLUENCE OF SERVICE QUALITY TOWARDS PASSENGER SATISFACTION
(CASE STUDY IN PT.KAI ECONOMY CLASS AC TANJUNGKARANG-KERTAPATI)
By
MARLIA FITRIANA
Service quality is any activity carried out by the company in order to meet consumer expectations. Services in this case is defined as services delivered by the owners of services such as convenience, speed, relationships, the ability and friendliness addressed through the attitude of providing services to customer satisfaction. PT KAI is a transportation service that is committed to always improve the quality service.
The problem in this is research is whether the dimensions of tangible, empathy, responsiveness, reliability and assurance has influence on passenger satisfaction in PT KAI economy class AC. The purpose of this study was to determine the influence dimensions of service quality on passenger satisfaction in PT KAI economy class AC.
The object in this study is passengers of PT KAI economy class AC. The study design used is descriptive verification and this research is to find out if there is a positive effect using multiple linear regression analysis. To view the contribution of each independent variable using T test and F test
The contribution of variable service quality (X) plays a role in influencing variable Y (passenger satisfaction) at 53.8% and the rest influenced by other variables. At T test results found that the variable service quality dimensions (X) that is tangible, empathy, responsiveness, reliability and guarantee positive effect on passenger satisfaction variable (Y).
ANALYSIS THE INFLUENCE OF SERVICE QUALITY TOWARDS PASSENGERS SATISFACTION
(CASE STUDY IN PT KAI ECONOMY CLASS TANJUNGKARANG-KERTAPATI)
(Skripsi)
Researcher:
Name : Marlia Fitriana
Student ID : 1211011091
Major : Management
Advisor : Dr. Ribhan, S.E., M.Si.
Co-advisor : Mudji Rachmat Ramelan, S.E., M.B.A.
MANAGEMENT DEPARTMENT FACULTY OF ECONOMICS AND BUSINESS
ABSTRACT
ANALYSIS THE INFLUENCE OF SERVICE QUALITY TOWARDS PASSENGER SATISFACTION
(CASE STUDY IN PT.KAI ECONOMY CLASS AC TANJUNGKARANG-KERTAPATI)
By
MARLIA FITRIANA
Service quality is any activity carried out by the company in order to meet consumer expectations. Services in this case is defined as services delivered by the owners of services such as convenience, speed, relationships, the ability and friendliness addressed through the attitude of providing services to customer satisfaction. PT KAI is a transportation service that is committed to always improve the quality service.
The problem in this is research is whether the dimensions of tangible, empathy, responsiveness, reliability and assurance has influence on passenger satisfaction in PT KAI economy class AC. The purpose of this study was to determine the influence dimensions of service quality on passenger satisfaction in PT KAI economy class AC.
The object in this study is passengers of PT KAI economy class AC. The study design used is descriptive verification and this research is to find out if there is a positive effect using multiple linear regression analysis. To view the contribution of each independent variable using T test and F test
The contribution of variable service quality (X) plays a role in influencing variable Y (passenger satisfaction) at 53.8% and the rest influenced by other variables. At T test results found that the variable service quality dimensions (X) that is tangible, empathy, responsiveness, reliability and guarantee positive effect on passenger satisfaction variable (Y).
ANALYSIS THE INFLUENCE OF SERVICE QUALITY TOWARDS PASSENGERS SATISFACTION
(CASE STUDY IN PT KAI ECONOMY CLASS TANJUNGKARANG-KERTAPATI)
Researcher MARLIA FITRIANA
Skripsi
As One of Requirements to Achieve BACHELOR OF ECONOMICS
In
Management Department
Faculty of Economics and Business University of Lampung
FACULTY OF ECONOMICS AND BUSINESS UNIVESITY OF LAMPUNG
BIOGRAPHY
Researcher was born on March 14th, 1994 in Palembang, Indonesia. The third child of four children from Maliki and Mardaleni.
Researcher started formal education at TK Mahira Palembang. In 2000, researcher
continued study to elementary school at SD N 187 Palembang. In the middle of
2006, researcher continued to junior high school at SMP Bina Warga Palembang.
In 2009, researcher get accepted in SMA N 18 Palembang.
In 2012, researcher get accepted in Faculty of Economics and Business, The
MOTO
"For indeed, with hardship [will be] ease. Indeed, with hardship [will be] ease." (Surah Al InsyirahAyat 5-6)
"It always seems impossible until its done.”
(Nelson Mandela)
“Push yourself because no one is going to do it for you”
DEDICATION
Alhamdulillah all praise to Allah SWT for the strength and his blessing in completing
this undergraduate thesis. I dedicate this undergraduate thesis to :
Ayah Maliki dan Ibu Mardaleni
Mom and Dad thank you for the endless love and everything you have done to
help me get where I am today, to the sacrifices you have made, all the patience,
all the support you have given me and all the guidance you gave when I needed it .
Thank you for sticking with me through thick and thin, You are both so
inspirational. I know I can do anything I set my mind to because you will
always have my back.
My sisters and my brother
To Listya Angraini, Rahmad Kurniawan and Martina Puspita Rani thank you so
much for all the love, encouragement, and support you've provided throughout
my life. You are the reason my childhood has been special, teenage memorable,
grown-up years unforgettable and my whole life remarkable. Thanks for always
ACKNOWLEDGEMENT
Alhamdulillahirobbilalamin,Praise to Allah SWT who has been giving out mercy,
guidance, and His good pleasure, so that I can finish the undergraduate thesis entitled
“Analysis The Influence of Service Quality Towards Passengers Satisfaction (Case
Study In PT KAI Economy Class Tanjungkarang-Kertapati)”.This undergraduate
thesis is one of the requirements to complete the study on the management bachelor
program at the Faculty of Economics and Business, University of Lampung. In this
chance, I would like deeply thanks to:
1. Mr. Prof. Dr. H. Satria Bangsawan, S.E., M.Si. as the Dean of Faculty of
Economics and Business, University of Lampung.
2. Mrs. Dr. Rr. Erlina, S.E., M.Si. as Head Program of Management Department
Faculty of Economics and Business University of Lampung.
3. Mrs. Yuningsih, S.E., M.M. as Secretary Program of Management
Department Faculty of Economics and Business University of Lampung.
4. Mr. Dr. Ribhan, S.E., M.Si. as my Advisor Lecture who always giving advice,
guide me patiently and also supprort me during the process of my
undergraduate thesis, so that i can finished it.
5. Mr. Mudji Rachmat Ramelan, S.E., M.B.A. as My Co-Advisor who already
me patiently, and also supprort me during the process of my undergraduate
thesis, so that i can finished it.
6. Mr. Driya Wiryawan, S.E., M.M. as my Examiner who always give critics
and suggestion for this research to make this undergraduate thesis better.
7. Mrs. Lies Andriani, S.E.,M.Si. as my education advisor who always give an
advise for my study plan.
8. All the lectures in Faculty of Economics and Business University of Lampung
9. All the staff in Faculty of Economics and Business University of Lampung
10. My besties girl Fera, Kikak, Vanya, Dilak, My beautiful sister from another
mother Aisyah Labiba, and my buddy since elementary school Erennita putri.
11. My gorgeous roommate Wulan who always been there to me for all this time,
My palembangness buddy in here Muliyah who always give me support and
another pretty girl Yovie Citra for being such a an awesome friend.
12. My Bilingual Class batch 2012: Ayu, Siska, Ines, Winy, Laras, Reza, Fadil,
Kemas, Ike, Lele, Saput, Dona, Citra, Brenda, Kautsar, Dirga, Abe, Elisa dan
Lia Hermanto, thank you for our togetherness in more than 3 years and beings
such an amazing classmates.
13.My KKN’s team and housemates for 40 days Iin, Nugroho, Ribut, Wayan,
Nay and Yessy.
14. Marketing Management Class batch 2012.
I realize this undergraduate thesis is still far from perfect. If there is mistake I do
apologize and kindly accept all of critics and suggestion for this thesis. hopefully this
undergraduate thesis can be useful for me in particular and all readers in general.
Best Regards,
Bandarlampung, February 2016
CONTENT LIST
Page
ABSTRACT CONTENT LIST TABLE LIST GRAPHIC LIST ATTACHMENT LIST
I. INTRODUCTION ... 1
1.1 Background ... 1
1.2 Problem Statement ... 13
1.3 Purpose of Research ... 13
1.4 Benefit of Research ... 13
II. LITERATUR REVIEW, FRAMEWORK, AND HYPOTHESIS ... 15
2.1 Marketing ... 15
2.2 Services ... 18
2.2.1 Definition of Services ... 18
2.2.2 Flower of Services ... 21
2.2.3 Service Characteristics ... 23
2.3 Transportation ... 26
2.4.1 Definition of Service Quality ... 28
2.4.2 Dimensions of Service Quality ... 30
2.4.3 Service Quality Measurement Tool ... 35
2.5 Passenger Satisfaction... 39
2.5.1 Customer Satisfaction Factors ... 41
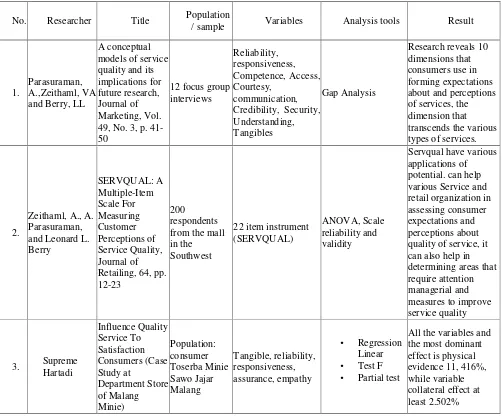
2.6 Previous Research ... 42
2.7 Framework ... 44
2.8 Hyphothesis... 45
III. RESEARCH METHODS ... 47
3.1 Research Design ... 47
3.2 Data Types ... 48
3.3 Data Collection Methods ... 38
3.4 Population and Sampling Research ... 50
3.4.1Population... 50
3.4.2Sampling... 50
3.5 Operational Variables ... 52
3.6 Analyzing Tools... 54
3.7 Analyzing Data Method ... 55
3.8 Hyphothesis Testing... 57
3.8.1 Hyphothesis Testing in Overall (F-Test) ... 57
3.6.4 Hyphothesis Testing in Partial (t-Test)... 58
IV. RESULT AND DISCUSSION ... 60
4.1 Company Profile ... 60
4.1.1 A General Description of the Company ... 60
4.1.3 Company Goals ... 62
4.2 Characteristics of Respondents ... 63
4.3 Validity Test... 71
4.4 Reliability Test... 73
4.5 Discussion ... 75
4.5.1 Qualitative Data Analysis ... 75
4.5.2 Quantitative Data Analysis ... 89
4.5.3 Hypothesis Testing and Discussion ... 92
V. CONCLUSION, SUGGESTION, AND LIMITATION OF RESEARCH... 87
5.1 Conclusion ... 100
5.2 Suggestion ... 101
5.3 Limitation of Research... 103
REFERENCE
TABLE LIST
Page
Table 1.1 Total passenger of railways in the province of Lampung ... 3
Table 2.1.Previous Research ... 42
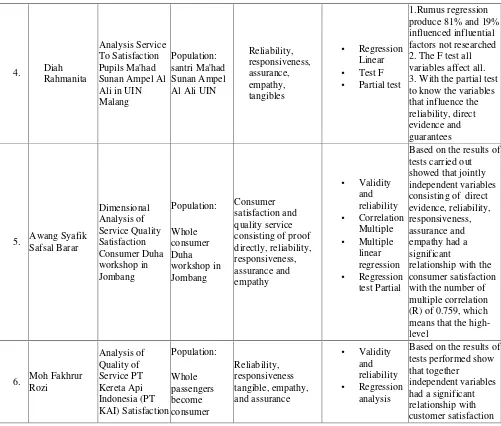
Table 3.1 Measurement Scale ... 52
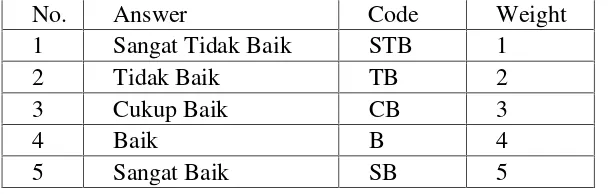
Table 3.2 Operational Variables ... 52
Table 4.1 Train Passengers departing from Tanjungkarang ... 62
Table 4.2 Respondents by Gender ... 63
Table 4.3 Respondents by Age ... 64
Table 4.4 Respondents by Job Status... 64
Table 4.5 Respondents by Income Level ... 65
Table 4.6 Respondents by Purpose of Destinations ... 66
Table 4.7 Respondents by Transportation Modes Before using Train... 67
Table 4.8 Respondents by Reason Using Railways ... 68
Table 4.9 Respondents by Mode Used To Go To Station... 69
Table 4.10 Respondents by Mode Used for Leaving Station... 70
Table 4.11 Respondents Based On Frequency of Using Train ... 71
Table 4.12 Validity of Test Results... 72
Table 4.13 CoefficientrCronbach’s Alpha... 73
Table 4.14 Reliability Test Result... 73
Table 4.16 Percentage of respondents' statements about variable empathy ... 78
Table 4.17 Percentage of respondents' statements about the responsiveness ... 80
Table 4.18 Percentage of respondents' statements about the reliability... 83
Table 4.19 Percentage of respondents' statements of assurance ... 85
Table 4.20 Percentage of respondents' statements about satisfaction ... 88
Table 4.21 Regression ... 90
Table 4.22 Determination R2... 92
Table 4.23 Coefficients variable XI (Tangible) ... 93
Table 4.24 Coefficients variable X2 (Empathy) ... 94
Table 4.25 Coefficients variable X3 (Responsiveness) ... 95
Table 4.26 Coefficients variable X4 (Reliability)... 96
Table 4.27 Coefficients variable X5 (Assurance) ... 97
GRAPHIC LIST
Page
The Service Marketing Triangle ... 18
Flower of Service ... 21
Gap Quality of Service... 38
ATTACHEMENT LIST
Attachement 1.Questionnaire English Version
Attachement 2 Questionnaire Indonesian Version
Attachement 3. Result Questionnaire of Tangible
Attachement 4. Result Questionnaire of Empathy Attachement 5. Result Questionnaire of Responsiveness
Attachement 6. Result Questionnaire of Reliability
Attachement 7. Result Questionnaire of Assurance
Attachement 8. Result Questionnaire of Satisfaction
Attachement 9. Characteristics of Respondents Attachement 10. Normality Test
Attachement 11. Validity Test
Attachement 12. Reliability Test
Attachement 13. Regression Analysis
I. INTRODUCTION
1.1 Background
Development of business in the service sector increased at this time. This
development can be observed in everyday activities, where most of the activity
can not be separated from the use or the role of the various service sectors. One of
the services sector has a vital role in supporting a variety of daily activities are the
transportation services sector.
Transportation service is a part that can not be separated and are needed in
everyday life. Transport plays an important role in supporting national
development and an important tool in expediting the economy and affect almost
all aspects of life. The increasing demand for transportation along with increasing
population growth in Indonesia and the needs of society, especially the urban
public transportation services are used for the mobility of passengers and goods to
support economic activity.
Railway is one of public transport mode of land transportation. Railways
have a key position in society. They are a very old and important phenomenon in
the transport system. They also played an important role in the industrialization
and development of the modern world. Railways as mass public transport mode
have unique characteristics. It can carry passengers in the amount of mass at a
2
level, environmentally friendly, comfortable, adaptive to technology development,
and free from traffic jam. As a single organizing body rail freight services, PT
Kereta Api Indonesia is required to organize the transport of the attention to
comfort, security and safety of passengers.
PT Kereta Api Indonesia (Persero) is a state-owned enterprise (Enterprise)
which is engaged in providing ground transportation services in order to facilitate
the outflow of people or goods en to support national development. The train has
an important role in public transport services. As one of means public
transportation, train quite interested by the community in Indonesia. Besides that
the price of train tickets can also be reached by the public. But the services
provided by PT.KAI can be said Indonesia has not fully satisfactory, so often
there is an increase and a decrease in the number of passengers.
PT KAI prove their commitment by improving the comfort and quality of
service for passengerswhich can be seen from the policies that have been issued,
such as a ticket for a seat, prohibiting hawkers into the train, creating a system of
ticket purchase via online, and much more other policies. All of these policies aim
to provide the best services,in accordance with the vision of PT KAI who wants to
be the best rail service providers that focus on customer service and meet the
expectations of stakeholders.
PT. KAI is one of the companies in providing ground transportation services
which should give priority to the quality of services, supervision on the train, and
adequate facilities so that consumers satisfied with the services rendered. In
3
influence the choice of consumers to choose different types of services are
developed at this time.
Tanjung Karang station is the largest railway station in Lampung Province.
This station is one station in a railway line linking the city of Bandar Lampung
city to Palembang, South Sumatra. Passenger train currently in operation from the
railway station is Express Sriwijaya (executives and business) destination
Kertapati Palembang and Express Rajabasa (economic) destination Kertapati
Station. (source: PT KAI Sub Regional Division III.2 tanjungkarang)
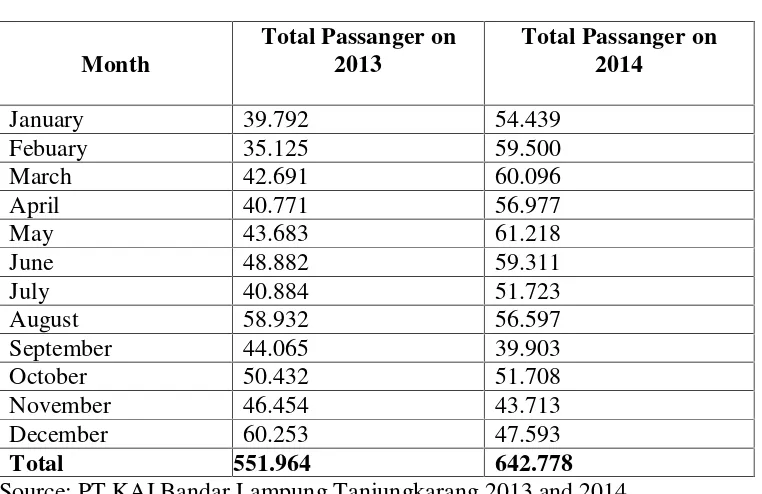
Tabel 1.1 Total passenger of railways in the province of Lampung in 2013 and
2014
Source: PT KAI Bandar Lampung Tanjungkarang 2013 and 2014
In the above table can be seen that the number of passengers fluctuates.
Rise and fall of the number of passengers can be caused by several factors such as
national holidays and weekend, in addition to good quality services also determine
4
passenger numbers in 2013 and 2014, including decreases therefore be examined
whether the quality of service has led to the decline in the number of passengers
that year.
The quality is the basic factor that can influence the choice of consumers
for different types of services are developed at this time and has been one factor in
the success and growth of an organization. The business assessment and quality
improvement becomes the most important factor in the success of industrial
services among consumers. Good quality service is when the company is able to
provide satisfactory service in order to fulfill the demands and expectations of
consumers (Sugiarto, 2000).
Service is the key to success in a variety of businesses or activities that are
services. Its role will be bigger and prescriptive, when there is competition in
activities of services in the market to seize business or subscriptions so that with
the competition as it would lead to a positive impact on the company. They
compete in the implementation of services through various way, techniques and
methods which can attract more people to use the services produced by the
company and each company usually has a minimum service standards.
Minimum service standards is a public policy that concerning in the
quality and quantity of public services provided by the government as an indicator
of public welfare. Minimum service standards have strategic value both for the
government (regulator), railroad (operator) and for society (consumers).
Minimum Service Standards in PT KAI includes:
Facilities that must be met in accordance with the Ministerial Decree No. 9 of
5
1. Fulfillment Facility in Train Journey
a. Door: At least 95% in accordance with the technical standards and
operating standards.
b. Window: A minimum of 95% in accordance with the technical standards
and operating standards.
c. Seating with fixed constructions that have backrest: maximum number of
passengers over 25% of the number of seats and has a seat number or
train number (Intercity train). The maximum passenger number 1 m² for 6
persons (Urban Railway).
d. Toilet: Functioning in accordance with the technical standards and
operating standards.
e. Lighting in train: At least 95% in accordance with the technical standards
and operating standards.
f. Fans: At least 95% function in accordance with the technical standards
and operating standards. Inside the cabin temperature 25-28 ° C. 5 (five)
pieces of fan and 4 (four) exhaust with a minimum of 30 cm diameter
propeller.
g. Luggage racks: A minimum of 95% in accordance with the technical
standards and operating standards.
h. Restoration: Must be available.
i. Information stations will be visited / passed in sequence: The information
in visual form, should be placed in a strategic, easily seen and read
6
j. Special facilities and services for persons with disabilities, pregnant
women, children, the sick and the elderly: A minimum of 5% of the booth
formation.
k. Health facility: 1 (one) set is placed in each train.
l. Facility safety and security: By default operations. Minimum is 1 officer
keeping two trains.
m. The name and the serial number of the train: two (2) pieces in every
carriage on the outside in every part of the left and right side of the train.
1 (one) mounted on each side of the door up / down passenger. 1 (one)
mounted on each end of the train inside.
n. Train travel disruption information: information can be delivered
immediately via officer or sound.
o. The accuracy of train schedule: Delay 20% of the total travel time
scheduled (Intercity train). Delays 15% of the total travel time scheduled
(Intercity train). The average delay of Passengers departing trains on is
experiencing an average delay of 4.23 minutes of tolerance of 4.23
minutes, while the passenger train coming lags 35.11 minutes from 31.07
minutes tolerance.
(Source: PT Kereta Api Indonesia)
Minimum service standards above can be categorized into the dimensions
of service quality such as doors, windows, seating, lighting, fan and shelves
included in the dimensions of tangible. Trip interruption information submitted
immediately by officers included into the dimension of empathy. Information
7
responsiveness. The accuracy of train schedule included into the dimension of
reliability . Special facilities, health facilities and safety facilities included in the
dimensions of assurance. In addition to minimum service standards there are also
standard operating procedure which regulates all activities performed by
employees of PT KAI starts from the standard appearance, ethics appearance,
ethical attitude, the service ethic, preparation of service, the process of
pre-service at station beginning, the process ahead of departure, the above process
KA, and the process after traveling in all of which the destination station includes
five dimensions of service quality.
According to Parasuraman et al., (1998) in Lupiyoadi and Hamdani (2006)
tangibles is the ability of a company to demonstrate its existence to external
parties. Appearance and capabilities of physical infrastructure companies and the
state of the surrounding environment is clear evidence of the services that the
company provides service providers. Tangible includes physical appearance,
equipment, employees, media communication and technology used in providing
services. Tangibles dimension can be assessed through:
1. Hygiene station
2. Hygiene in trains
3. Hygiene toilet on the train
4. Air circulation inside the train
5. The availability of tools to inform the travel route
6. The number of seats on the train
According to Parasuraman et al., (1998) in Lupiyoadi and Hamdani (2006)
8
customers by striving to understand his desire. A company is expected to have the
understanding and knowledge of the customer, understanding customer's specific
needs, and has the operating time that is convenient for the customer. Dimensions
empathy can be assessed through:
1. The ability of officials to provide information to customers in a language that
is easily understood
2. The willingness of employees to serve the needs of customers
3. Patience employees / officers in providing services
4. The prices offered affordable
5. The availability of 24-hour customer service.
According to Parasuraman et al., (1998) in Lupiyoadi and Hamdani (2006)
responsiveness is the ability to help and provide fast and accurate service to
customers with clear information delivery. Allowing the customers to wait
without any apparent reason causing a negative perception in the quality of
service. Dimensions responsiveness can be assessed through:
1. Speed officers in providing services for customers to completion
2. Accuracy in providing the information needed by the customer
3. Responding to emergency situations on the train or at the station
4. The speed in responding to customer complaints and problems
5. Officers always shown an attitude ready to serve / help
Reliability is the ability to provide the promised service with immediate,
accurate and reliable (Parasuraman et al., 1998 in Lupiyoadi and Hamdani, 2006).
9
the timeliness, the same service to all customers without error, sympathetic
attitude and high accuracy. Dimensions reliability can be assessed through:
1. Ease of reaching the station location
2. Availability of information relating to railway timetable
3. Accuracy In train schedule
4. The ability to provide the best service to the customer
5. Easy in obtaining clear information
According to Parasuraman et al., (1998) in Lupiyoadi and Hamdani (2006)
assurance is knowledge, politeness and the ability of the company's employees to
foster a sense of trust of the customers to the company. Dimensions assurance can
be assessed through:
1. Friendliness officers in serving customers
2. The ability of workers to do the job
3. Security while in train
4. Comfort when riding down train
5. The availability of insurance or guarantee of safety
PT Kereta Api Indonesia as a public service company provider of railway
transportation services also participated shocks affected the economy. Transport
business in competitive conditions very tight, maintaining customer satisfaction is
one way to maintain the existence of company. It encourages the study of quality
factors service capable of affecting passenger satisfaction. Factors the quality of
services that are considered to have an influence on passenger satisfaction factors
10
Customer satisfaction is the degree to which the perceived performance
product will suit a customer's expectations. when performance the product is
much lower than the expectations of customers, buyers do not satisfied.
Conversely if the performance in line with expectations or exceeded expectations,
buyers are satisfied or feel very happy. Along with the opinion above, Purnomo
(2003: 195) defines customer satisfaction as "The difference between expectations
and performance or expected results". It means that customer satisfaction is
created if the customer perceives the output or result of the work in line with
expectations, or even exceed customer expectations
Oliver in (Barnes, 2003: 64) expressed satisfaction is a response customers
for fulfillment, which means that the customer ratings on goods or services
provide a level of comfort associated with fulfillment of needs, including meeting
the needs that do not fit expectations or fulfillment that exceed customer
expectations.
Satisfaction is the level of one's feelings after comparing performance (or
results) are perceived compared to expectations. Level satisfaction is a function of
the difference between the perceived performance with hope.
Based on the results of pre-research conducted by interview to 10
passenger trains on the AC economy-class train about service conditions in
economy class they said its still giving complaints from passengers. Researchers
themselves are the active users of railways transport service since the last three
years, there were many changes for the better in the train but there are still some
things that complaints by passengers as the comfort of the passenger seat, the
11
is not in accordance with the schedule in which it has been said on service
standards drank an average delay of passengers departing trains on is experiencing
an average delay of 4.23 minutes of tolerance of 4.23 minutes, while the
passenger train coming lags 35.11 minutes from 31.07 minutes tolerance but in
fact his passenger trains come frequently experienced delays of 1-2 hours due to
the lack of double track and more put the coal train long series (Babaranjang). It is
also confirmed from the results obtained from interviews with service departments
PT Kereta Api Indonesia in station Tanjungkarang who explained that it is often
complained of by the railway passengers in economy class is the delay time the
train reached the destination, the PT KAI must perform the way that passengers
remain comfortable during the journey.
To determine whether the organization in carrying out any activity
services follow existing standards, whether the promises and responsibilities of
organizations service providers on the one hand and the rights of service users on
the other hand has been reached in the process of service, and whether the
standard of service provided already give satisfaction to the public, it would
require an instrument for measuring the quality of service which has an influence
on passenger satisfaction.
Measurement of quality is an important role to sustain an industry.
Measurements can be done on the quality of manufacturing and services
industries. A customer satisfaction rate also depends on the quality of service
expected from service providers. So customers are not disappointed, the quality of
services provided should be much better than expected quality. Service quality
12
According to Crosby, Letimen, and Wyckof in Waluyo (2007: 128) an
adjustment to the service quality details for where quality is seen as the degree of
excellence to be achieved. The best thing of course is to make everyone in the
organization oriented to quality. Thus it can be said that the public service is an
attempt to help or benefit to the public through the provision of goods or services
required by them.
This research will be conducted measurements of quality of service to
determine its impact on consumer satisfaction, since any activity or act of service
organization service providers need to be measured to detect, determine the
achievements of real had been achieved with the vision, mission, and purpose of
service by the organization. Often organizations are not optimally achieve the
expected performance is not due to the limitations or the ability of the
organization, but because the organization does not give enough attention on the
measurement of the performance of its services, so that the organization does not
understand what has been accomplished and what has not been achieved as a
result the organization running without targets obvious improvement.
Based on the description above background, researchers interested in conducting
research with the title “ANALYSIS THE INFLUENCE OF SERVICE QUALITY TOWARDS PASSENGER SATISFACTION (CASE STUDY IN
13
1.2 Problem Statement
Based on the description above the background there are still problem on
the train such as delays, declining passenger volume and results of pre-research
shows there is still her complaints passengers, the authors identified the problem
as follows:
1. Does the service quality effect on passenger satisfaction ?
2. Does the variable tangible, empathy, responsiveness, reliability,
assurance, simultaneously significant effect on passenger satisfaction?
1.3 Purpose of Research
The purposes of this research are:
1. To determine whether there is an influence the service quality towards
passenger satisfaction
2. To determine and measure whether a variable tangible, empathy,
responsiveness, reliability, assurance, simultaneously significant effect on
passenger satisfaction
1.4 Benefits of Research
There are several benefits that was obtained in the writing of this study
1. For the authors
This study as one of the scientific work in order to the requirements for
14
2. For organizations researched
To improve the quality of services that provided to train passengers
and also to increase the number of train passengers.
3. For the society
Especially to the people that use express train from
TanjungKarang-Kertapati, the results of this study are very useful as a discourse in
providing suggestion, advice and views to the company to improve the
quality/ service quality and achieve customer satisfaction.
4. For the others
The research is expected to be useful for the development of science in
Marketing Management especially customer satisfaction, service
quality and provide information for the next researcher who took the
II. LITERATUR REVIEW, FRAMEWORK AND HYPOTHESIS
2.1 Marketing
Marketing is an attempt to deliver an enterprise achieve the goal through
the fulfillment of human needs. Marketing encompasses the various activities
related to efforts to deliver products to consumers in between pricing,
determination of the product according to customer wishes, the activities of
distribution and promotional activities. To do marketing, the marketing manager
as a function of the company must recognize the subtleties of human needs by
providing satisfaction for consumers. Understanding this marketing encompasses
a very broad, not just a distribution and sales activities solely, but includes all
activities to meet the needs and desires of the community in the form of goods and
services, in order to achieve the desired objectives of the company.
Every human being is involved in the marketing world, wants to develop
his profession, and therefore it is necessary a clear picture of the meaning and
principles of marketing. To know more clearly about the sense of marketing, the
author tries to approach various marketing formula suggested by marketing
experts as quoted below.
Definition of marketing according to Kotler (2009: 6) Marketing is an
16
hand value to customers and manage customer relationships in ways that benefit
the organization and its stakeholders.
Definition of marketing according to the American Marketing Association
(Kotler, 2009: 12), namely: "Marketing is the process for planning and executing
the design, pricing, promotion, and distribution of ideas, goods, and services to
generate exchanges that can satisfy individual and organizational goals ".
This definition means that marketing is a human activity directed at
satisfying needs and wants through an exchange process. In this case the question
is the exchange of goods and services, as well as money and power. Marketing
activity involving two parties interact with each other, where one party wants
satisfaction, while the other party wants to make a profit. The parties in question
are producers and consumers.
Producers create goods or services while consumers are those who have
the need and desire to be fulfilled. So due to the interests of each party, there are
things called exchange or outflow of goods and services from producers to
consumers. Marketing is also an activity that is interconnected as a whole system.
Told as a whole, because the business includes marketing company that started by
identifying consumer needs, determine the appropriate price, determines the ways
of proper promotion and distribution pattern effective products. Furthermore,
marketing also has a certain target that is trying to provide for the satisfaction of
existing customers and potential buyers, so that marketing is not an activity that is
static in nature but rather a dynamic activity of consumer desires.
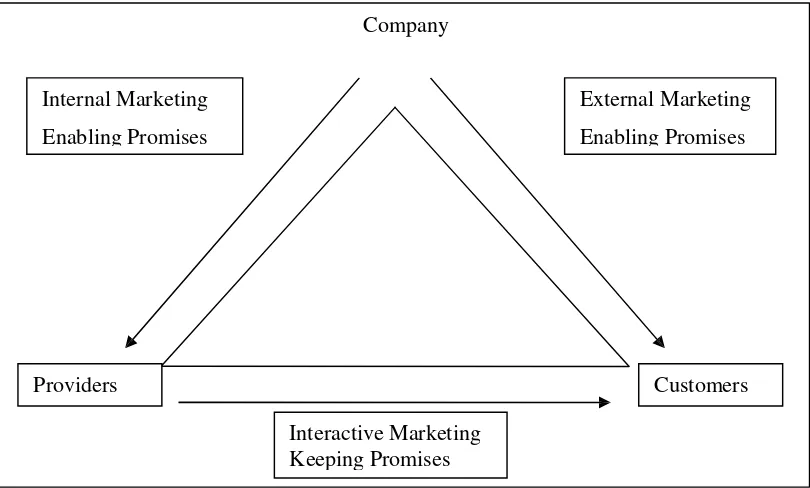
Zeithaml and Bitner (2003: 319) states that service marketing is about
17
framework known as the service triangle (Figure 2.1), which reinforces the
importance of people in the company keep their promise and success in building
customer relationship. Triangles depict three interconnected groups are working
together to develop, promote and deliver services. The third major player was
named on the triangle points: the company (PT KAI or department or
management), customers and providers (service providers). Providers can a
company employee, subcontractor, or outsiders who deliver services company.
Among the three points of this triangle, the three types of marketing must be
carried out so that the services can be delivered with success: external marketing ,
interactive marketing , and internal marketing.
On the right side of the triangle is the external marketing efforts that build
customer expectations and make a promise to the customer about what will be
delivered. Something or someone who communicates to the customer before
delivering services can be seen as part of the external marketing functions.
External marketing which is the beginning of the marketing service is the promise
made must be kept.
At the base of the triangle is the end of the marketing services namely real
time interactive marketing or marketing. Here promise fulfilled or violated by
employees, subcontractors or agents. This is a critical point. If the promise is not
kept customers will be dissatisfied and often leave the company. The left side of
the triangle indicates the critical role played by internal marketing. It is the
management activities to make the provider have the ability to deliver the
18
and technology. If the provider is not able and do not want to fulfill the promise
he made, the company will fail, and the service triangle will collapse.
Company
Figure 2.1The Service Marketing Triangle
Sumber: ZeithamlandBitner (2003:319)
2.2 Services
2.2.1 Definition Services
Lovelock and Wright (2005) revealed two meanings services, which are
(1) Services is an act or performance offered by one party to the other party.
Although the process may be associated with physical product, its performance is
basically not real and does not generate ownership of the factors of production, (2)
Services are economic activities that create and deliver benefits to customers in
time and place, as a result of actions that embody change are desirable in
themselves or on behalf of the service recipients. The benefits in question are the
Interactive Marketing Keeping Promises Internal Marketing
Enabling Promises
External Marketing
Enabling Promises
19
advantages or profits derived by customers from the performance of services or
the use of physical goods.
Kotler and Armstrong (2009) states the service is any activity or benefit
that is offered to other parties that are essentially intangible and do not generate
ownership of something. The production process may not be associated with a
physical product.
Lovelock, Patterson and Walker (2004) stated service or services is
something that is sold by the producers and purchased by consumers, but it is not
an item. Tjiptono (2008) tried to give a different definition between services and
service. He said the service is a reflection of a product that does not have a
physical form(intangible).Such products can be found in specific industries, such
as education, health, telecommunications, transportation, insurance, etc. While the
service is defined as anything done by certain parties (individuals or groups) to
another party (individual or group).
Grönroos (2001) combines the sense of services as the activity of an
intangible nature of the interaction between consumers and providers of services
that provide solutions for consumer problems.
Service is a product that can not be seen that we buy and use but never
had (Solomon, 2003: 7). Services cover all economic activities that result was not
the product or the physical construction in general consumption and production is
done at the same time, and the added value that it provides in the form (comfort,
entertainment, speed, and health) are in principle intangible on the buyer first
20
Meanwhile Stanton (2003: 220) provide a description of the services.
Services are activities that can be defined individually that is intrinsically
intangible which is the fulfillment of needs, and should not be tied to the sale of
other products or services. Production of services can be associated with a
physical product or not.
According Lupiyoadi (2006: 6), services are all activities that result is not
a product in the physical or construction, which is usually consumed at the same
time generated and added value such as comfort, entertainment, leisure or pleasure
or solution to the problem faced by consumers.
Whereas Yazid (2001: 3) formulating services as an economic activity that
has a number of elements (the value or benefit) intangible related thereto, which
involve a number of interactions with customers or with belongings, but do not
produce a transfer of ownership. Changes in conditions could arise and the
production of a service may have or may not have connection with the physical
product.
From the above definition, we can see that there are always aspects of the
interaction between consumers and providers in service, even though the parties
involved are not always aware of it. Services are not an item, service is a process
or activity, and the activity is not tangible. More and more manufacturers,
distributors, and retailers who provide value-added services, or excellent customer
21
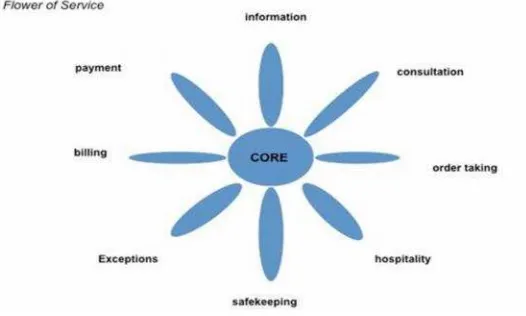
2.2.2 Flower of Services
Services are economic activities that create value and provide benefits to customers in time and place, as a result of bringing the desired changes in or on behalf of the service recipient. (Lovelock, 2005).
Figure 2.2.(The Flower of Services)
Source: Lovelock, 2005.
1. Providing information that is clear, complete, and accurate can be a force
in a service. For example, train and plane schedules, assistance to locate a
particular retail outlet, through to information about the services of
professional Integration.
2. Order taking, acceptance of orders includes the application, filling orders,
and a reservation or check-in. Reservations (including the making of an
appointment and check-in) represents the type of reception that require a
22
aircraft seats, tables at restaurants, hotel rooms, consulting to an expert or
to facilities such as a theater or sports arena ,
3. Billing, billing is very common for almost all services (except services
supplied free) .At billing inaccurate, illegible or incomplete at risk of
disappointing customers. The good billing is clear and informative and
detailed so obvious calculation amount.
4. Payment, the bill requires the customers to make payments for services
that customers use. The good service provider knows very well what the
customer has to make payments. For example by screening prior to entry
into the cinema or before boarding the train.
Additional services that strengthen:
5. Consultation, involving a dialogue to determine the needs of its customers,
then develop solutions accordingly.
6. Hospitality (hospitality), service providers are able to provide more
services. for example, provided the waiting room for customers,
newspapers, magazines, TV facilities granted to a repair shop or beauty
clinic.
7. Safekeeping, when customers visit the service, they often need help for
23
8. Exception, additional services provided outside the customs service
provider or service delivery process.
2.2.3 Service Characteristics
According to Kotler and Keller (2010: 39) service has four distinct
characteristics that greatly influence the design of marketing programs, namely:
1. Intangibility
Unlike physical products, services can not be seen, felt, touched, heard, or
smelled before the service is purchased and consumed. For customers, the
uncertainty in the purchase of services is relatively high because of the
limited search qualities, namely physical characteristics can be evaluated
buyer before the purchase is made. For services, the quality of what and how
that would be acceptable to consumers, generally unknown before the
relevant services are consumed. Therefore, the task of service providers is to
"manage the evidence" to "realize the intangible things". The service
company may be trying to demonstrate the quality of their services through
the physical evidence and the presentation of concrete.
2. Inseparability
While physical goods are made, included in the inventory. Distributed
through various intermediaries, and consumed later, services are generally
sold first, then produced and consumed at the same time and place. Because
clients are also often present when the service was created, the
client-provider interaction is a special feature in marketing services.
24
Services are variable because it is a non-standarized output, meaning that
many variations of shape, quality, and type depending on who, when and
where the services are produced. This is because the service involves the
human element in the process of production and consumption are likely to
not be predictable and tend to be inconsistent in terms of attitude and
behavior. Service buyers aware of this variability and often discuss with
others before choosing a provider. To convince customers, some companies
offer warranty services that can reduce consumers' perceptions of risk.
4. Perishability
Services are not durable and can not be saved. Empty airplane seats, hotel
rooms are not occupied, or the capacity of telephone lines that are not used
will pass or go away because it can not be saved. The appropriate services to
be provided to the right customer at the right place at the right time and the
right price to maximize profitability.
Tjiptono (2004: 22) said there are five main characteristics of the services
for the first buyers:
1. Intangibility
Different services with the goods. If the item is an object, device or object
then the service is an act, action, experience, process, performance
(performance), or businesses. Therefore, the services can not be seen, felt,
smell, heard, or touched before being bought and consumed. For customers,
the uncertainty in the purchase of services is relatively high because of the
limited search qualities, namely physical characteristics can be evaluated
25
that would be acceptable to consumers, generally unknown before the
relevant services are consumed.
2. Inseparability
Inseparable mean character that enables services produced and consumed
simultaneously. The interaction between service providers and customers is
a special feature in marketing services. Both parties to influence the results
(outcomes) of the service. In the service provider and customer
relationships, the effectiveness of individuals who deliver services is an
important element. This means that the service is normally not produced in a
centralized location and consumed at different locations.
3. Variability / heterogeneity
Services are variable because it is a non-standarized output, meaning that
many variations of shape, quality, and type depending on who, when and
where the services are produced. This is because the service involves the
human element in the process of production and consumption are likely to
not be predictable and tend to be inconsistent in terms of attitude and
behavior.
4. Perishability
Services are not durable and can not be saved. Empty airplane seats, hotel
rooms are not occupied, or the capacity of telephone lines that are not used
will pass or go away because it can not be saved.
5. Lack of Ownership
Lack of ownership is a basic distinction between services and goods. On
26
benefits of the product bought. They could consume, store or sell. On the
other hand, the purchase of services, the customer may only have access to
personnel on a service for a limited period.
Services have different characteristics when compared to products
(physical goods), according to (Sakina L, 2003) are three characteristics of
services including the following:
1. Unsortability: the service does not recognize the resulting supply of services.
2. Intangibility: the importance of this case the consumer does not feel
physically, but in the form of pleasure, satisfaction, and a sense of security.
3. Customization: services are often designed according to customer needs.
2.3 Transportation
Transportation has a definition that is very diverse, according to various
experts in the field of transportation. According Kamaludin (1987) transport
tranpotare derived from the Latin word, which means tran opposite or next and
portare means transporting or carrying. So transportation means transporting or
carrying (something) other fence or from one place to another.
According Tamin (2000), transportation is a system consisting of
infrastructure / facilities and service systems that allow for movement throughout
the territory so accommodated mobility of the population, made possible the
movement of goods, and the possibility of access to all areas. Meanwhile,
27
goods from one place to another by using a particular system for a specific
purpose.
Transport people or goods is usually not the final destination, therefore the
demand for transport services can be called as a derived demand arising from the
demand for commodities or other services. Thus the demand for new
transportation will be there if there are factors booster. Demand for transport
services do not stand alone, but is hidden behind other interests (Morlok, 1995).
Basically transport demand caused by the following things (Nasution,
2004):
1. The need for human beings to travel from other locations with the aim of
taking part in an activity, such as working, shopping, school, and others.
2. The need for transportation of goods to be used or consumed in other
locations.
According Hadihardaja et al (1997), well-developed transportation system
to date has been providing services of various kinds of mechanical movement into
almost every area that is the center of a variety of community activities. Some
developed transportation system in Indonesia, coincided with equitable national
development results, including:
1. Air
2. Sea
3. Railroad, comprised of highways, railways, ferry transport, miscellaneous
freight.
According to Nasution (2004) the nature of the services, operations and
28
1. Railroad railway
2. Motor / road / highway transportation)
3. Water / sea transportation)
4. Air transportation
According Tamin (2000) demand for transportation services is highly
qualitative and have different characteristics as a function of time, travel
destinations, frequency, type of cargo transported, and others. Transportation
services that do not fit the needs of the movement will cause the transportation
system useless. Economically, inefficient transportation system or transportation
problems was a big waste.
2.4 Service Quality
2.4.1 Definition of Service Quality
Quality is a dynamic condition affecting the products, services, people,
processes and environments that meet or exceed expectations (Tjiptono, 2007). So
that the definition of quality of service can be interpreted as an effort to fulfill the
needs and desires of consumers and delivery accuracy in balancing consumer
expectations (Tjiptono, 2007).
Service quality can be determined by comparing the perceptions of
consumers on the real service they receive / get the actual services they expect /
want to attribute the service of a company. If perceived service as expected, then
the quality of service perceived good and satisfactory, if the services received
29
and qualified. Conversely, if the service received is lower than expected, then the
perceived poor quality of service.
According Supranto (2006) Quality is a word that for service providers is
something that must be done well. The benefits of a product and services is
dependent on the uniqueness and quality are noticed by the service, whether as
expected and the customer's wishes.
Quality of service refers to judgments of customers about the core of this
service and the service provider itself or the whole service organization, the
majority of people are now beginning to show the demand for excellent service,
they no longer just need a quality product, but they prefer to enjoy the
convenience of service, (Nana Tasunar, 2006: 44). Therefore, in formulating a
strategy and program services, the organization must be oriented to the interests of
customers and very concerned about the quality dimension (Suratno and Purnama,
2004: 74).
According to Kotler (2002: 83) definition of service is any action or
activity that can be offered by one party to another, which is essentially intangible
and does not result in any ownership. Production may be linked or not linked to a
physical product. Service is the behavior of manufacturers in order to meet the
needs and desires of consumers to achieve customer satisfaction in itself. Kotler
also said that the behavior can occur during, before and after the transaction. In
general, a high level of service that will generate high satisfaction and repeat
purchase more often. Said quality contains many definitions and meanings,
30
encountered have some similarities, although only just a different way of delivery
is usually the difference is found on the following elements:
1. Quality includes business or superiority meet customer expectations.
2. Quality includes products, services, people, processes and the environment.
3. Quality is an ever-changing conditions.
From the definitions of the quality of service it can be concluded that the
quality of service is any activity carried out by the company in order to meet
consumer expectations. Services in this case is defined as services delivered by
the owner of the service in the form of convenience, speed, relationships,
capabilities and hospitality addressed through attitude and the nature of providing
services to customer satisfaction.
Service quality can be determined by comparing the perceptions of
consumers for services that obviously they received / obtained the actual service
they expect / want to attribute the service of a company. The relationship between
producers and consumers to reach far beyond the time of purchase to after-sales
service, the eternal beyond the period of ownership of the product. The Company
considers the consumer as king to be served well, since consumers would give an
advantage to the company in order to continue living.
2.4.2 Dimensions of Service Quality
31
courtesy, communication, credibility, security, understanding the customer's ability and physical evidence and in subsequent studies, 10 dimensions were reduced to five key dimensions of service quality. Fifth dimension is by Parasuraman, et al (1988) are as follows:
a. Tangibles
Tangibles are clear evidence of the care and attention given by service providers to consumers. The importance of these tangibles dimension will regenerate image service providers, especially for new consumers in evaluating the quality of services. Companies that do not pay attention to the physical facilities will foster confusion or even damage the image of the company.
b. Emphaty
Empathy is the ability of the company which carried out directly by the employees to give attention to individual consumers, as well as sensitivity to the needs of consumers. So the components of this dimension is a combination of access that is ease to use services offered by the company, communication is the ability to do to convey information to consumers or obtain input from consumers and understanding an effort to know and understand the needs and desires of consumers.
c. Responsiveness
32
consumers. So the component or element of this dimension consists of the alertness of employees in serving customers, speed of employees in serving customers and handling customer complaints.
d. Reliability
Reliability is the company's ability to implement services in accordance with what has been promised in a timely manner. The importance of this dimension is the consumer satisfaction will decrease if the services rendered are not in accordance with promised. So the component or element reliability dimension is a company's ability to deliver services appropriately and charging appropriately.
e. Assurance
Assurance is the knowledge and behavior of the employee to build trust and confidence in yourself consumers to services offered. This dimension is very important because it involves the perception of consumers against the risk of high uncertainty of the ability of service providers. The Company builds consumer trust and loyalty through employees involved directly deal with consumers. So the components of this dimension consists of employee competencies that include skills, knowledge of employees to perform services and credibility of the company covering matters related to the company such as consumer confidence, the company's reputation, achievements and others.
Sunarto (2003: 244) identifies seven basic dimensions of service ,namely:
a. Performance
Namely the absolute level of performance of the goods or services identified key attributes of the customer.
33
Example such as hospitality, respect, and concern shown by employees who provide services or goods.
c. Reliability
Namely the consistency of the performance of goods, services and shops. d. Durability
Namely vulnerable life of the product and general strength. e. Timeliness and comfort
That is how quickly the product is delivered or repaired, how quickly product information or services rendered.
f. Aesthetics
That is more on the physical appearance of the goods or shop and attractiveness of presentation services.
g. Brand awareness
positive or negative impact on the quality of the visible additional, who know the brand or store name on an evaluation of the customer.
Tjiptono and Chandra (2005: 113) developed eight dimensions of service quality, namely:
a. Performance is the principal operating characteristics of the core product.
Eg good shape and packaging will be more attractive customers.
b. Features, which is a secondary or complementary characteristics.
c. Reliability which is less likely to be damaged or fail to wear.
d. Conformance to specifications, namely the extent to which the
characteristics of the design and operations meet the standards that have
been set previously. As with any product or service that is received by the
34
e. Durability, with regard to how long the product can continue to be used.
Usually customers will be satisfied if the product purchased is never
broken.
f. Service abilities, including speed, competence, convenience, easy repair,
handling complaints satisfactorily.
g. Aesthetics, namely the product appeal to the five senses. Eg product
packaging with bright colors, the condition of the building and so forth.
h. Perceived quality, the image and reputation of the product as well as a
corporate responsibility to it. As an example of a brand that is known to
the public (brand image) will be more credible than the brands that are
new and unknown.
Grönroos in Kottler (Fandy Tjiptono, 2004) found a total service quality
consists of three dimensions or major components, namely:
a. Technical Quality, ie components that are associated with the quality of
output received by customers. Furthermore, by Parasuraman itemized into:
1. Search quality, that quality can be evaluated customer before buying, for
example, the price and goods.
2. Experience quality, ie quality that can only be evaluated customer after
purchase or consume services or products. For example punctuality,
speed of service, and neatness results.
3. Credence quality, which is something that is difficult to evaluate the
customer, despite consuming a service.
b. Functional quality, which is a component related to the quality of the
35
c. Corporate image, ie profit, reputation, public image, and the special appeal of a company.
From the opinions of experts on service quality dimensions, it can be concluded several dimensions credible that qualify that a service makes it possible to cultivate customer satisfaction. As for dimensions, namely:
a) Tangible
b) Empathy
c) Responsiveness
d) Reliability
e) Assurance
2.4.3 Service Quality Measurement Tool
According Atmoko (2012) there are four steps in measuring the quality of
services, namely:
a) The first step is to define the concept of quality to measure quality itself.
Quality perceived by consumers means that consumers are given the
concept of quality. Then the service providers to define the concept of
quality of service for consumers based on the factors of reliability, trust,
36
b) The second step is to make the user want to specify the services that these
factors become variable. Variables should be formulated as much as
possible based on the consumer's own statement.
c) The third step is to scale the size of the assessment for each variable, for
example, the measurement is based on the size scale of 1 to 5. This will
help the understanding of the views of service users against the ideal of
service.
d) The fourth step is to direct consumers to rate the service at this time. Results
of the assessment or measurement will provide information to formulate
objectives based on the quality of the variables and the fundamental quality
factor for consumers.
Several approaches have been proposed by experts in measuring the quality
of service. The analysis tool that can be used to measure the quality of service,
among others, customer windows, service performance, and service quality.These
approaches have different concepts with one another.
Servqual is a way instrument to measure the quality of services developed
by Parasuraman, Zeithaml and Berry in a series of their research on the services
sector, this model is also known as the Gap. This model is closely related to the
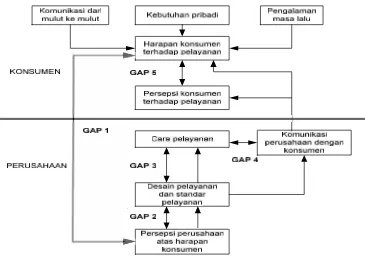
model of satisfaction. Gap analysis is the basic concept of SERVQUAL. These
five dimensions of service quality are used to analyze five gap between the
company's ability to provide services to service customers expect. The fifth gap is
37
Figure 2.3 Gap Quality of Service
a. The gap between consumer expectations with perception management (knowledge gap)
This gap occurs because there is a difference between the actual consumer expectations and management's understanding or perception of consumer expectations. This gap occurs because of several possibilities, including information obtained from market research and demand analysis is less accurate, interpretation inaccurate to information about consumer expectations, the absence of demand analysis, poor or no information flow upwards from the staff contact consumers to management and too many managerial levels that inhibit or modify the information delivered from the consumer contacts the employee to management.
38
This gap occurs because the specification of service quality is not consistent with management's expectations of quality perception. The causes include the lack of performance standards clear, error of planning or procedures inadequate planning, management of bad planning, lack of determination of clear objectives in the organization, lack of support and commitment of top management to the planning of the quality of service, resource shortages, and the situation of excessive demand.
c. The gap between service quality specifications and service delivery (delivery gap)
This gap means that the quality specifications are not met by the performance in production processes and service delivery. A number of causes, among others, the quality specifications is too complicated or too stiff, the employees do not agree to these specifications and are therefore not trying to comply, the specifications are not in line with the corporate culture that exists, operations management service is bad, inadequate activity of internal marketing, as well as technology and perceptions Consumer existing system does not facilitate performance in accordance with specifications.
d. Gap between service delivery and external communications (communication gap)