Karya Ilmiah
PALM OIL CONTRIBUTION TO
MALAYSIAN ECONOMY
Rulianda Purnomo Wibowo
132 311 457
UNIVERSITAS SUMATERA UTARA
FAKULTAS PERTANIAN
PROGRAM STUDI AGRIBISNIS
MEDAN
Karya Ilmiah
1. Judul Tulisan : Palm Oil Contributin to Malaysian Economy
2. Identitas Penulis :
a. Nama : Rulianda Purnomo Wibowo, SP
b. NIP : 132 311 457
c. Pangkat/Gol : Penata Muda/IIIA
d. Jabatan : Asisten Ahli
e. Jurusan/Fakultas : Agribisnis/Pertanian
3. Bidang Ilmu : Agribisnis
Medan, 3 Januari 2008
Diketahui Oleh Penulis
Ketua Jurusan
PREFACE
The need of new renewable energy resources has been the majorn concern of many
countries. To maintain the pace of the development, every countries must have sufficient
energy resources. Crude oil, primar energy resources to date, has runned out caused by the
excessive consumption for fueling the development. Palm biodiesel as a new renewable
energy resources may become the new trend in fueling the economic activty. Malaysia as the
largest palm oil producer offer the big potential as the largest palm biodiesel in the world. The
development of palm biodiesel industry will give a significant impact to Malaysian economy.
This study offer a short sight of palm oil industry contribution to Malaysian economy
which can be used as a comparison for the contribution of the development of palm biodiesel
industry to the economy. The development of palm oil industry has given significant impact to
development of rural areas, providing employment opportunities, and reducing poverty.
Medan, 3 Januari 2008
TABLE OF CONTENTS
Preface i
Table of Contents ii
List of Tables iii
Introduction 1
1. Palm oil plantation 1
2. Palm oil production and export 5
3. Poverty Alleviation program 8
4. Employment 11
5. The role of palm oil institutions (PORLA, PORIM, and MPOPC) 11
6. The role of SALCRA on palm oil industry development in Sarawak 13
7. The rate of productivity on major palm oil producing country 15
LIST OF TABLES
1 Palm Oil Plantation (mature and immature), 2 1977-2004 ( ha)
2 Area Under Palm Oil Plantation (Mature and Immature) 4 By States, 2003-2004 (ha)
3 Distribution of Palm Oil Plantation Area by States,2004 (ha) 4
4 Annual Production of Palm Products, 1975-2004 ( tonnes) 5
5 Annual Export of Palm Oil Products ,1975-2004 (tonnes) 7
6 Malaysian Palm Export Value, Share of Agriculture Export 8 and CPO Prices, 1997-2004
7 Number of Poor Households in Agriculture, Peninsular 9 Malaysia, 1970
8 Incidence of Poverty in The Agricultural Sector, Malaysia, 10 1997-1990 (percentage)
9 Employment in Palm Oil Sector, 2003 11
PALM OIL CONTRIBUTION TO MALAYSIAN ECONOMY
Introduction
The Malaysian economy was mainly dependent on tin and rubber after gaining
independence in 1957. These two primary commodities accounted for 50 percent of total
GDP. However, as early as the 1960s, the government recognized the need to expand the
narrow base of the economy and diversify it further to generate economic growth. The
diversification strategies involved initiatives to develop manufacturing through the
establishment of industrial estates and more importantly to diversify agricultural output and
exports through palm oil. Since then palm oil has become an important socio-economic crop
for Malaysia.
The palm oil industry in Malaysia has boosted the economic base towards creating the
current wealth of the nation, hence producing social, economic, and political stability that
Malaysia has enjoyed for a long duration since independence. Palm oil has played an integral
role in the employment sector and poverty alleviation. More importantly, palm oil as one
major oil and fats product in the world market has generated income for the Malaysian
government through export revenues and taxes.
1. Palm Oil Plantation
Palm oil is the biggest plantation crop in Malaysia which has been the prime crop
choice for the diversification program since 1917 (Mohd Jaafar, 1994). Malaysia has
aggressively increased its palm oil plantation by converting rubber plantation (Sehkar, 2000).
Coupled with intensified new land development, in particular by FELDA (Federal Land
Development Authority), state agencies and private sectors, palm oil areas have expanded
from a mere 55,000 ha in 1960 to 1 million ha in 1980 (Arif Simeh and Arif Ahmad,
which was well over one-third of Malaysia’s total cultivated area. It is apparent that palm oil
plantations have been expanding throughout Malaysia including Sabah and Sarawak.
Palm oil plantation areas can be classified as mature and immature lands. Mature land
consists of productive palm oil trees whereas immature comprises unproductive palm oil trees.
Productive tree is said to produce around 4-6 tonnes of palm oil per ha. However with the
development of new high yielding planting materials, which includes clonal planting
materials, the palm oil industry can achieve up to 7-8 tonnes of palm oil per ha. The perennial
crop is harvested throughout the year and remains productive for 20 to 25 years.
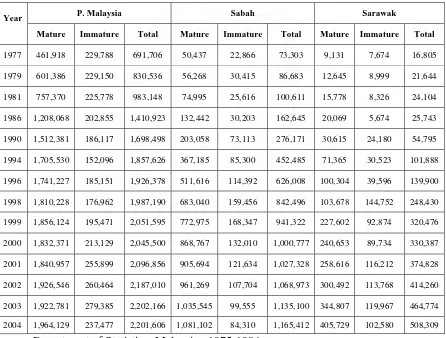
Table 1. Palm Oil Plantation (mature and immature),1977-2004 (ha)
P. Malaysia Sabah Sarawak Year
Mature Immature Total Mature Immature Total Mature Immature Total
1977 461,918 229,788 691,706 50,437 22,866 73,303 9,131 7,674 16,805 1979 601,386 229,150 830,536 56,268 30,415 86,683 12,645 8,999 21,644 1981 757,370 225,778 983,148 74,995 25,616 100,611 15,778 8,326 24,104 1986 1,208,068 202,855 1,410,923 132,442 30,203 162,645 20,069 5,674 25,743 1990 1,512,381 186,117 1,698,498 203,058 73,113 276,171 30,615 24,180 54,795 1994 1,705,530 152,096 1,857,626 367,185 85,300 452,485 71,365 30,523 101,888 1996 1,741,227 185,151 1,926,378 511,616 114,392 626,008 100,304 39,596 139,900 1998 1,810,228 176,962 1,987,190 683,040 159,456 842,496 103,678 144,752 248,430 1999 1,856,124 195,471 2,051,595 772,975 168,347 941,322 227,602 92,874 320,476 2000 1,832,371 213,129 2,045,500 868,767 132,010 1,000,777 240,653 89,734 330,387 2001 1,840,957 255,899 2,096,856 905,694 121,634 1,027,328 258,616 116,212 374,828 2002 1,926,546 260,464 2,187,010 961,269 107,704 1,068,973 300,492 113,768 414,260 2003 1,922,781 279,385 2,202,166 1,035,545 99,555 1,135,100 344,807 119,967 464,774 2004 1,964,129 237,477 2,201,606 1,081,102 84,310 1,165,412 405,729 102,580 508,309
Mature and immature lands of palm oil have been increasing over the years due to the
expansion of palm oil plantations throughout Malaysia (see Table 3.1). Sabah and Sarawak
have abundant supply of land and labor that boosted aggressive palm oil plantations expansion
over the last decade. Peninsular Malaysia on the other hand has slowed down its palm oil
plantation expansion due to land and labor shortage (Hai, 2000).
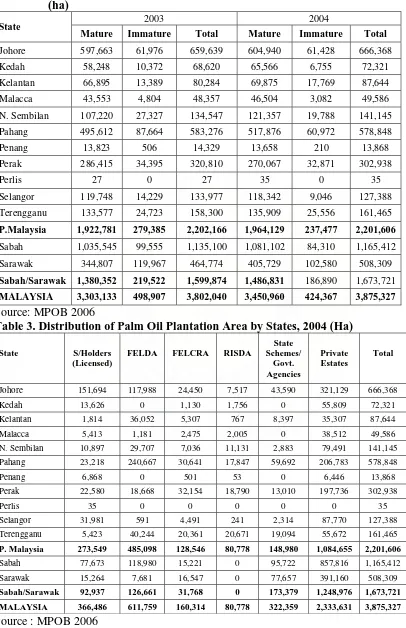
All thirteen federal states in Malaysia, excluding Kuala Lumpur, have planted palm oil
crops in their region. Sabah has the largest palm oil plantations amongst all the states
accounting for 1,165,412 ha in 2004. This consists of 1,081,102 ha of mature land and 84,310
ha of immature land (see Table 3.2). In Peninsular Malaysia, Johor has the largest palm oil
plantation which totaled to 666,368 ha in 2004 comprising 604,940 ha mature lands and
61,428 ha immature lands.
Table 3.3 illustrates that more than 16 percent of total palm oil area was under FELDA
and this covered an area of 611,759 ha. Another 366,486 ha or 9% were under independent
smallholders and other smallholder schemes. FELCRA (Federal Land Consolidation and
Rehabilitation Authority) accounted for 4% of total palm cultivation area while RISDA
(Rubber Smallholder Authority) accounted for 2% of total palm cultivation area. Government
agencies accounted for eight percent of total area. Private companies such as Sime Darby, IOI
Corporation, Golden Hope, KL Kepong, Guthrie, Batu Kawan, and PBB Oils owned the
remaining sixty percent of palm oil areas. These private companies have played a prominent
Table 2. Area Under Palm Oil Plantation (Mature and Immature) by States, 2003-2004 (ha)
2003 2004
Statete
Mature Immature Total Mature Immature Total
Johore 597,663 61,976 659,639 604,940 61,428 666,368
Kedah 58,248 10,372 68,620 65,566 6,755 72,321
Kelantan 66,895 13,389 80,284 69,875 17,769 87,644
Malacca 43,553 4,804 48,357 46,504 3,082 49,586
N. Sembilan 107,220 27,327 134,547 121,357 19,788 141,145
Pahang 495,612 87,664 583,276 517,876 60,972 578,848
Penang 13,823 506 14,329 13,658 210 13,868
Perak 286,415 34,395 320,810 270,067 32,871 302,938
Perlis 27 0 27 35 0 35
Selangor 119,748 14,229 133,977 118,342 9,046 127,388
Terengganu 133,577 24,723 158,300 135,909 25,556 161,465
P.Malaysia 1,922,781 279,385 2,202,166 1,964,129 237,477 2,201,606
Sabah 1,035,545 99,555 1,135,100 1,081,102 84,310 1,165,412
Sarawak 344,807 119,967 464,774 405,729 102,580 508,309
Sabah/Sarawak 1,380,352 219,522 1,599,874 1,486,831 186,890 1,673,721
MALAYSIA 3,303,133 498,907 3,802,040 3,450,960 424,367 3,875,327
Source: MPOB 2006
Table 3. Distribution of Palm Oil Plantation Area by States, 2004 (Ha)
State
Johore 151,694 117,988 24,450 7,517 43,590 321,129 666,368 Kedah 13,626 0 1,130 1,756 0 55,809 72,321 Kelantan 1,814 36,052 5,307 767 8,397 35,307 87,644 Malacca 5,413 1,181 2,475 2,005 0 38,512 49,586 N. Sembilan 10,897 29,707 7,036 11,131 2,883 79,491 141,145 Pahang 23,218 240,667 30,641 17,847 59,692 206,783 578,848 Penang 6,868 0 501 53 0 6,446 13,868 Perak 22,580 18,668 32,154 18,790 13,010 197,736 302,938
Perlis 35 0 0 0 0 0 35
Selangor 31,981 591 4,491 241 2,314 87,770 127,388 Terengganu 5,423 40,244 20,361 20,671 19,094 55,672 161,465
P. Malaysia 273,549 485,098 128,546 80,778 148,980 1,084,655 2,201,606
Sabah 77,673 118,980 15,221 0 95,722 857,816 1,165,412 Sarawak 15,264 7,681 16,547 0 77,657 391,160 508,309
Sabah/Sarawak 92,937 126,661 31,768 0 173,379 1,248,976 1,673,721 MALAYSIA 366,486 611,759 160,314 80,778 322,359 2,333,631 3,875,327
2. Palm Oil Production and Export
Following the rapid expansion in plantation hectarage, the annual palm oil and palm
kernel production has increased significantly. According to Table 3.4, palm oil production in
1975 was 1.257 million tonnes and this has multiplied by 11 times more to 13.976 million
tonnes in 2004. Whilst palm kernel production has increased about 15 times more from 0.232
million tonnes in 1975 to 3.661 million tonnes in 2004. Palm oil and palm kernel production
have steadily increased over the years except in 1998. Palm oil and palm kernel production
faced a slight decrease in 1998 due to the effects of prolonged El Nino to the climatic
conditions in 1996-1997 as well as its own natural decline during the biological cycle of the
palm (Hai, 2000).
Table 4. Annual Productions of Palm Products, 1975-2004 (tonnes) Year Crude
1979 2,188,699 475,039 195,577 244,825
1981 2,822,144 588,783 243,354 339,107
1985 4,134,463 1,211,887 511,908 633,316 1987 4,531,960 1,311,218 562,861 725,993 1989 6,056,501 1,793,690 745,481 933,482 1990 6,094,622 1,844,737 827,233 1,038,221 1991 6,141,353 1,785,218 782,133 955,324 1992 6,373,461 1,874,367 811,978 984,193 1993 7,403,498 2,266,104 965,677 1,183,431 1994 7,220,631 2,203,929 978,143 1,222,747 1995 7,810,546 2,395,588 1,036,538 1,293,144 1996 8,385,886 2,488,750 1,107,045 1,383,034 1997 9,068,728 2,638,068 1,164,697 1,435,104 1998 8,319,682 2,429,468 1,110,745 1,345,277 1999 10,553,918 3,025,690 1,338,905 1,624,134 2000 10,842,095 3,162,760 1,384,685 1,639,227 2001 11,803,788 3,367,710 1,531,917 1,781,641 2002 11,909,298 3,268,635 1,472,932 1,714,522 2003 13,354,769 3,627,235 1,644,126 1,910,100 2004 13,976,182 3,661,456 1,644,445 1,894,017 Source : Department of Statistics, Malaysia : 1975-198
Palm oil has been the major contributor to Malaysia’s export earning, and its role was
particularly significant during the 1997/1998 financial crisis that caused a marked decline in
the Malaysian GDP. In tandem with palm oil production expansion, export of palm oil
products to foreign countries also increased. Several palm oil products that have been exported
to foreign countries included crude palm oil, processed palm oil, crude palm kernel oil,
processed palm kernel oil, palm kernel oil and palm kernel cake. Table 3.5 refers to the largest
palm product export that is crude palm oil. Palm oil exports in 1975 accounted to 0.726
million tonnes and have increased substantially about 17 times to 12.575 million tonnes in
2004.
Malaysian palm oil export value is constantly influenced by two major factors: palm
oil annual production and price. Palm oil annual production in Malaysia has always had a
steady increase but on the contrary, the price of palm oil has been volatile over the years. It
would appear from Table 3.6 that the biggest palm oil export was in 1998, amounting to RM
22.65 million or 48.54 % of the total agricultural export earning. Hence, it emerged as the top
export earner, exceeding the contribution from crude petroleum, petroleum products and
forestry. The 1998 earning from palm oil was 178% higher than that of the previous year and
this was attributed to the sharp increase in CPO prices. In 1998, CPO fetched an average FOB
price of RM 2,377 per tonne compared with RM 1,358 in 1997, an increase of 175%. Export
value in 1999-2001 was lower than 1998 due to the sudden decline in CPO prices. CPO prices
Table 5. Annual Export of Palm Oil Products, 1975-2004 (tonnes)
1977 701,078 726,187 1,559,922 n.a. n.a. 104,981 160,726
1978 574,002 941,827 2,073,563 n.a. n.a. 132,085 103,785
1979 356,098 1,559,922 2,346,749 n.a. n.a. 203,886 224,255
1980 197,659 2,073,563 2,809,206 n.a. n.a. 218,937 259,593
1981 138,779 2,346,749 3,073,784 n.a. n.a. 242,145 266,307
1982 67,716 2,809,206 3,124,110 n.a. n.a. 334,164 387,512
1983 90,673 3,073,784 3,420,974 79,094 289,633 368,727 464,255
1984 59,341 3,124,110 4,441,321 352,502 38,971 391,473 476,059
1985 13,051 3,420,974 4,047,674 409,395 27,720 437,115 683,683
1986 117,485 4,441,321 4,320,547 483,165 51,901 535,066 792,393
1987 170,670 4,047,674 5,172,872 384,008 115,300 499,308 705,326
1988 21,463 4,320,547 5,633,502 320,358 215,307 535,665 735,363
1989 19,239 5,172,872 5,483,344 350,447 310,146 660,623 960,256
1990 93,949 5,633,502 5,493,408 297,152 392,575 689,727 868,591
1991 89,879 5,483,344 6,058,498 256,477 414,816 671,293 819,288
1992 71,624 5,493,408 5,565,032 99,515 356,484 460,735 842,676
1993 58,674 6,058,498 6,117,171 88,502 463,082 391,258 931,317
1994 55,114 6,695,124 6,750,238 50,515 410,219 465,442 960,906
1995 17,274 6,495,682 6,512,956 36,544 354,713 396,785 910,036
1996 68,999 7,142,910 7,211,909 71,067 394,375 462,459 994,215
1997 31,303 7,458,667 7,489,969 17,808 378,977 549,893 1,087,732
1998 41,418 7,423,507 7,464,925 66,410 396,049 520,280 1,217,001
1999 262,123 8,650,272 8,912,395 84,170 465,722 549,893 1,245,493
2000 398,352 8,683,201 9,081,553 20,072 500,208 520,280 1,349,945
2001 1,275,732 9,349,098 10,624,830 74,226 788,962 668,606 1,807,429
2002 1,165,881 9,720,378 10,886,259 59,623 638,822 698,445 1,543,311
2003 1,239,578 11,026,486 12,266,064 79,696 786,962 868,658 1,809,957
2004 1,324,478 11,250,923 12,575,401 88,920 689,938 778,857 1,795,918
Table 6 Malaysian Palm oil Export Value, Share of Agricultural Export and
CPO Prices,1997-2004
Year Export Value (Million RM)
Share of Agricultural Export (%)
CPO Prices (RM per tonne)
1997 12,758 35.7 1,358
1998 22,648 48.54 2,377
1999 14,475 52.3 1,449
2000 9,948 43.2 996
2001 9,876 49.46 894
2002 14,838 56.36 1,363
2003 20,224 59.96 1,544
2004 20,107 55.58 1,610
Source: Export value and share of agricultural export 1997-1998: Ministry of Primary Commodities
Export value and share of agricultural export 1999-2004: Bank Negara Malaysia 2004
CPO Prices 1997-2004: MPOB 2006
3. Poverty Alleviation Program
Rural development and poverty alleviation have been the main aspect emphasized in
the development agenda for Malaysia. The Second Malaya Plan highly prioritized rural
development and poverty by increasing budgetary allocations, establishing rural and
agricultural related development institutions, providing physical infrastructure and
implementing a diversified range of agricultural development programs. The 1969 racial riots
had its roots in poverty and inequality between rural and urban population as well as being
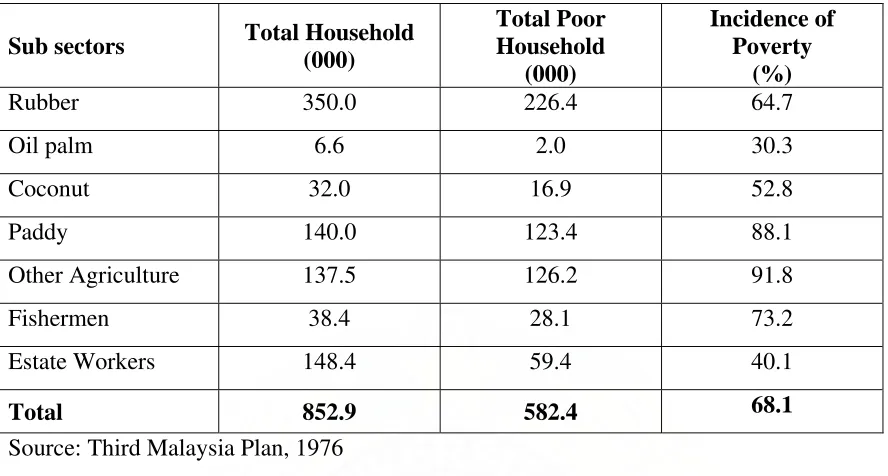
inter-racial. Rural poverty in 1970 was recorded high at 58.7%. In 1970, the incidence of
poverty in the paddy sub-sector was at 88.1%, fishermen (73.2%), rubber smallholders
(64.7%) and coconut smallholders (52.8%) (Arif Simeh and Arif Ahmad, 2001) (see Table
Table 7. Number of Poor Households in Agriculture, Peninsular Malaysia, 1970
Sub sectors Total Household (000)
Total Poor Household
(000)
Incidence of Poverty
(%)
Rubber 350.0 226.4 64.7
Oil palm 6.6 2.0 30.3
Coconut 32.0 16.9 52.8
Paddy 140.0 123.4 88.1
Other Agriculture 137.5 126.2 91.8
Fishermen 38.4 28.1 73.2
Estate Workers 148.4 59.4 40.1
Total 852.9 582.4 68.1
Source: Third Malaysia Plan, 1976
The main causes of poverty were attributed mainly to inaccessibility of small farmers
to productive assets namely, land and capital and also due to the low returns of agricultural
enterprises which farmers were involved in. The Malaysian government has tried to overcome
poverty in relation to the provision of land and capital through massive development of new
land and enhancing the productivity of traditional farms (Arif Simeh and Arif Ahmad, 2001).
Several government agencies such as FELCRA, RISDA and other state government agencies
have converted former rubber plantations into palm oil plantations in order for the landless
poor to gain benefit. Prior to thus development, government management experts used to
operate the smallholdings. RISDA has also aided by providing replanting funds to rubber
smallholders who wish to switch to oil palm. The cultivation of oil palm had certainly played a
dominant role in enhancing the income of the rural population and in the alleviation of poverty
among agricultural smallholders.
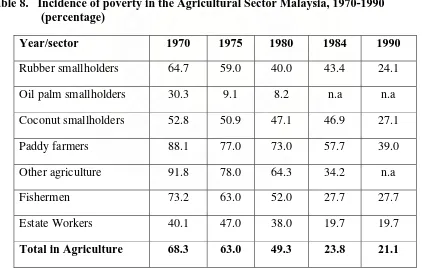
The result of this rural alleviation program has left positive impact to the farmer’s
percent in 1990, as depicted in Table 3.8. In 1990, the incidence of poverty among oil palm
smallholders was the lowest as compared to other sub-sectors in agriculture which was
between 8.2 percent to 30.3 percent while the average incidence of poverty in agricultural
sector during the period was between 21.1 percent to 68.3 percent. Table 3.8 indicates that the
aggressive new land expansion for organized oil palm smallholders can be associated with
significant decline in the incidence of poverty among oil palm smallholders, from 30.3 per
cent in 1970 to only 8.2 per cent in 1980. In 1984, oil palm smallholders were no longer
labeled as significant group related with poverty. The success of this palm-based program is
due to the high returns to farmers, hence increase their standard of living by drawing them out
from the vicious cycle of poverty (Arif Simeh and Arif Ahmad, 2001) .
Table 8. Incidence of poverty in the Agricultural Sector Malaysia, 1970-1990 (percentage)
Year/sector 1970 1975 1980 1984 1990
Rubber smallholders 64.7 59.0 40.0 43.4 24.1
Oil palm smallholders 30.3 9.1 8.2 n.a n.a
Coconut smallholders 52.8 50.9 47.1 46.9 27.1
Paddy farmers 88.1 77.0 73.0 57.7 39.0
Other agriculture 91.8 78.0 64.3 34.2 n.a
Fishermen 73.2 63.0 52.0 27.7 27.7
Estate Workers 40.1 47.0 38.0 19.7 19.7
Total in Agriculture 68.3 63.0 49.3 23.8 21.1
4. Employment
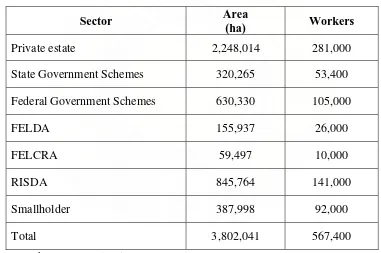
The palm oil industry has been an avenue in terms of employment for the Malaysian
people. Table 3.9 illustrates that in 2003, the total employment in the palm oil sector
comprised 567,000 employees accounted for 41% of total employment in the agricultural
sector and simultaneously 5.9% of total employment in Malaysia (BNM, 2004). The private
sector has the biggest number of employees amongst all the sectors accounting for 281,000
workers followed by RISDA and federal government schemes with each total employee
approximately 141,000 and 105,000 workers respectively.
Table 9. Employment in Palm Oil Sector, 2003
Sector Area
(ha) Workers
Private estate 2,248,014 281,000
State Government Schemes 320,265 53,400
Federal Government Schemes 630,330 105,000
FELDA 155,937 26,000
FELCRA 59,497 10,000
RISDA 845,764 141,000
Smallholder 387,998 92,000
Total 3,802,041 567,400
Source: Bank Negara Malaysia, 2004
5. The Role of Palm Oil Institutions (PORLA, PORIM, and MPOPC)
The success of the palm oil export diversification program cannot solely be attributed
to efforts in enhancing production but also to the accompanied initiatives of the institutional
support of government bodies. These initiatives include penetrating and deepening of markets,
implementing the policy objectives were the PORLA (Palm Oil Registration and Licensing
Authority), PORIM (Palm Oil Research Institute of Malaysia) and MPOPC (Malaysian Palm
Oil Promotion Council).
PORLA's general function was to ensure the orderly development of the palm oil
industry. PORLA issues licenses to those involved in the production, transportation, storage,
exports and sale of palm oil as well as its products. Generally, the regulatory activities of
PORLA are for the quality control of palm oil. PORLA also ensured that product trades
contracts should be PORLA-registered and traders are required to declare the quality of
exported palm oil so that the exported palm oil is in tandem with the quality specifications as
declared in the contract. PORIM’s main function was to improve productivity, value-added,
quality and all other aspects of the industry’s output performance. PORIM also took on the
task of handling all aspects of R&D in palm oil to enhance the performance of the industry.
MPOPC’s main function was to undertake public relations and market promotion of
palm oil mainly for the export markets. It was run as it is a private company that promoted
palm oil by organizing and participating in trade missions, exhibitions and distribution of
information on the nutritional aspects of palm oil. Apart from that the organization also
facilitates joint-venture programs. In promoting exports, PORIM was also engaged in
providing technical support and information on palm oil to increase consumer knowledge on
palm oil and palm oil products through the Technical Advisory Services (TAS) whose
activities are aimed at increasing the utilization of palm oil. Currently PORLA and PORIM
have merged as MPOB in order to further consolidate and strengthen institutional support to
6 The Role of SALCRA on Palm Oil Industry Development in Sarawak
Sarawak Land Consolidation and Rehabilitation Authority (SALCRA) was established
in 1976 as a Government Statutory Body under the Sarawak Land Consolidation and
Rehabilitation Authority Ordinance, 1976. The primary objective of SALCRA is to
consolidate the development of land for agriculture in Sarawak, especially Native Customary
Rights (NCR) Land. According to SALCRA (2006), its functions include:
• Rehabilitating land for agricultural purposes.
• Promoting and undertaking agricultural development or projects in the State.
• Developing for agriculture on its own or amalgamating with others in areas already
declared as development area.
• Initiating and carrying out projects or schemes for development and improvement of
agriculture.
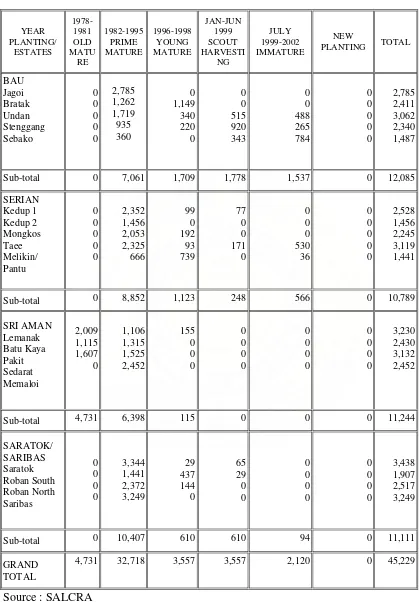
By 2004, SALCRA had established 18 oil palm areas involving 45,229 ha of land in
four regions, namely, Sri Aman, Saribas-Saratok, Serian, and Bau-Lundu regions (see Table
3.10). There are many advantages that SALCRA has brought to the people of Sarawak
especially in terms of accessibility to infrastructure, local involvement in management,
development of rural entrepreneurs, rural human resources development, conversion of land
and investment tools, creation of rural job opportunities, financial benefits, and improvement
Table 10 SALCRA Oil Palm Estates in Sarawak (ha)
4,731 32,718 3,557 3,557 2,120 0 45,229
7 The Rate of Productivity on Major Palm Oil Producer
The five major palm oil producers in the world comprise Malaysia, Indonesia, Nigeria,
Colombia and Thailand. These five countries produce more than 90% of total world palm oil
production. Besides Malaysia, all of other palm oil producing countries have also shown
favorable growth of production in the 1990-2000 periods. Indonesia, in particular, registered a
double-digit growth (11.2% per annum) with its production increasing from 2.4 million tonnes
in 1990 to 6.9 million tonnes in 2000. Thailand and Colombia also registered impressive
growth of 9.2% and 8.8% respectively, albeit in relatively low hectarage (Yusof Basiron,
2001a). Malaysian growth in comparison was a little sluggish than the average growth. This
could be attributed to the fact that many palm oil land areas in Malaysia are still immature and
due to low capacity production.
The country which had the largest productivity in 2000 is Colombia with 3.91 tonnes
per ha, followed by Malaysia with 3.68 tonnes per ha, Indonesia with 3.45 tonnes per ha,
Thailand with 2.81 tonnes per ha and Nigeria with 2.05 tonnes per ha respectively. From these
productivity rates, we can conclude that Malaysia has advanced technologies to plant and
produce palm oil. Nevertheless, the cost of producing palm oil in Malaysia is relatively more
expensive compared to Indonesia. The high cost of palm oil production in Malaysia is mainly
due to the high cost of labor and land shortage especially in Peninsular Malaysia. This
condition would lower Malaysia’s competitiveness in palm oil due to higher production cost.
Despite the higher production cost, Malaysia is not totally deterred by this aspect. In
consequence, Malaysia has initiated the use of more technical equipments to operate palm oil
of more technological plantation, the production cost will be minimized and Malaysia’s
Reference
Arif Simeh And Arif Ahmad. 2001. The Case Study on The Malaysian Palm Oil. Paper Presented at Regional Workshop on Commodity Export Diversification and Poverty Reduction in South East Asia, Bangkok, 3-5 April.
BNM. 2004. Annual Report. Bank Negara Malaysia, Kuala Lumpur: Government Printers
Hai, T.C. 2000. Land Use The Oil Palm Industry In Malaysia. WWF Malaysia, Kuala Lumpur.
Mohammad Jaafar. 1994. “The Malaysian Palm Oil-A Dynamic Industry” Selected Reading on Palm Oil and its uses. PORIM Publications, Selangor, Malaysia.
Sekhar, B.C. 2000. The Malaysian Plantation Sector, Rubber, Oil, Palm-The New Millennium Equator. Paper Presented at the Eminent Person Lecture, Academy of Science Malaysia, Kuala Lumpur.