The Effect of Product Atlributes, Price and Marketing Communication on Perceived Quality of the GSM Hand Phone User
(Case Study atUIN Students)
SKRIP SI
Submitted to Faculty of Economics and Social Science as Partial Requirement fo Acquiring the Bachelor Degree of Ec..onomics ·
II 111111
セ@111
Submitted by: Nur Khairiyah Student ID: 604081000012
INTERNATIONAL CLASS PROGRAM MANAGEMENT DEPARTMENT
FACULTY OF ECONOMIC AND SOCIAL SCIENCE UNIVERSITAS ISLAM NEGERI SY ARIF HCDAYATULLAH
I
I
The Effect of Product Attributes, Price and Marketing Communication on
Perceived Quality of the GSM Hand Phone Users
(Case Study at UIN Student)
SKRJPSJ
Submitted to Faculty
of
Economics and Social Sciences As Partial Requirement for Acquiring the Bachelor Degree of EconomicsAcademic Advisor I
Dr. Rofikoh Rokhim
Submitted by: Nur Khairivah AS Student ID: 604081000012
Under Guidance of
Academic Advisor II
df!I
セ@
Sisdjifttmo K. Widhaningrat
INTER1'lATIONAL CLASS PROGRAM
MANAGEMENT DEPARTMENT
FACULTY OF ECONOMICS AND SOCIAL SCIENCE
UNIVERSIT AS ISLAM NEGERI SY ARIF IIIDAY ATULLAH
l'he li:ffect of Product f\ttributcs, Price and lVlarkcting C:on1111unication on Perceived Quality of the GSM Hand Phone User
(Case Study at lllN Student)
SKIUPSI
Subn1ilted to Faculty of Econon1ics and Social Science as Partial l\equire1ncnt f'ur i\cquiring the Bachelor Degree or Economics
Academic i\dvisor I
Dr. Rofikoh Rokhim.
Submitted by: Nur J(hairivah Student ID: 604081000012
Under Guidance or
Sisdjiatmo K. Widhanirn.(ra!
Professional Exan1ine(
b-J_
ProL [ r. Azzan1 Jasin
INTERNATIONAL CLASS PROGRAM MANAGEMENT DEPARTMENT
FACULTY OF ECONOMICS AND SOCIAL SCIENCE UNJVERSITAS ISLAM NEGERI SY ARIF H!IDA YATllLLAH
Today. we administered a comprehensive examination to Nur Khairiyah, TD 604081000012. The title of her thesis is: "The Effect of Product Attributes, Price and Marketing Communication on Perceived Quality of the GSM Hand Phone Users".
After proper examination of the student, we have decided that she has met all of the requirements for the title of bachelor of economics on the field of management, State Islamic University (Universitas Islam Negeri) Syarif Hidayatullah Jakarta.
.Jakarta, 28 August 2008
Comprehensive Examination Team
Prof. Dr. Abdul Hami_ci, MS.
p,Qim;LMM
AUTO BIOGRAPHY
Name: Nur YJiairiyah AS.
Place
I
Date of Birth: Pasir BelengkongI
28 April 1986Religion: Islam
Address : JI.Negara No.29 RT VI Kec.Pasir Belengkong Kab.Pasir 76271 Kalimantan Timur
Sex:
Faculty I Major :
University:
Occupation :
Phone no: E-mail Education:
Or
JI. Persatuan no.JS
Rt.
VINII Komp.Bapem Kamp. Baru 11560 Jakarta BaralFemale
Faculty of Economics and Social Sciences I
Management
State Islamic University Syarif Hidayatul!ah Jakarta
Student and Freelance as PIC in Markplus Training
081310809075
khair [email protected]
- UIN SyarifHidayatullah Jakarta (2004) - International Islamic University Malaysia
(2006 - 2007)
Preface
Alhamdulillahirabbil'alamin, !he firs! word I express as a thankful to Allah who give me a power and make it easier to finish my thesis. Also, Prophet of Islam, Muhammad SAW who gave me inspiration and a good exarnple for my life.
I express special thank to my lovely family: Dad, Mom, Bro, Sis and cute nieces, Jihan and Nayla, and my big families in Kalimantan and Jakarta. I love you so much.
I owe a debt of thanks to my lecturers, Bpk. Sisdjiatmo, Bu. Dr. Rofikoh who helps me to finish this thesis with their patient and times. Also, thanks to all of lecturers who taught me for 4 years especially Bpk. Arisman and other International Program staffs.
Thanks to all of my friends at International Prog.ran1, specially Fitri,Kiki, tia, icha, nada, rika and every body that I could not mention one by one. I love you all.
Persepsi terhadap qualitas didcfonisikan sebagai p<:ndapat dan pertimbangan seseornng tcrhadap scbuah produk secara keseluruhan. Ila! yang dapal mempengaruhi persepsi seseorang terhadap qualitas disebabkan oleh banyak foktor. Akan tetapi, dalam penelitian ini hanya tiga faktor yang akan dibahas secara rinci, antara lain adalah: atribut produk, harga dan komunikasi dalam pemasaran sebuah produk. Ini bertujuan untuk menemukan dan menganalisa pengaruh tiga faktor tersebut terhadap persepsi qualitas seseorang pada handphone GSM. Adapun merk handphone yang digunalcan adalah Nokia, Sony Ericsson, Samsung and Motorola. Penelitian ini dilakukan terhadap I 00 mahasiswa di Fakulta Economi dan Social UIN Syarif Hidayatullah Jakmia.
Ahstrnct
Perceived quality is defined as the consumer's judgment about a product's overall excellence or superiority. The factors that affect consumer perceived quality could be many factors. But, only three variable factors that writer tries to find tlmii1gh it out. The purpose of this research is to analyze the effect three variables (product attribute, price and marketing communication) to perceived quality. The study analyze to four GSM hand phone brand, in order to know how customer perceived the quality to those products. Tl.ey are: Nokia, Sony Ericsson, Samsung and Motorola. The research is conduct at Economic faculty of UIN Syarif Hidayatullah Jakmia to 100 respondents (students).
Based on data that are gathered in this research show that price is the highest one and product attribute are the second factor that affect consumer perceived quality, whereas marketing conununication factor has no affect toward consumer perceived quality. It means that Price will effect the perception of students (as respondent) toward the quality of hand phone GSM. The tool that used in this research is SPSS
13.0.
< '( lN'l'l<'.NTS
Co.nprehcnsive improvement. ... i
Auto Biography ... ii
Preface ... iii
Abstrak ... iv
Abstract ... v
Contents ... vi
List of tables ... ix
List offormulas ... xi
CHAPTER I. INTRODUCTION A. Background ... I B. Problem Identification ... 6
C. Purpose ofStudy ... 6
D. Research Benefit. ... 7
CHAPTER JI. LITERATURE REVIEW A. Perceived Quality ... 8
B. Product Attribute ... ! I C. Price ... 13
D. Marketing Communication ... 15
E. Hypothesis ... , ... 17
F. Critical School ofThought ... 18
CHAPTER III. METHODOLOGY
A.Scope of Research Study ... , ... 20
B. Sampling Method ... 20
C. Data Collection Method ... 21
D. Validity and Reliability Tes ... 22
E. Analysis Method ... 24
F. Classical Assumption Test.. ... .26
G. Multi Linear Regression Test. ... 29
H. Operational Variable ... .34
CHAPTER
IV. ANALYSIS A. General Description of Research Object I.Location and Time ofResearch ... .382. Characteristic of Respondent ... .38
B. Validity and ReliabiltyTest... ... .42
C. Finding and Discussion l. Descriptive Analysis ... .45
D. Assumption Classic I. Autocorrelation Test ... 53
2. Multicollinearity Test ... 54
3. Heteroskesdastisity Test. ... 55
E. Multiple Linear Regressions
I. Descriptive Statistics ... 58
2. Correlations ... 59
3. Similarity of Multiple Linear Rl gression ... 60
4. Coefficient determination (R2) ... 61
5. F-test. ... 62
6. T-test.. ... 63
F. Multiple Liner Regression (Second Test) I. Similarity of Multiple Linear Regression ... 66
2. Coefficient determination (R2)... .. .. ..67
3. F-Test. ... 68
4. T-Test. ... 69
G. Final Analysis ... 72
CHAPTER V. CONCLUSSION AND IMPLICATION A. Conclusion ... 73
B. Implication ... 75
C L' . . . u111tat1on o ·fS tudy ... · 76
References ... 77
List of Tables
Explanation
Table 1.1 Price List ofI-land phone
Table 2.1 Product Attribute
Table 3.1 Category Reliability Instruments
Table 3.2 Likert Scale Category
Table 3.3 Durbin Watson
Table 3.4 Operational Variable Analysis
Table 4.1 Data Respondent
Table 4.2 Data Respondent
Table 4.3 Pre Test of Questionnaires
Table 4.4 Reliability Test
Table 4.5 Descriptive Analysis of Perceived Quality
Table 4.6 Descriptive Analysis of Product Attribute
Table 4.7 Descriptive Analysis of Price
Table 4.8 Descriptive Analysis of Marketing Communication
Table 4.9 Durbin Watson
[image:12.595.68.462.125.665.2]Table 4.10 Autocorrelation Test
Table 4.11 Multicollinearity Test
Table 4.12 Descriptive Test
Table 4.13 Correlations
Table 4.14 Similarity of Multiple Linear Regressions
Table 4.15 Coefficient Determination
Table 4.16 F Test
Table 4.17 T Test
[image:13.595.75.528.46.698.2]Table 4.18 Second Test: Similarity of Multiple Linear Regressions Table 4.19 Second Test: Coefficient Determination
Table 4.20 Second Test: F Test Table 4.21 Second Test: T Test
Table 4.22 Comparison of Regression Test Score Table 4.23 Final Analysis
List of Formula
Explanation
Page
2.1 Perceived value 10
3.1 Sample Size 20
3.2 Validity Test 23
3.3 Reliability Test 23
3.4 Descriptive Analysis 25
3.5 Durbin Watson 26
3.6 Multiple Linear Regressions 29
3.7 F-Test 31
A. Background
Chapter I
Introduction
Information and communication are part of technological development. Public consumption for technology makes technological world more sophisticated. Communication that requires longer time for the connection now with technology becomes reachable and without boundary. One of the technologies that set a trend is hand phone. Technology causes faster changes and big scale (Jacob, 2001: 200-283). Hand phone is an electronic communication tool that has same basic ability with fixed line telephone so that it can be brought anywhere (portable) and is not required to connect to the telephone net that used a cable I wireless (www.one.indoskripsi.com). Numerous hand phone products are offered to fulfill market demand. In order to grab market share, producers offer new product with good packaging, services and features.
expectations. Satisfaction is feeling likeability or dislikeability of someone which emerging after comparing between performances (result) product thou!!ht the product performance (or result) that expected. Monroe and Krishnan (1989) said there is any relation between price and perceived quality.
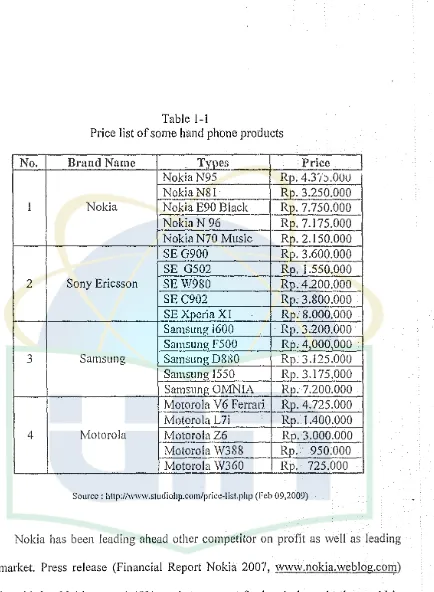
Table 1-1
Price list of some hand phone products
No. Brand Name Tvoes
Price
I
NokiaN95
Re.
4.3'/::i.oouNokiaN81
Re.
3.250.0001 Nokia Nolda E90 Black -
Re.
7.750.000Nokia N 96 Re. 7.175.000
Nokia N70 Music Rp. 2.150.000
SEG900 Rp. 3.600.000
SE G502 Rp. 1.550.000
2 Sony Ericsson SE W980 Rp. 4.200.000
SE C902 Ro. 3.800.000
SE Xoeria XI Ro. 8.000.000 Samsung i600 Ro. 3.200.000
Samsmm F500 Rp. 4,000,000
3 Samsung Samsunrr D880 Re. 3.125.000
Samsung !550 Rn. 3.175.000 Samsung OMNIA Ro. 7.200.000 Motorola V6 Ferrari RP. 4.725.000 Motorola L7i Ro. 1.400.000
4 Motorola MotorolaZ6 Ro. 3.000.000
Motorola W388 Re. 950.000 Motorola W360 Ro. 725.000
Source: ィエエーZOO|カ|v|カNウエオ、ゥッィーN」ッQョOーイゥ」」セャゥウエNーィー@ (Feb 09,2009)
Nokia has been leading ahead other competitor on profit as well as leading the market. Press release (Financial Report Nokia 2007, セカキキNョッォゥ。Nキ・「ヲッァN」ッュI@
[image:17.595.91.525.39.631.2]Detikpublishing.com (2006) explained that cellular phone users in the world more or less are 2.2 billion peoples. That amount is predicted will be increased around 3 billion in the 2008.
Based on the survey result of Pixel research in Jakarta, showed that around 24.6% hand phone user change the handset more than 2 times in 2 years, it means that people buy hand phone product 2 times in 2 years. So, there are 56.9% of hand phone user who tend to change their hand phone in I year. Some people who will buy new hand phone because of trend, the total is 20.3%.
Samsung is one of first pioneer in polyphonic ring tone technology. Since 2000 until now, Samsung showed the innovation of screen technology compared to other competitors. They offer highest internal hand phone memory up to 4 GB.
Nokia, Sony Ericsson and Samsung have strong brand m the market. The requirements of strong brand are large market share, high ヲオエオイセ@ v<11uc brand, consistent in innovation and creative branding that is applied by 3 of those brands.
B. Problem Identification
This study identifies three problems
I. Product attribute affecting the perceived quality to the hand phone user 2. Price affecting the perceived quality to the hand phone user
3. Marketing communication affecting the perceived quality to the hand phone user
4. Product attribute, price and marketing communication affecting the perceived quality to the hand phone user
C. Purpose of Study
The purposes of this study are:
I. To analyze the effect of Product Attribute on Perceived Quality of GSM Hand phone users.
2. To analyze the effect of Price on Perceived Quality of GSM Hand phone users.
3. To analyze the effect of Marketing Communication on Perceived Quality of GSM Hand phone users.
D. Use of Study
By
achieving purposes of the study above, it is expected that: I. Understanding and experienced to do market research2. This research could give opinion or suggestion toward result of researches. 3. This research could be a new information to improve the product selling and
Chapter II
Literature Review
A. Perceived Quality
Perception is the process by which an individual select, organizes and interprets information inputs to create a meaningful picture of the world. In marketing, perceptions are more important than the reality, as it is perceptions will affect consumer's actual behavior. Perceived quality is part of brand equity. Perceived quality is the overall subjective judgment of quality relative to the expectation of quality. These expectations are based on one's own and others' experiences, plus various other sources including brand reputation, price, and advertising (Zeithaml 1988, Dodds et al. 1991, Boulding et al. 1993, Johnson et al. 1995). Perceived quality is the perception of the customer; hence, we use it interchangeably with customer perceptions of quality.
Cleland and Bruno (1996), mention about 3 principle of perceived quality, there are:
They measure the quality of product based on the total of attribute (multi-attribute analysis).
b. Quality exists only as is perceived by customers. If perception of customer toward the product is low, hence the quality of product is low, what ever the quality in reality. Perception more important than the reality. Customers consider quality based on the perception, not reality. So, perception is reality. c. Perceived quality measured relatively to competitor. If product A better than
product B, hence the product A has good quality in customer perception.
Perceived quality is a perception of consumer toward overall quality to the product or services that offered. Aaker ( 1991) defined the perceived quality as. "Customer perception and judgment of the overall quality or superiority of a product or service with respects to its intended purpose, relative to alternatives." The judgment of perceived quality will depend upon the context.
Groonroos (2000:67) divided to basic quality dimensions; they are what and how- in the minds of the customer. The quality perception process is more . complicated. It not just the experience of the quality dimensions that determine
whether quality is perceived as good, neutral, or bad.
represent a mental trade-off between the quality and benefits they perceive in the product relative to the sacrifice they perceive by paying the price:
Perceived value= perceived benefits (gain) Perceived sacrifice (give)
... (2.1)
Where perceived benefits are a fimction of perceived quality, perceived quality is positively related to price and perceived sacrifice is positively related to price. Perceived quality has been defined as the consumer's evaluative judgment about an entity's overall excellence or superiority in providing desired benefits (Arnould, 2002). According to one theory, consumers use an array of sensory cues as indicators of quality. Cues are used according to their predictive value, the degree to which consumers associate a given cue with product quality, the confidence value of a cue, and the degree to which consumers have confidence in their ability to use and judge that cue accurately. Consumer rely on both extrinsic cues, such as price, brand name, packaging, store name, country of origin, and even color. Intrinsic cues, such as taste, texture, and aroma, when assessing product quality. Brand name represents a composite of information about product attributes. A brand's perceived quality may exett a positive influence on the perceived value of a retail firm.
the product or services. Moreover, quality has both cognitive (thinking) and affective (emotional) aspect (Steenkamp, 1994: 101-9). Some scholar belief that high perceived quality leads to repeated purchases. However, Rust and Oliver (1994) said, Perceived quality is more specific concept based on product and service feature, also can be controlled.
The key to obtaining high perceived quality is to deliver high quality, to identify those quality dimensions that are impo11ant; to understand what signals quality to the buyer, and to communicate the quality message in a credible manner.
C. Product Attribute
1.
Attribute DefinitionIn Oxford Wordpower Dictionary, attribute is quality or feature (physical attributes). Then, Oxford, Dictionary of Business and Management, attribute is a characteristic of a product or service that can be measured by a rating having only two possible states. Probably the most used positioning strategy is
to
associate an object with a product attribute or characteristics. To use of several attributes can work well when they support each other (Aaker, 1991 : 114-5).portray a pmiicular image as well as to evoke paiiicular sensory or emotional reaction. The packaging role is particularly important in creating expectations for new customer and for newly established service organizations that are trying to build a particular image Zeithaml and Bitner: 2003:205).
Table 2.1
Product Attributes
]. Durability 2. Brand 3. Performance
4.
Design5.
Feature 6. Style·o Source: Basic Marketmg Module ofMarkplus framing
Product attribute - in brand, feature, durability, style, design and performance - has an important impact on consumer choice. Gitosudarmo (2000) said that product attribute is a component characteristic of product that might fulfill the need and desire of customer expectation. Product attributes are the benefits of products, and these benefits are the smface means used in adve1tisement and promotion offer to connect the brand with a motivation which influence brand attitude (Rossister,1987).
[image:26.595.84.476.204.536.2]to find out which attributes consumers use to judge products (Snelders and Schoormans 2000). Making a product different from it's competitors by adding even a meaningless attribute can increase consumers' quality perception or can decrease perceived risk (Simonson and Tversky, 1992). It is evident that product attributes are most salient to the consumers (Garvin, 1983, 1984). In reality, during the decision for dealing, it is assumed that consumers not only consider the present value of the products but also take the future performance or future associated with the product attributes into consideration (Chowdhury and Islam, 2003). The consumer perceptual salience with pmticular attribute would draw consumers' attention and influence their purchasing processing (Hutchinson and Alba, 1991 ).
D. Price Concept
prices, the price characteristics of the product line influences consumer evaluations (Petroshius and Monroe, 1987).
Buyers do not use price as a measure of cost (sacrifice) but also use as an indicator of product quality. The buyer tend to prefer higher-priced products when price is the only information available, when there is a belief that the quality of available brands differs significantly, and when the price differences between choices are large (Monroe 1973). Monroe and Krishnan (1989) said there is any relation between price and perceived quality.
The dependence on price as a proxy for quality is especially strong when two conditions exist. First, consumers believe that differences between alternative product offerings exist. Second, consumers have little information or experience with the products concerned. Many of costumer used price as measurement to judge the quality of products. Means, image of price is very effective to give prestige and ego sensitive of products. Price becomes a quality cue, especially when a product is difficult to evaluate objectively or when status is involved.
E. Marketing Communication
Marketing communication is one of the main external indicators of product quality. Kotler said in his book "Marketing Management" that Marketing communication are the means by which firms attempt to inform, persuade, and remain consumers-directly or indirectly-about the products and brands that they sell. In a sense, marketing communications represent the "voice" of the brand and are means by which it can be establish a dialogue and build relationships with consumers.
The marketing communication mix consists of six major modes of communications;
I. Advertising: Any paid form of non personal presentation and promotion of ideas, goods, or ウ・イカゥ」セウ@ by an identified sponsor.
3. Events and expenences: Company-sponsored activities and programs designed to create daily or special brand-related interactions.
4. Public Relations and Publicity: A variety of program designed to promote or protect a company's image or its individual products.
5. Direct Marketing: Use of mail, telephone, fax, e-mail, or internet to communicate directly with or solicit response or dialogue from specific customers and prospects.
C. Plot of Analysis
Diagram2.2
Data Collecting
I
Validity and Reliability Test
Factorial Analysis
I
Classical Assumption TestJ
.!.
i
セᄋ@
.!.
Autocorrelation Multikolinearity Heteroskedasity Normality
Test Test Test Test
I
I
I
Multilinear Regression TestI
Analysis
Chapter III
METHODOLOGY
A. Scope of Research Study
1. The respondents for this research are students of Faculty of Economics that is divided into 4 concentrations (major: Management, Accounting, International Relations and Development Study)
2. This research will be conducted at Faculty of Economics UIN Syarif l-Iidayatullah Jakarta.
B. Sampling Method
The sample will be taken with non probability sampling technique. That technique does not use selection procedure, but based on personal judgment only. These research uses convenience sampling which refers to a collection of information from members of the population whom at the moment are conveniently available to provide it (sekaran, 2003). The sample of this research is student who uses GSM hand phone at Faculty of Economics UIN SyarifHidayatullah Jakarta.
Based on the calculation of sample size formula (Malhotra, 2004), proportion approach is being used, where the exact level (D) = P - n: ± 0, 05 (5%), Confidence level is 95 %, z value is 1.96, and standard deviation (n:) estimated around 7 %, then, the sample size (n) that will be the target of this research is 100 respondents.
C. Data Collection Method
This research uses a survey of field research by questionnaire distribution to 100 students as respondent from Faculty of Economics in UIN Syarif I-lidayatullah Jakarta.
In order to obtain the information that is needed to support the research, the data distribution techniques used are as follows:
1. Field Research
This research is done by collecting the information by distributing the questionnaire to each respondent directly.
2. Library Research
The types of data used in this research are: I. Primary Data
Primary data refers to information that is developed or gathered specifically for the research project at hand, such as Questionnaire. (Burns and Bush, 2006: 146)
2. Secondary Data
Secondary data refers to information gathered by someone other than researcher himself conducting the current study, such as: books, journals, research report, thesis, internet and other media information).
D. Validity and Reliability Test
To examine the validity and reliability of the questions, it must be distributed to 30 respondents to test the accuracy and consistency of questions.
a. Validity Test
... (3.2)
Where:
N =Total of respondents X = Score of questionnaire Y = Total score
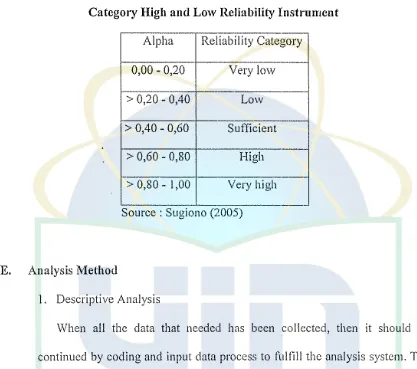
b. Reliability Test
Measurement of reliability showed through Croanbach 's Alpha coefficient. Reliability test purpose is to know the consistence and appropriate measurement, if measurement is arranged to the same object and instrument rapidly. In order to test reliability in this research, croanbach's alpha test
will
be used.Where:
r = Reliability
K =Number of questionnaire crb =Item variance
crt = Tot"I variance
Table 3.1
Category High and Low Reliability Instrument
Alpha Reliability Category 0,00 - 0,20 Very low
> 0,20-0,40 Low
> 0,40 - 0,60 Sufficient
> 0,60 - 0,80 High
--> 0,80- l,00 Very high --Source : Sugiono (2005)
E.
Analysis MethodI. Descriptive Analysis
When all the data that needed has been collected, then it should be continued by coding and input data process to fulfill the analysis system. The data that is ready for processing will be continued by using SPSS 13.0
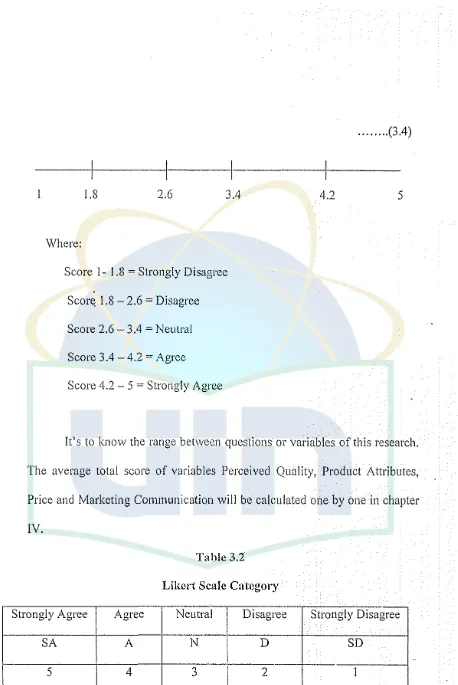
[image:36.595.62.479.167.536.2]1.8 2.6 3.4
Where:
Score 1- 1.8 = Strongly Disagree Score 1.8 - 2.6 =Disagree Score 2.6 - 3 .4 = Neutral Score 3.4 -4.2 =Agree Score 4.2 - 5 = Strongly Agree
... (3.4)
4.2 5
It's to know the range between questions or variables of this research. The average total score of variables Perceived Quality, Product Attributes, Price and Marketing Communication will be calculated one by one in chapter
IV.
Strongly Agree Agree
SA A
5 4
Table 3.2
Likert Scale Category
Neutral Disagree
N D
3 2
Source: Sugiono: Metode Penelitian Bisnis, 2005, P. 87
Strongly Disagree SD
[image:37.595.70.528.24.709.2]F. Classical Assumption Test
Multiple Linear regression models could be a good model when it fulfills the normality data and free from statistic classical assumptions: whether it is Autocorrelation, Multicollinearity and Heteroskesdastisity.
1. Autocorrelation
Autocorrelation known as serial correlation and usually found on time series data. Autocorrelation examination in certain model aims to recognize whether there is any correlation between intruder variables (et) in uncetiain period with the previous intruder variable (et - I). The procedure is conducted in order to know Durbin Watson test, by using the following formula;
a
L(,<-<-,_,)' DW= '"-2
-"
Ie,'
1-1... (3.5)
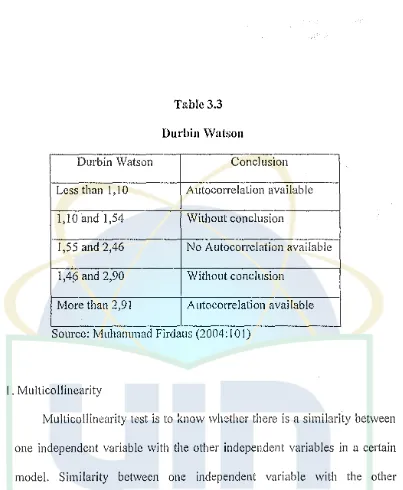
Durbin Watson Less than l , 1 0 1,10 and 1,54 1,55 and 2,46 1,46 and 2,90 More than 2,91
Table 3.3
Durbin Watson
Conclusion Autocorrelation available Without conclusion
No Autocorrelation available Without conclusion
Autocorrelation available Source: Muhammad Firdaus (2004: l 0 I)
J. Multicollinearity
Multicollinearity test is to know whether there is a similarity between one independent variable with the other independent variables in a certain model. Similarity between one independent variable with the other independent variable in certain model is causing a strong correlation that
happened betvvccn one independent variable vvith another independent
[image:39.595.91.494.50.540.2]I.
2. Heteroskesdastisity
Heteroskesdastisity test which aimed to examine the regression model happened by any residual variance in certain monitoring period to other monitoring period. If this characteristic is fulfilled, that means factor of intruder variation towards the data has the characteristic of heteroskesdastisity. If that assumption cannot be folfilled hence there is a divergence'.. The divergence towards this intruder factor is called as heteroskedastisity. A good regression model is homokesclastisity.
According to Bhuono (2005: 62), to predict there is heteroskesdastisity or not in a certain model, can be seen fro,n the picture of its scatterplot. In the scatterplot graph, it says multi linear regression is having no heteroskesdastisity if:
a. The dot of the data is spreading above and below or around line 0. b. The dots are not just grouping above or below line 0 only.
c. The dots is not spreading wider wave and then narrowing and widening again.
d. The spread should not have a pattern.
3. Normality Data Test
various ways, one of it is by looking at the normal curve of
Q-Q
Plot. A normal variable is when the diagram of distribution with the dots spreads around the diagonal line, and the spreading of dots data are located on along one diagonal line.H. Multiple Linear Regression Test
This researdi will be using multi linear regression because we need to !mow how big the influence of the variable Product Attributes (XI), Price (X2) and Marketing Communication (X3) in order to form a customer loyalty (Y).
By using the formula of similarity as follows:
Y
=
a+
fl!
XI
+
fl2
X2
+
fl3
X3
+
E
Where:
Y
=
Customer Loyalty a =Constantf3
= Coefficient RegressionXI =Product Attributes X2= Price
X3 =Marketing Communication
E = Standard Error
To examine the data, this research will use some statistics (coefficient determination I R2 Test, F Test, and T Test), they are: (Bhuono, 2005)
I. Coefficient determination (R2)
Coefficient determination (R2) aims to understand how big the ability
of independent variable explaining dependent variable. In the SPSS output, coefficient ·determination is located in the summarl model table and R square. However, for multi linear regression, R square is used because there will be adjustment with the total independent variables that are used in the research.
2. F Test
The function of F Test is to see and understand the influence of both independent variables towards dependent variable. To examine hypothesis: Ho : b
=
0, hence steps that is used to examine the hypothesis with F Test is as follows:a. Determining I-lo and Ha
Ho : b = 0 (there is no significant influence between independent variable with dependent variable).
Ha : b
#
0 (there is significant between independent variable and dependent variable).Level of significance used is 5% or (a)= 0,05 c. Determining score of F-test
To determine F-test the formula as follow:
R2 I k
A]セMセセMセ@
(1-R')!(n-K--1)
... (3.7)Where:
R2 =Coefficient determination n =Total of observation I sample k1 =Total of independent variable
d. Determining the criteria acceptance and reject of Ho If probability< 0,05 - ; . reject Ho
If probability> 0,05 - i . - accept Ho
3. T test (Partial Test)
than level of sign!ficant that has been determined or t-test (int column) larger than t-table (counting from two tailed
a
= 5% df = n - k, k is a total independent variable). To examine hypothesis by t test as follow:a.) Determining Ho and Ha
Ho : b = 0 (coet1icient regression not significant) Ha:
li
-F
0 (coefficient regression significant) b.) Determining level of significanceLevel of sign[ficance use is amount 5% Or (a) セ@ 0, 05
c.) Determining T test
Determining t-test can be formulated as follows:
Sb= Se
I ,
L;Y
- -
r:z::x')
V -'
\
nセl[yGM。l[yM「l[xy@
Se= ( n-2 )
Where:
a = Constant
b =Coefficient correlation n =Total sample
Sb = Book error coefficient correlation Se =Book error estimation
· If t-test > I table therefore Ho is rejected and Ha is accepted, that means independent variables influence dependent variable.
If t-tesl < t table therefore Ho is accepted and Ho is rejected, that means independent variables have no inflllence towards the dependent variable. The level of significance used is 5% or (a.)= 0,05.
I. Operational Variable
To understand the research carefully and also to avoid mistakes in understanding and developing the research, hence there must be a border understanding from the variables that will be used in research, i.e;
I. Independent Variable
Independent variable is one factor that influences the dependent variable. In this research the independent variable is Product Attributes (X2), Price (X2) and Marketing Communication (Xi) .
•
a. Product Attributes (X2)
Product attributes; including product aspect and non product of hand phone product that offer product aspect, such as; product variation, quality (durability), brand name, logo, color, slogan, symbol, packaging, and product design itself. Non-product, such as; feature, guarantees etc.
Price is the formal ratio that indicates the quantity of money, goods, or services needed to acquire a given quantity of goods or services. Price is used by individuals as an informational stimulus for judging the product. c. Marketing Communication (Xi)
represent the "voice" of the brand and are means by which it can be establish a dialogue and build relationships with consumers.
2. Dependent variable
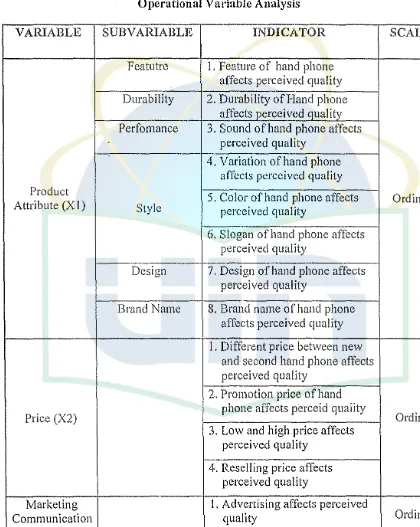
Table 3.4
Operational Variable Analysis
VARIABLE SUBV ARIABLE INDICATOR SCALE
Featutre J. Feature of hand phone
-affects perceived quality Durability 2. Durability of Hand phone
affects perceived qualitv Perfomance 3. Sound of hand phone affects
perceived quality 4. Variation of hand phone
affects perceived quality
Product
-Attribute (X 1) Style 5. Color of hand phone affects Ordinal perceived quality
6. Slogan of hand phone affects perceived quality
Design 7. Design of hand phone affects perceived quality
Brand Name 8. Brand name of hand phone affects perceived quality I. Different price between new
and second hand phone affects perceived quality
2. Promotion price of hand
Price (X2) phone affects perceid quaiity Ordinal
3. Low and high price affects perceived quality
4. Reselling price affects perceived quality
Marketing l. Advertising affects perceived
Ordinal
Communication quality
(X3) Advertising
Sales Promotion 3. Dummy Products affects perceived quality
4. Sponsorship program affects Event& perceived quality
Experieces 5. Music concert program affects perceived quality
Public Relation & 6. Radio affects perceived Publicity qualitv
7. Launching program affects perceived qua I ity
Personal Selling
8. Personal selling affects perceived quality
9. E-commerce affects perceived quality
Direct Marketing I 0. Marketing through email affects perceived quality lliarketing through email affects perceived quality 1. Using good quality of hand
セゥ・@
2. Product attribute affects
Perceived perceived quality
Ordinal Quality (Y)
Chapter
IV
AnalysisA:·
General Description of Research Object1. Location and Time of Research
This research is held in the Economics and Social Sciences Faculty of State Islainic University (UIN) Syarif Hidayatullah Jakaiia. Research data is found through distributing questionnaires and collecting information directly. The distribution of questionnaires was started on July 2008.
2. Characteristics of Respondent
The questionnaire has been distributed to l 00 respondents of students in the economic faculty that are divided in four majors (Management, Accounting, International Relations and Economic Development) as a representative of the economic faculty in this research. As shown in エィセ@
As shown on the table 4.2 above, the year of study of respondents in this research is from the year 2004 to 2007.
b. Present mobile phone
Chart4.3
Present Mobile Phone Brand
Sony Ericsson
23%
4%
okia
67%
B. Validity and Reliability Test
1. Validity Test
Tabel 4.3
Pre Test of the effect Product Attribute, Price and Marketing Communication toward Perceived Quality
Corrected Item Cronbach's
Variable Questions -Total Alpha if Item Explanation
Correlation Deleted
Per QI 0.321 0.396 Valid
Perceived Quality Per Q2 0.132 0.539 Valid
(Y)
Per Q3 0.450 0.213 ValidPer Q4 0.261 0.434 Valid
Pro Attl 0.594 0.746 Valid
Pro Att2 0.363 0.786 Valid
Pro Att3 0.675 0.733 Valid .
Product Attribute Pro Att4 0.51 0.761 Valid
(XI) Pro Att5 0.634 0.742 Valid
Pro Att6 0.588 0.748 Valid
Pro Att7 0.432 0.774 Valid
Pro Att8 0.129 0.809 Valid
Price! 0.568 0.769 Valid
Price (X2) Price2 0.712 0.684 Valid
Price3 0.629 0.727 Valid
Price4 0.525 0.774 Valid
Mar Comm! 0.435 0.788 Valid
Mar Comm2 0.39 0.792 Valid
Mar Comm3 0.503 0.781 Valid
Mar Comm4 0.561 0.775 Valid
Marketing Mar Comm5 0.407 0.79 Valid
Communication Mar Comm6 0.438 0.789 Valid
(X3)
Mar Comm? 0.446 0.787 Valid
Mar Comm8 0.67 0.76 Valid
Mar Comm9 0.285 0.803 Valid
Mar CommlO 0.478 0.783 Valid
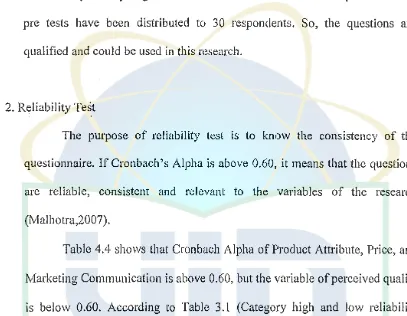
Table (4.3) shows that all of the questions are valid and reliable. This is shown by no any negative correlations on the score of the questions. The pre tests have been distributed to 30 respondents. So, the questions are qualified and could be used in this research.
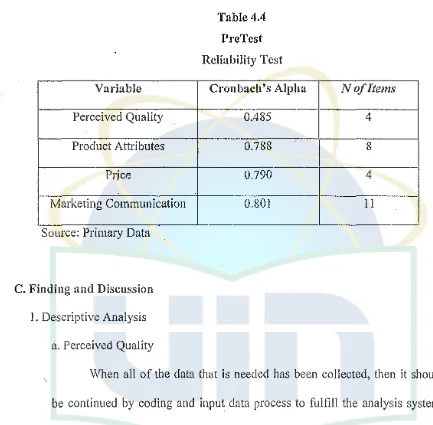
2. Reliability Test
[image:54.595.75.482.202.518.2]The purpose of reliability test is to know the consistency of the questionnaire. If Cronbach's Alpha is above 0.60, it means that the questions are reliable, consistent and relevant to the variables of the research (Malhotra,2007).
Variable Perceived Quality Product Attributes
Price
Marketing Communication Source: Primary Data
C. Finding and Discussion I. Descriptive Analysis
[image:55.595.47.480.138.563.2]a. Perceived Quality
Table 4.4 Pre Test Reliability Test
Cronbach 's Alpha 0.485 0.788 0.790 0.801
Nofltems 4 8 4 11
SD D N I
Where:
1.8 2.6 3.4
Score I- 1.8 =Strongly Disagree (SD) Score 1.8 - 2.6 =Disagree (D) Score 2.6 - 3.4 =Neutral (N) Score 3.4 - 4.2 =Agree (A)
Score 4.2 - 5 =Strongly Agree (SA)
A SA
4.2 5
a. Perceived Quality
Table 4.5
Mean
Indicators (n
=
100) SD D N A SA TotalI am using a good quality of
GSM Mobile phone 4.02 2% 2% 17% 50% 29% 100
Product attribute affects me in
perceiving the quality of a 3.93 0 8% 16% 49% 27% 100
mobile phone
Price affects me in perceiving
the quality of a mobile phone 3.75 1% 15% 15% 46% 23% 100 Marketing Communication
affects me in perceiving the 3.57 0 17% 18% 56% 9% 100 quality of a mobile phone
Total 3.81
[image:57.595.49.475.173.527.2]b. Product Attributes
Table 4.6 Mean
Indicators (n = 100) SD D N A SA Total
Durability of a mobile phone
affects me in perceiving its quality 3.72 2% 12% 17% 50% 19% 100 Brand name of mobile phone
affects me in perceiving its quality 3.77 3% 11% 17% 44% 25% 100 Variation of mobile phone affects
me in perceiving its quality 3 4% 31% 33% 25% 7% 100
Colors of mobile phone affects me
in perceiving its quality 2.94 6% 34% 28% 24% 8% 100
Slogan of mobile phone affects me
in perceiving its quality 2.75 8% 36% 33% 19% 4% 100
Design of mobile phone affects me
in perceiving its quality 2.84 8% 29% 38% 21% 4% 100
Feature of mobile phone affects
me in perceiving its quality 3.84 0 11% 18% 47% 24% 100
Sound of mobile phone affects me
in perceiving its quality 4.21 0 2% 12% 49% 37% 100
Total 3.38
me in perceiving its quality is 3, Colors of mobile phone affects me in perceiving its quality is 2.94, Slogan of mobile phone affects me in perceiving its quality is 2.75, Design of mobile phone affects me in perceiving its quality Feature of mobile phone affects me in perceiving its quality is 3.84 and Sound of mobile phone affects me in perceiving its quality is 4.21. Gitosudarmo (2000) said that product attributes is a component characteristics of product that might fulfill. the need and desire of customer expectation ..
c. Price
Tablc4.7 Mean
Indicators (n = 100) SD D N A SA Total
Difference price between new
and second mobile phone affects 3.82 3% 13% 14% 39% 31% 100
me in perceiving its quality Promotion price of a mobile
phone affects me in perceiving 3.44 1% 21% 23% 43% 12% 100 its quality
Low and high price of a mobile
phone affects me perceiving its 3.67 1% 12% 24% 45% 18% 100 quality
Reselling Price of a mobile
phone affects me in perceiving 3.71 1% 7% 23% 58% 11% 100 its quality
d. Marketing Communication
Table 4.8
-Mc au
Indicators (11=100)
SD
D NA
SA
Total
Advertising affects me in perceiving
quality of mobile phone 3.47 1% 19% 26% 40% 14% 100 Marketing through email affects me
in perceiving quality of mobile 2.73 6% 36% 42% 11% 5% 100 phope
Radio advertisement affects me in
perceiving quality of mobile phone 2.92 4% 32% 37% 22% 5% 100
-Printed Advertisement affects me in
perceiving quality of mobile phone 3.63 0 12% 27% 47% 14% 100 Marketing through websites affects
me in perceiving quality of mobile 3.19 1% 19% 48% 24% 8% 100 phone
E-Commerce affects me in
perceiving quality of mobile phone 3.17 0 22% 44% 29% 5% -100 Dummy product affects me in
perceiving quality of mobile phone 3.46 1% 14% 34% 40% 11% 100
·
-Sponsorship Programs affects me in
perceiving quality of mobile phone 3.23 1 セセ@ 26% 3070 35% 8% 100 Music concert program affects me in
6%
perceiving quality of mobile phone 2.79 35% 39% 14% 6% 100 Launching program affects me in
perceiving quality of mobile phone 3.58 3o/o 8% 30% 46% 13% 100
-Personal selling affects me in
perceiving quality of mobile phone 3.24 3% 20% 31% 42% 4% 100
The total mean of marketing communication is 3.21. Following to the Likert Scale above, its shows that respondents of this research are tend to "agree". The indicators show that almost' all of the respondents agreed. It's shown セゥェᄋ@
t'..<C
r,;;swers shown below.D. Classical Assumption Test I. Autocorrelation
Table 4.9 Durbin Watson
Durbin Watson Conclusion
Less than 1, 10 Autocorrelation available 1,10 and 1,54 Without conclusion
1,55 and 2,46 No Autocorrelation available 1,46 and 2,90 Without conclusion
More than 2,91 Autocorrelation available Source: Muhammad Firdaus (2004: 101)
Autocorrelation test in the ce1iain model is aimed to know the availability of correlations between disturbance variable ( e1) in the previous period ( e1•1).
Autocorrelation test can be made by using Durbin Watson Test. Table 4.10
Autocorrelation Test Model Summarl Model Durbin-Watson
イMセセMKMセセセセMMMMセ@
1 2.058
GMMセセMGMセセセセMMセMM
a. Predictor (Constant): Pro Att, Price, Mar Comm b. Dependent Variable: Perceived Quality
tolerance not less than 0, 1. Hence, the multiple linear regressions are free from multikolinearitas and can be used in the research.
c. Heteroskesdastisity
Graphic 4.1
Scatterplot
Dependent Variable: Per_ Q
4
0
0
0
·3
0 0
0 Oo
Q)
<ll>l 0
0
°
0 0°
0Oo
0
0
0
0
0
Oo
0
0
Regression Standardized Predicted Value
0
2 3
and below or around 0 number and did not formed specific pattern. Hence it can be conclude as the regression model did not have any serious problem. In the other words that residual variance model from one observation to other observation is constant or homokedastisitas. This finding shows that multiple regression model is suitable to be used in this research.
d. Normality Data
The purpose of normality test is to examine the regression model, there is any hampered variable or residual that has normal distribution. To find the residual normality, could be through graphic of histogram that compared between the observations data with distribution that approach normality distribution. Basic of decision making are;
I. If the data spreads around diagonal line and follow ·the direction of diagonal line or the histogram graphic show pattern of normality distribution, then, the regression model does not meet the normality assumption.
i;'
g 15
,
"
e
u. 10 Graphic 4.2 Histogram Dependent Variable: Per_QMaJn"7.17E-16 Std. Dw. BPNセXU@
N" 100
セ@ セ@ 4 ·1 0
Rogresslon Standardized Residua!
Graphic 4.3
Normal pセp@ Plot of Regression Standardized Residual Dependent Variable: Per_Q
L O > - , - - - . , .
0.8
.0
e
0.E 0.6
,
() "Oii
0.4•
0.
"
w
0.2
0.0 0.2 0.4 0.6 0.0 LO
From graphic (4.2) above, show that symmetries histogram did not skewed to left or right side. And graphic ( 4.3), shows the spots of normality plots spreading around diagonal and it means has normal distribution. According to the results of the autocorrelation, multocolliearity, heterocsidisty and normality test, the requirements have been fulfilled to continue to the regression test.
E. Multiple Linear· Regressions
1. Descriptive Statistics and Correlations a. Descriptive Statistics
Descriptive statistic shows the score of mean and standard deviation of the variables product attribute, price, marketing communication (independent variable) and perceived quality (dependent variable).
[image:67.595.63.518.187.696.2]Per-Q Pro Att Price
Table 4.12 Descriptive Statistics
Std. Mean Deviation
15.27 2.269 27.07 4.770 14.64 2.809 Mar Comm 35.41 6.222
--N
-100
-100
--100 100
From table (4.12) above, shows that the total mean of Perceived quality is 15.27 and standard deviation is 2.269. Total mean of prodtict attribute is 27.07 and standard deviation 4.770. The total mean of Price is
14.64 and standard deviation 2.809. The total mean of marketing communication is 35.41 and standard deviation is 6.222.
[image:68.595.53.474.195.530.2]b. Correlations
Table 4.13 Correlations
Per Q Pro Att Price Mar Comm
Per Q l.000 0.513 0.5JO 0.379
Person Correlation Pro Att 0.513 l.000 0.466 0.644
Price 0.5JO 0.466 1.000 0.409
Mar Comm 0.379 0.644 0.409 l.000
Per Q .000 .000 .000
Sig. ( J tailed) Pro Att .000 .000 .000
Price .000 .000 .000
Mar Comm .000 .000 .000
Per 0 JOO JOO
I
100 100N Pro Att JOO JOO JOO 100
Price 100 100 100 100
Mar Comm 100 100 100 100
2. Similarity of Multiple Linear Regressions
Table 4.14
Result of Multiple Regressions Coefficients"
Model Unstandardized
Coefficient
B Std.
Error I .(Constant) 6.571 1.267
Pro att 0.162 0.053
Price 0.277 0.076
MarComm 0.007 0.040
According to the Table 4.14 above obtained the similarities of linear regression as follows:
y = 6.571
+ 0.162X1 + 0.277X2 +
0.00'7 X3 + EWhere:
Y =Perceived Quality X1 =Product Attribute
X2 =Price
Xi= Marketing Communication
The result above will be interpreted if variable Product Attributes (X1) , variable price (X2) and Marketing Communication (Xi) is constant therefore
a. The variable of Product Attributes has positive effect to form the perceived quality with coefficient regression about 0.162. It means, if variable product attributes raise 1 unit hence Perceived Quality (Y) will increase 0. I 62.
b. The variable of Price has positive effect to form the perceived quality with coefficient regression about 0.277. It means that if variable product attributes raise I unit hence Perceived Quality (Y) will increase 0.277. c. The variable of Marketing Communication has positive effect to form the
perceived quality with coefficient regression about 0.007. it means, if variable product attributes raise I unit hence Perceived Quality (Y) will increase 0 .007.
2. Coefficient Determination (R2)
Coefficient Determination (R2) test is show how strong the ability to
[image:70.595.75.482.191.513.2]Table 4.15
Coefficient Determination (R2)
Model Summary
Model Adjusted R
R RSqnare Square
1 .598° .357 .337
a. Predictors: (Constant), Attribute, price, marketing b. Dependent Variable: perceived quality
Frorri Table 4.15, the adjusted R2 is .337 or 33. 7%. This means, only 33.7% independent variable; Product Attribute (X\ Price (X\ Marketing Communication (X3) affects dependent variable; Perceived Quality (Y). The
score of adjusted R square is also called as coefficient determination. The remaining is 66.3 that explained by other unknown factors or variables that excluded in this research.
3. F Test
Table 4.16
FTest
ANOVAb
Sum of Mean
Model Squares df Square F Sig."
Regression
182.197
,, .)60.732
17.802
000.
Residual
327.513
96
3.412
Total
509.710
99
ANO VA test will bear F test around 16.382 with level of significant is 0.000. because the number of probability is 0.000 < 0.05 therefore Ho rejected and Ha accepted and can be concluded third varhble X1 (Product Attribute), X2
(Price) and Xi (Marketing Communication ) in the same condition (simultaneously) effected to the Perceived Quality (Y).
Beside by comparing F test with F table with standard error 5% and degree of freedom (df) 1=3 (4-1) and (df) 3 = 96 (100-4) therefore obtained F
table = 2.76. the score of F test is 17.802 > F table 2.76 therefore H0 rejected
and Ha accepted, hence the conclusion of third variables; pイッゥZ[セGN@ .\t:;·ibutes (X1), Price (X2) and marketing communication (Xi) simultaneously have been
affected towards Perceived Quality(Y).
4. T Test
[image:72.595.77.482.193.515.2]Table 4.17
Coefficients"
Model t Sig.
I .(Constant) 5.187 000. Pro att 3.056 003. Price 3.664 000. MarComm 0.172 0.864 a. Dependent Variable: Per_ Q
a. Product Attribute
Table 4.17, shows significant number of variable X1 (Product Attributes)
is 0.0003. The result is .003 < 0.05. Therefore Ho rejected Ha accepted. With standard error 5% and degree of freedom (df)
=
n - total of independent variable=
100 - 3 = 97, the result of T table is 1.671. The value of T test is 3.056 > T table 1.671. Therefore product attribute (Xl1) ofGSM mobile phone user is significantly affect the perceived quality (Y).b. Price
Variable of price (X2) gained significant number .000 < 0.05 therefore Ho rejected and H,accepted. With standard error 5% and degree of freedom (df)
[image:73.595.88.478.66.531.2]The value of T test is 3.664 > T table 1.671. Therefore the conclusion is; of price variable (X2) there are partially (individual) significantly influence the
perceived quality (Y) of GSM mobile phone user. c. Marketing Communication
Then, variable of marketing communication (X3) gained significant
number 0.864 < 0.05. The result ofT table is 1.671. The value ofT test is 0.172
< T table 1.67 L Therefore product attribute (X
3) of GSM mobile phone user isdoes not significantly affect the perceived quality (Y).
F. Multiple Liuear Regression Test (Product Attribute and Price) 1. Similarity of Multiple Linear Regressions
Table 4.18
Result of Multiple Regressions Coefficients"
Model Unstandardized
Coefficient
B
Std.Error
I .(Constant) 6.642 1.192
Pro att 0.168 0.042
Price 0.279 0.074
According to the Table 4.18 above obtained the similarities of linear regression as follows:
Y = 6.642 + O.l68X1 + 0.279Xz + E
Where:
Y =Perceived Quality X1 =Product Attribute X2 =Price
The result above will be interpreted if variable Product Attributes (X1),
and variable price (X2) is constant therefore Perceived Quality (Y) is 6.642. a. The variable of Product Attributes has positive effect to form the
variable product attributes raise I unit hence Perceived Quality (Y) will increase 0.168.
b. The variable of Price has positive effect to form the perceived quality with coefficient regression about 0.279. It means that if variable product attributes raise 1 unit hence Perceived Quality (Y) will increase 0.279 ..
2. Coefficient Determination (R2)
Coefficient Determination (R2) test is show how strong the ability to
explains the variation of dependent variables. The value of R2 is between the
figures of 0 to 1. If the value of R2 is low, means the ability of independent variable that explained the variation of dependent variable is limited (weak). But, if value ofR2 approaching figure !, means independent variables offer all of the necessity information to predict dependent variables (Ghozali,2006). ·
Table 4.19
Coefficient Determinlltion (R2)
Model Summary
Model Adjusted R
R RSquare Square
1 .598a .357 .344
[image:76.595.77.476.201.647.2]From Table 4.19, it is shown that the adjusted R2 is .344 or 34.4%. This means that only 34.4% of the independent variable; Product Attribute (X\ and Price (X2) affects the dependent variable; Perceived Quality (Y).
The score of adjusted R square is also called as coefficient determination. The remaining 65.6% is explained by other unknown factors or variables that are excluded in this research.
[image:77.595.71.524.38.655.2]3. F Test
Table 4.20 FTest ANOVAb
Sum of Mean
Model Squares df Square F Sig.•
Regression 182.096 2 91.048 26.958 000.
Residual 327.614 97 3.377
Total 509.710 99
a. Predictor: (Constant), Attribute, Pnce b. Dependent Variable: Perceived Quality
ANOVA test will bear F test around 16.382 with level of significant is 0.000. Because the number of probability is 0.000 < 0.05 therefore Ho is rejected and
Ha
is accepted and can be concluded third variable Product attribute (X1), and Price (X2) in the same condition (simultaneously) effectedBeside by comparing F test with F table with standard error 5% and degree of freedom (df) I= 2 (3-1) and (df) 2 = 97 (100-3) therefore obtained F table = 3.15. the score of F test is 26.958 > F table 3.15 therefore H0
rejected and Ha accepted, hence the conclusion of third variables; Product Attributes (X1) and Price (X2) simultaneously have been affected towards
Perceived Quality(Y). 4. T Test
[image:78.595.55.476.222.689.2]According Bhuono Theories (2005) If t test > t table therefore Ho rejected and Ha accepted, that means independent variable partially as influence significantly towards dependent variable. If t test < t table therefore Ho accepted and Ho rejected, that means independent variable partially has nci significantly affect towards dependent variable. Level of significance use amount 5% or (a)= 0.05.
Table 4.21 Coefficients•
Model t Sig.
I .(Constant) 5.574 000. Pro att - 3.831 000. Price 3.760 000.
a. Product Attribute
Table 4.21, shows significant number of variable X1 (Product Attributes)
is 0.000. The result is .000 < 0.05. Therefore Ho rejected Ha accepted. With standard error 5% and degree of freedom (df) = n - total of independent variable = 100 - 2 = 98, the result of T table is 1.671. The value of T test is 3.831 > T table 1.671. Therefore product attribute (X11) of GSM mobile
phone user is· significantly affect the perceived quality (Y). b. Price
Variable of price (X2) gained significant nrnnber .000 < 0,05 therefore
0 Table 4.22
Comparison of regression test score
First Test Second Test
- · Regression (Product Attribute,
Sig. Sig.
Test Price and (Product Attribute
Marketing and Price)
Communication)
R1 0.337
-
0.344-F 17.802 000. 26.958 000.
T Pro Att 3.056 000. 3.831 000.
Price 3.664 003. 3.760 000.
Mar Comm 0.172 0.864
-
-According to second regression test above, shows that product attribute (XI) and Price (X2) has significantly effect to perceived quality, and also the value has increased (the score is higher than first examination). Comparison
'
[image:80.595.50.471.172.602.2]G.
Final
AnalysisTable4.23
Final
AnalysisVariables Correlation Affects to p」セイ」・ゥカ・、@ Hypothesis
Qualitv Test
Product Attribute
Product Product Attribute significantly affected Ho Attribute correlated to customer in perceiving the Rejected
.Perceived Quality quality of GSM mobile phone
Price significantly affected
Price Price correlated to customer in perceiving the Ho Perceived Quality quality of GSM mobile Rejected
phone
Marketing Marketing Communication significantly does not Marketing Communication
affected customer in Ho Communication col1'elated to
perceiving the quality of Accepted Perceived Quality
A. Conclusion
CHAPTERV
CONCLUSION AND IMPLICATION
According to the analysis done in this research, the following conclusions may be deduced:
I. The variable. of product attribute has significant effect on perceived quality of mobile phone GSM users.
2. The variable of price has significant effect on perceived quality of mobile phone GSM users.
3. The variable of marketing communication has no significant effect on perceived quality of mobile phone GSM users.
4. The variables of product attribute, price and marketing communication in simultaneously has significant effect on perceived quality. The regression test shows;
• Product attribute, Price and Marketing Communication has affected to perceived quality. The adjusted R square shows that 31.8% of Product Attribute
X
1, PriceX
2 and Marketing CommunicationX
3 affected to the• The mean score of each variable are not equal. The ANOVA test shows that the sum ofF is 16.382 which are greaterthan its critical value of2.76,. so the H02 is rejected and accept HA2. The scores are not the same in each of the three ratings groups. It is likely that Product Attribute, Price and Marketing Communication contribute to Perceived Quality.
• There is no effect between Marketing Communication and Perceived Quality (0.121 < J.671), but these studies reject H03 and accept HA3 for
Product Attribute and Price (2.606 and 4.209 > 1.67 l ).
After the first test has been completed, it has been proven that the marketing communication variable has influence over perceived quality. After secondary testing, it is shown that there is an increase in the value of influence of the product attributes and price variable towards perceived quality.
These study shows that product attribute and price factor have significant effect on consumer perceived quality. It means that product attribute and price could be a consideration to send a message of quality to the mobile phone users. If a customer has good perception to products, it could affect their satisfaction and purchasing intention of customer. So, product attribute and price are 1,ood strategy to create consumer perceived quality.
B. Implications
I. These study shows that product attribute and price factor have significant effect on consumer perceived quality. It means that product attribute and price could be a consideration to send a message of quality to the mobile phone users. If customers have good perception to a product, it could affect their satisfaction and purchasing intention of customer. So, product attri