1 Keywords: indoor wave propagation model, obstacles.
Abstract
This paper presents the modeling of indoor wave propagation from 1 GHz to 10 GHz. Several obstacles such as partition, whiteboard, and door have been tested and measured their losses compare to line of sight. Horn antennas have been used as transmitter and receiver. An average attenuation between of this obstacle between 1.5 dB to 3.0 dB has been observed. Prediction model for this indoor propagation has been presented using suitable software. Finally, results, discussion, conclusions and further work are given.
1
Introduction
Nowadays, there has been considerable interest in propagation prediction for indoor environments. Indoor propagation prediction is becoming very useful to mobile operators that provide services in large cities, where many subscribers demanding that coverage be provide within buildings, car park, office and etc. Path loses into building are influenced by the building structure and indoor furniture arrangement. All because of this reason, with the high subscribers and also extremely demand from them within the large cities, hence, performing accurate indoor propagation in range 1 GHz to 10 GHz.
Some authors such as previously investigation, two approaches have been proposed. In one approach, propagation models related to those for describing free space propagation are empirically or statistically fitted to measurement data [1]. Prediction results can be computed quickly and the resulting models are generally straightforward to apply. However, a good result will be
obtained when the measurement is in condition good condition. All parameters have been taken such as cable losses, antenna losses and etc. In the alternative, before measure the propagation, all the parameters must be considered.
In the basic of propagation, basic mechanisms of wave propagation are attributed to reflection, diffraction and scattering. All three of these phenomenon cause radio signal distortions and give rise to signal fades, as well as additional signal propagation losses. For indoor propagation, the situation is even worse. Some obstacle will absorb the signal or some obstacle will reflect the signal. Many cases can relate when the wave propagate through the obstacle. In this paper, signal transmit directly from transmitter to the receiver have been measured. The obstacle placed at the center between transmitter and receiver to ensure the signal penetrates the obstacle.
2 Radio Propagation
A radio propagation model, also known as the Radio Wave Propagation Model or the Radio Frequency Propagation Model, is a characterization of radio wave propagation as usually developed to predict the behavior of propagation for all similar links under similar constraints. Created with the goal of formalizing the way radio waves are propagated from one place to another, such models typically predict the
As the path loss encountered along any radio link serves as the dominant factor for characterization of propagation for the link, radio propagation models typically focus on realization of the path loss with the auxiliary task of
Modeling of Indoor Wave Propagation Models
from 1 G Hz to 10 G Hz
Othman A. R, Hamidon A. H, Wasli C, Mustaffa M. F, Ting J. T. H
Faculty of Electronic & Computer Engineering Universiti Teknikal Malaysia Melaka (UTeM)
Locked Bag 1200, Hang Tuah Jaya, 75450 Ayer Keroh, Melaka,
Malaysia
2 predicting the area of coverage for a transmitter or modeling the distribution of signals over different regions. Because each individual telecommunication link has to encounter different terrain, path, obstructions, atmospheric conditions and other phenomena, it is intractable to formulate the exact loss for all telecommunication systems in a single mathematical equation. As a result, different models exist for different types of radio links under different conditions. The models rely on computing the median path loss for a link under a certain probability that the considered conditions will occur.
3 Obstructed Path Loss
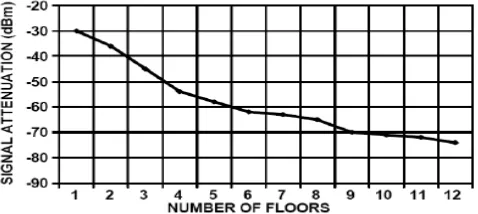
Figure 1 shows that the propagation losses between floors begin to diminish with increasing separation of floors non-linearly. The attenuation becomes less per floor as the number of floors increases. This phenomenon is thought to be caused by diffraction of the radio waves along side of a building as the radio waves penetrate the building’s windows.
Figure 1: Signal attenuation against number of floor Also, a variety of different indoor configurations can be categorized for buildings with enclosed offices, or office spaces consisting of a mix of cubicles and enclosed rooms. Examples of attenuation through obstacles for various materials are shown in the table below. Indoor path loss has been shown to be exponential as shown in Table 1. In specific cases the models can show deterministic limits. However, in majority of the cases the obstructed path loss is determined through empirical means followed by corresponding refinements to the mathematical model.
Table 1: 2.4 GHz Signal Attenuation
4 Free Path Loss
Fundamental to indoor path loss analysis is the free space loss. If the transmitting antenna were ideally a radiating point source in space, the propagated surface wave front will
exit the point source in a spherical pattern as shown in Figure 2. The spherical signal energy reduces as the square of the distance. Free Space Path Loss (FSPL) is defined as: Spherical radiating wave front
Figure 2: Free Space Radiating Point Source
(1) Where d is distance in meters between the transmitter and
receiver, and λ (lambda) is the wavelength in meters. This
equation also implies that as the frequency increases the loss will be proportionally higher. Relating frequency to wavelength:
(2) Where c is the speed of light, c = 3x10⁸ m/s, and frequency, f = cycles per second. The wavelength of the 2.1 GHz sinusoid is:
λ=0.125 meters, λ=12.5 centimetres or λ=4.92 inches.
Free space loss defined in decibels is:
Free Space Loss = 10×log (FSPL) (3) A convenient way to express free space path loss is in terms o
(4)
(5)
(6)
(7) Where the units are as before.
5 ITU Model for Indoor Attenuation
3 that estimates th inside a building delimited by walls of any form. Suitable for appliances designed for indoor use, this model approximates the tota experience. This model is applicable to only the indoor environments. Typically, such appliances use the lower microwave bands around 2.4 GHz.
(8)
Where L = the tota
f = (MHz).
d = Distance. Un
N = The distance power loss coefficient.
n = Number of floors between the transmitter and receiver.
Pf(n) = the floor loss penetration factor.
6 Measurement System
Radio propagation models are empirical in nature, which means, they are developed based on large collections of data collected for the specific scenario. For any model, the collection of data has to be sufficiently large to obtain good result. This paper investigated which wave propagates by sweeping the frequency from 1 GHz till 10 GHz. The distance keeps constant 1.5m from transmitter to receiver. Figure 3 shows the LOS test.
Figure 3: Line of Sight Test
Signal generator and spectrum analyzer also have been used to supply the signal and observe the result. 30m cable used to connect the transmitter to the signal generator and receiver to the spectrum analyzer. Height of both antennas has been setup at 1.5m to ensure both antennas have the same height. Several obstacle has been measured their losses such as whiteboard, partition and door. Figure 4 shows the measure test of the obstacle.
Figure 4: Measurement of the obstacle
7 Results and Discussions
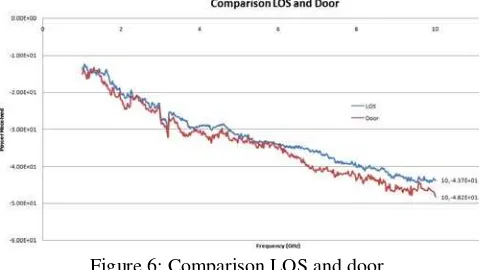
Data was collected after the results obtained, and 400 data was collected each sample. Some obstacle has been measured to get the comparison power received and LOS at the receiver. There’s three obstacle has been measured which is whiteboard, door and partition. Figure 50 shows the comparison LOS data and whiteboard. From overall graph, can seen that have gap between LOS and obstacle which is it prove that signal attenuate when penetrate obstacle. Figure 6 and Figure7 shows the comparison LOS and door and also comparison LOS and partition
Figure 5: Comparison LOS and whiteboard
From Figure 5, at 1 GHz, the power for LOS is -13.3 dB and the powers for signal penetrate through whiteboard is -13.6 dB. So, the difference signal power receives both measurement at 1 GHz have no big difference but at 10 GHz, the power receive for LOS is -43.7 dB and the powers for signal penetrate through whiteboard is -46.8 dB. The both power difference at 10 GHz is about 3.1 dB. The average power drop from 1 GHz until 10 GHz is about 31.8 dB. These make sense where the powers drop proportional to the frequencies. From these data obtained, the data were simulated by using suitable software to get the model of the whiteboard.
Figure 6: Comparison LOS and door
4 these data obtained, the data were simulated by using suitable software to get the model of the door.
Figure 7: Comparison LOS and partition
From Figure 7, at 1 GHz, the power for LOS is -13.3 dB and the powers for signal penetrate through partition is -12.6 dB. So, the difference signal power receives both measurement at 1 GHz, have no big difference but at 10 GHz, the power receive for LOS is -43.7 dB and the powers for signal penetrate through whiteboard is -48.5 dB. The both power difference at 10 GHz is about 4.2 dB. The average power drop from 1 GHz until 10 GHz is about 33.15 dB. From these data obtained, the data were simulated by using suitable software to get the model of the door.
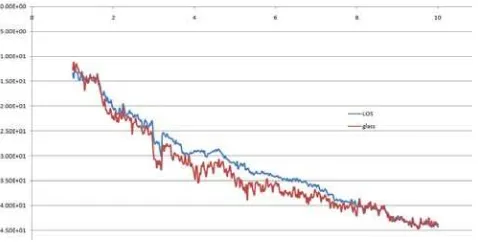
Figure 8 shows the comparison between LOS and attenuation of glass. The shape of the graph similar with others obstacles but starting at almost 8 GHz, both graph overlap each other and if refer to theoretical, the line should not overlap. But if consider environment and surrounding, the graph can overlap each other because of multipath effect from other obstacle in the measure room. From Figure 8, at 1 GHz, the power for LOS is -13.3 dB and the powers for signal penetrate through partition is -12.7 dB. So, the difference signal power receives both measurement at 1 GHz also have no big difference but at 10 GHz, the power receive for LOS is -43.7 dB and the powers for signal penetrate through whiteboard is -44.3 dB. The both power difference at 10 GHz is about 0.5 dB. The average power drop from 1 GHz until 10 GHz is about 31 dB. From these data obtained, the data were simulated by using suitable software to get the model of the door.
From observation from the Figure 5, Figure 6, Figure 7, Figure 8 and Figure 9, estimate at 3 GHz, the power drop suddenly and then it stable back after couple of frequency.
Figure 8: Comparison LOS and glass Table 2 shows the measured signal attenuate.
Whiteboard 3.1 dB
Door in lab room 4.5 dB
Blue partition in office 4.2 dB
Windows glass 0.5 dB
Table 2: Signal Attenuation at 10 GHz
From data obtained from measurement and data was simulated using suitable software, the modeling of indoor propagation wave proposed in room within whiteboard, partition and door was:
The prediction models for indoor propagation prediction were presented. The prediction shows that indoor environment affected the radio wave propagation and signal strength coverage. The various elements of obstacles measured affect radio wave propagation. However, the propagation path loss is the dominant loss and is always happen between transmitter and receiver.
References
[1] Zhong Ji, Bin-Hong Li, Hao-Xing Wang,"A New Indoor Ray-Tracing Propagation Prediction Model" Computational Electromagnetics and Its Applications, (ICCEA '99) 1999 International Conference on, Vol., Iss., 1999
[2] Theodore, S R, "Wireless Communications Principles and Practice", Press/Prentice Hall PTR, Upper Saddle River, New Jersey, 1996.
[3] John C. Stein, Part I and II. “Indoor Radio WLAN Performance”, “Range performance in a dense office environment”, Intersil, 1997.
[4]