Design and
Dynamics
System Identification of Railway Trains
Pantograph for Active Pantograph Simulation*
Mohd Azman ABDULLAH**, Yohei MICHITSUJI***, Masao NAGAI****
and Gentiane VENTURE****
**Faculty of Mechanical Engineering, Universiti Teknikal Malaysia Melaka, Hang Tuah Jaya, 76100, Durian Tunggal, Melaka, Malaysia
E-mail: [email protected]
***Department of Mechanical Engineering, Ibaraki University 4-12-1 Nakanarusawa-cho, Hitachi-shi, Ibaraki, 316-8511, Japan
****Department of Mechanical Systems Engineering, Tokyo University of Agriculture and Technology, 2-24-16 Naka-cho, Koganei-shi, Tokyo, 184-8588, Japan
Abstract
High performance of the contact wire and pantograph dynamic interaction is required in the operation of high speed railway vehicles. Due to the constraint of field test, simulation and lab experiment procedures are performable to verify the interaction. Such simulation needs accurate modeling of the response of the pantograph for the consistency in prediction and control. A simple system identification of the pantograph is executed based on the lab experimental data using commercial software and least squares method. The validation of the procedure is performed through comparison between extended experimental data and numerical simulations of the pantograph system. Further analysis is by applying active pantograph control on the system by simulation. The results show availability of the design for active pantograph system.
Key words: System Identification, Active Control, Pantograph, Regression
1. Introduction
In the operation of high speed railway vehicles, high performance of contact wire and pantograph dynamic interaction is required. Performance analysis of pantograph during actual field test is compelling and reliable. However, performing such analysis requires in-place monitoring, excessive cost, detail scheduling, and perhaps affects the daily train operations. Due to these constraints, most researchers prefer simulation, lab experiment and scale model representation to meet their objectives. All these methods are performable and need to be validated before the results can be accepted. In the simulation of contact wire and pantograph interaction, accurate modeling of the response of the pantograph is essential for the consistency in its prediction and control. For the purpose of active pantograph, active control approaches by simulation for contact wire and pantograph interactions have been studied previously in order to control the contact loses, one of the pantograph performances (1)(2). Nevertheless, the pantograph model used in the study has not been validated and it focuses on the control evaluations.
Dynamics
pan-head elasticity characteristic (5). The elasticity analysis is focused on the pan-head rather than the overall pantograph model which is modeled by three lumped mass. Flexible multi-body modeling method also has been used to model the pantograph (6)(7). Dealing with multi-body modeling consumes a lot of computers memory for simulation analysis and difficult to be performed in real-time. Besides, validation of such procedures is complex.
In this study a system identification method of the pantograph is executed based on the lab experimental data using commercial software and least squares method. The validation of the procedure is performed through comparison between extended experimental data and numerical simulations of the pantograph system. Further analysis is by applying active pantograph control on the system by simulation. The results show availability of the design for active pantograph system.
2. Methodology
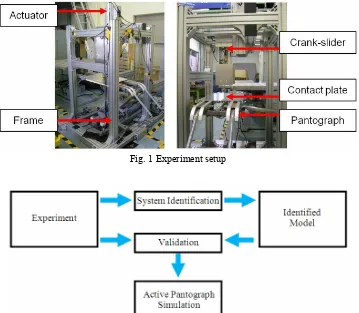
As shown in Fig. 1, the experiment setup consists of aluminum frames for rigidity, a asymmetrical z-shape pantograph unit, a single axis electric actuator for force excitation, a crank-slider equipment, load sensor and laser displacement sensors for data collection. Low frequency sinusoidal input is applied through the actuator based on the constraint of the actuator capability. Crank-slider equipment is using high speed electric motor to produce high frequency sinusoidal input to the contact plate. Sensors are mounted on the side part of the actuator to record the displacement of the contact plate, pan head and support. The sinusoidal input data and the displacement output data are captured in relation with time. The time history data is then analyzed using least squares method to produce identified model based on mathematical algorithms. The solutions of parameters at the highest confidence level will be used for validation. Figure 2 shows the flow of the identification process.
Fig. 1 Experiment setup
Design and
Dynamics
3. Identification Technique
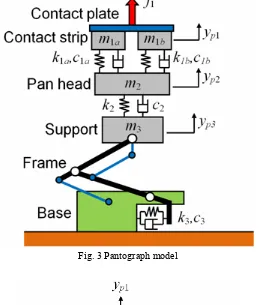
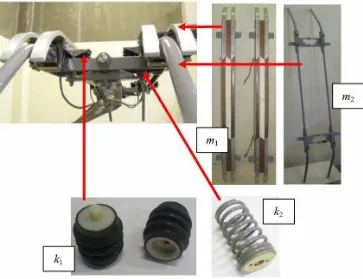
In control strategy, the simpler the model is the better in achieving the control objective. Figure 3 shows the pantograph model for simulation analysis. Since the contact strips and contact plate are directly attached to the actuator, pantograph model is reduced to 2DOF as shown by Fig. 4. Some parameters of the pantograph are directly measured when the pantograph is dissembled (Fig. 5). The measured parameters are, k1T = 32992 N/m, m2 =
5 kg and k2 = 14544 N/m. Where k1T = k1a + k1b.
Fig. 3 Pantograph model
Dynamics
Fig. 5 Directly measured parameters
The equations of motions for the reduced pantograph model are shown by,
(
2 1) (
2 2 3)
1T yp yp c yp yp
c − + −
(
3 2) (
1 1 2)
2 2
2yp k yp yp kT yp yp
m + − + −
−
= (1)
(
3 2) (
2 2 3)
2 3 3 3 3 3
3yp c yp k yp c yp yp k yp yp
m + + + − = − (2)
where, 1/c1T = 1/c1a + 1/c1b. In the form of matrix, Eqn. (1) and (2) become,
Y
AX= (3)
where, W, X and Y are,
− − − = 3 3 3 2 3 3 2 1 2 0 0 0 0 p p p p p p p p p y y y y y y y y y
A (4)
[
c1T c2 m3 c3 k3]
=
X (5)
(
) (
)
(
)
− − + − + − = 3 2 2 2 1 1 2 3 2 2 p p p p T p p p y y k y y k y y k y mDesign and
Dynamics
The unknown parameters in X are determined using linear least squares technique (8). The confidence level in using the parameters is determined by the condition number and relative standard deviation (RSD). With the intention of eliminating the delay in determining the velocities and accelerations, three points derivative method is used.
2 1 1 1 1 − − + − − = − − + + i i i i i i i i i t t y y t t y y
y (7)
2 1 1 1 1 − − + − − = − − + + i i i i i i i i i t t y y t t y y y (8)
In order to compare the results from identified model to the experimental results, a fitting performance (Pf, %) (9)(10) analysis of the results is performed.
% 100 1 × − − − = mx x x i f y y y y
P (9)
Where yiis the identified model result, yx is the experimental result and ymx is the mean
or average value of the experimental result. The error between model and experiment result is determined by,
∑
= = n i i T i 1 ε εε (10)
where εi = | yi – yx |.
4. Results
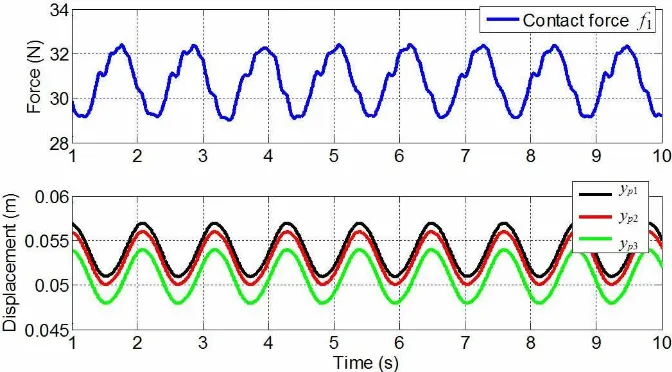
The experiment is performed at different amplitude of displacement; Experiment I (amplitude A1yp1 = 1 mm), Experiment II (amplitude A2yp1 = 2 mm) and Experiment III
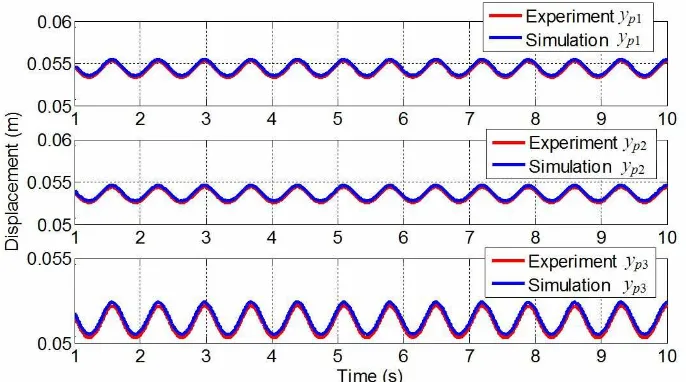
(amplitude A3yp1 = 3 mm). The time historical data of contact force f1, and displacements of
yp1, yp2 and yp3 are shown by Figs. 6 to 8. Table 1 summarizes the experimental results. The
frequency of the data is determined using Finite Fourier Transform. Tables 2 to 4 show the result of pantograph parameters identification results for all experiments. Since the parameters identified in Table 2 gives the lowest condition number with comparatively low RSD, these parameters are used in validation process. The same contact force data from experiment is used in the model and the displacements are compared. Figure 9 to 11 shows the comparison of yp1, yp2 and yp3 between experiment and model. In order to calculate the
Dynamics
Fig. 6 Contact force and displacements results of Experiment I
Fig. 7 Contact force and displacements results of Experiment II
Design and
Dynamics
Table 1 Details of the experimental results
Experiment Data Amplitude Offset Frequency
f1 1.83 N 30.7862 N
yp1 0.99 mm 54.3 mm
yp2 0.99 mm 53.4 mm
I
yp 3 0.97 mm 51.2 mm
1.4219 Hz
f1 2.03 N 30.7913 N
yp1 1.89 mm 54.3 mm
yp2 1.88 mm 53.4 mm
II
yp 3 1.80 mm 51.1 mm
0.91017 Hz
f1 2.23 N 30.7682 N
yp1 2.98 mm 53.9 mm
yp2 2.96 mm 52.9 mm
III
yp 3 2.95 mm 50.9 mm
0.90335 Hz
Table 2 Identified parameters using results of Experimental I
Parameters Value RSD, σ% Condition number
c1T(Ns/m) 12.31 2.8
c2 (Ns/m) 0.11 4.2
m3 (kg) 10.38 15.6
c3 (Ns/m) 50.92 16.3
k3 (N/m) 611.85 102.4
112.46
Table 3 Identified parameters using results of Experimental II
Parameters Value RSD, σ% Condition number
c1T(Ns/m) 12.68 5.5
c2 (Ns/m) 0.31 7.4
m3 (kg) 10.72 20.3
c3 (Ns/m) 51.92 41.6
k3 (N/m) 624.17 155.4
448.00
Table 4 Identified parameters using results of Experimental III
Parameters Value RSD, σ% Condition number
c1T(Ns/m) 13.01 8.4
c2 (Ns/m) 0.74 12.6
m3 (kg) 10.88 29.2
c3 (Ns/m) 52.30 68.1
k3 (N/m) 630.53 188.7
Dynamics
5. Active Pantograph Simulation
The active control for pantograph system is designed based on the interaction of contact wire and pantograph analysis using multi-body dynamic simulation (1)(2). The combination of feedback and feed forward control (fcFBFF) is performed at speeds from 100 to 400 km/h.
In this control approach, the knowledge of contact force (f1) dependency to speed in utilized
in feedback control (fcFB) part with saturation between 0 to 300 N force and dead zone at
nominal force 54 N (f1N). In these feedback control characteristics, the contact force above
300 N will not be used and the contact force at f1N will be treated as 0 N control force and
the contact forces above and below f1N are treat as positive and negative control forces
respectively. The modified interaction flow of contact force and pantograph with combination control system is shown by Fig. 12.
Fig. 9 Comparison results for Experiment I
Design and
Dynamics
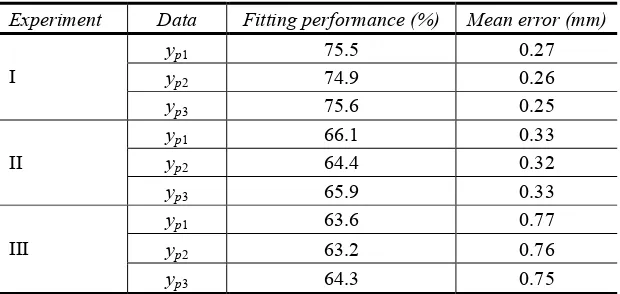
Fig. 11 Comparison results for Experiment III Table 5 Fitting performance and mean error
Experiment Data Fitting performance (%) Mean error (mm)
yp1 75.5 0.27
yp2 74.9 0.26
I
yp3 75.6 0.25
yp1 66.1 0.33
yp2 64.4 0.32
II
yp3 65.9 0.33
yp1 63.6 0.77
yp2 63.2 0.76
III
yp3 64.3 0.75
The sinusoidal control force (fcFF) will be used in the feed forward control part. The
amplitude A is equal to 10 N which is half from the previous research (1). The frequency w is depending on the running speed v, and the phase angle θ is varied and selected based on the contact loss ratio and cost function evaluations.
−
= π θ
s x w A fcFF
2
sin (11)
s v
w=2 (12)
Dynamics
Fig. 12 Contact wire and pantograph interaction flow
% 100
× =
x x
CL o (13)
Where xo is the total distance of contact loss or no contact condition between contact wire
and pantograph.
(
)
∑
− + − ∆
= +
n
i
N i N
i f f f
f t v
CF 1, 1 1, 1 1
2 6 . 3
(14)
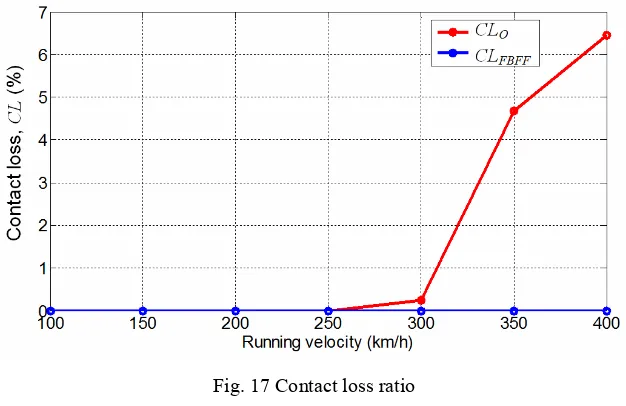
Where n is the number of data sampling, i is the current data and ∆t is the time interval. Figure 13 shows the solution for θ for different v. The solution for phase angle θ is π/6 for all the speeds.
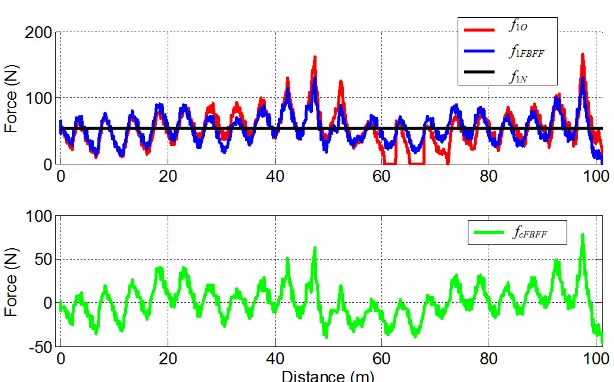
Figures 14 to 16 show the simulation results at speeds 300, 350 and 400 km/h. The contact loss ratio of the simulation is shown by Fig. 17 and the cost function evaluation is shown by Fig. 18. The abbreviations f1O is the contact force without control (red line), f1FBFF
(blue line) is the contact force with control and fcFBFF is the control force (green line). It is
Design and
Dynamics
Fig. 13 Cost function for phase angle
Fig. 14 Simulation at speed 300 km/h
Dynamics
Fig. 16 Simulation at speed 400 km/h
Fig. 17 Contact loss ratio
Design and
Dynamics
6. Conclusion
In this research, the actual pantograph is modeled and reduced to 2DOF ideal system with negligible effects from inertia and dry frictions. The parameters identification of the pantograph is executed based on the lab experimental data using least squares technique. The best parameters for the pantograph model are selected at the lowest value of condition number. The validation of the identified model is performed through comparison between experimental data and numerical simulation results of the pantograph system using the same low frequency sinusoidal input of amplitudes. The agreement between model and experimental data with affirmative fitting performances demonstrates the reliability of the model and system identification procedure. By means of previous contact wire and pantograph interaction model (1)(2), the active pantograph analysis and control by simulation are performed. The proposed control approach has significantly reduced the contact loss at high speed railway vehicle operation. The results demonstrate the availability of the design for active pantograph system.
Since the actual new pantograph parameters are confidential to be disclosed, the identification technique proposed is applicable to identify the parameters values near to the actual. The technique is also appropriate for identifying the parameters of the used pantograph. The parameters are assumed to be changed due to the length of time of application and the conditions of application. This will give benefit for maintenance monitoring and replacement activities.
Acknowledgement
The author (Mohd Azman Abdullah) would like to acknowledge ToyoDenki Seizo K.K. for the pantograph unit sponsorship and the financial support from the Ministry of Higher Education of Malaysia and Universiti Teknikal Malaysia Melaka under the SLAI financial scheme.
References
(1) Abdullah, M. A., Michitsuji, Y., Nagai, M. and Miyajima, N.: Integrated Simulation between Flexible Body of Catenary and Active Control Pantograph for Contact Force Variation Control., Journal of Mechanical Systems for Transportation and Logistics, JSME, 3:1, 166-177(2010).
(2) Abdullah, M. A., Michitsuji, Y., Nagai, M. and Miyajima, N.: Analysis of Contact Force Variation between Contact Wire and Pantograph Based on Multibody Dynamics.,
Journal of Mechanical Systems for Transportation and Logistics, JSME, 3:3, 552-567
(2010).
(3) Usuda, T. and Ikeda, M.: Optimization of Pantograph Parameters Considering the Mechanical Characteristic of Current Collection System (in Japanese), Proc. for 7th
Symposium on Optimization, JSME, No.06-48 (2006).
(4) Resta, F., Facchinetti, A., Collina, A. and Bucca, G.: On the use of Hardware in the Loop Set-up for Pantograph Dynamics Evaluation, Vehicle System Dynamics, 46:1, 1039-1052(2008).
Dynamics
(6) Ambrosio, J., Rauter, F., Pombo, J. and Pereira, M.: A Flexible Multibody Pantograph Model for the Analysis of the Catenary-Pantograph Contact Problem, Proc. for
Multi-body Dynamics 2009, ECCOMAS Thematic Conference, (2009).
(7) Ambrosio, J., Rauter, F., Pombo, J. and Pereira, M.: Effect of the Pantograph Flexibility on the Contact Quality of the Pantograph-Catenary Interface, Proc. for 21st
Int. Symposium on Dynamics of Vehicles on Roads and Tracks (IAVSD’09), (2009).
(8) Venture, G., Ripert, P-J., Khalil, W., Gautier, M. and Bodson, P.: Modeling and Identification of the Passenger Car Dynamics Using Robotics Formalism, IEEE Transactions on Intelligent Transportation Systems, Vol. 7, No. 3, 349-359(2006). (9) Ljung, L.: Matlab & Simulink - System Identification Toolbox, The MathWorks, Inc.,
(2009).