ANALYZING THE ELECTION OF THE BASIC HABITAT
CORAL REEF FISHES BASED ON CORAL LIFEFORMS AT
PASI ISLAND, SELAYAR ISLANDS DISTRICT,
SOUTH SULAWESI
WENDY FADRI ARIANSYAH
GRADUATE SCHOOL
BOGOR AGRICULTURAL UNIVERSITY
BOGOR
I declare that this thesis “Analyzing the Election of the Basic Habitat Coral Reef Fishes Based on Coral Life-forms at Pasi Island, Selayar Islands Distric, South Sulawesi” is my own work and has not been submitted in any form or another degree or diploma at any university or other institution of tertiary education. Source of information derived or quoted from the published or unpublished work of others has been acknowledged in the text and list of references are put at the end of the thesis.
Bogor, September 2010
WENDY FADRI ARIANSYAH. Analyzing the Election of the Basic Habitat Coral Reef Fishes Based on Coral Life-forms at Pasi Island, Selayar Islands District, South Sulawesi. Under direction of SULISTIONO and M. MUKHLIS KAMAL
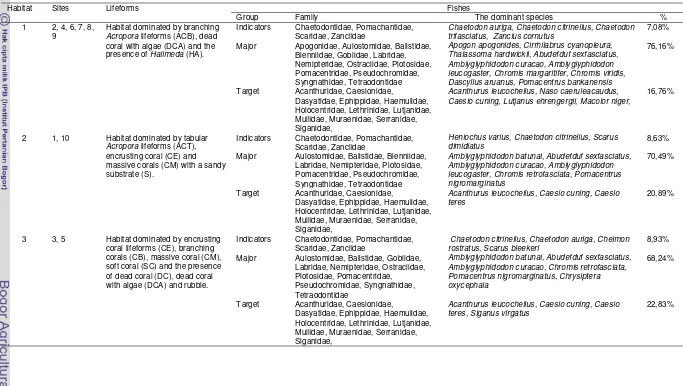
This research was aimed to observe the habitat preference of coral reef fishes on coral life-forms and its association form between them. This study was carried out on Pasi Island from March to April 2010. Ten 5x5 m2 permanent quadrant transect were put on 10 sites laid around the Island from which total 250 photos transect (1x1 m2) were obtained and used to assess the life-forms of benthic community. Acropora branching (ACB) was found dominantly at six sites with 46,09 -89,16% coral cover whereas Acropora tabular (ACT) with 22,87-34,99% coral cover at 3 sites. Coral reef habitat analysis by Bray-Curtis Similarities Index revealed three groups of habitats. In this study, a total of 3.990 individual of fishes were counted representing 135 species belonging 29 families. In term of species richness, Pomacentridae found dominantly 56,39% while Labridae 8,97%, Acanthuridae 5,54%, Chaetodontidae 4,81%, Caesioniidae 4,51% and others 24 families 19,77%. Shannon-wiener diversity index at all sites ranged from 3,49 to 4,13. Sorensen Similarity Index for coral reef fishes exposed 21 groups of fish. Fidelity index exposed Pomacentridae associated with Acropora branching. Habitat dominated by Acropora tabular (ACT), coral encrusting (CE) and coral massive (CM) with sand (S) life-forms were highly preference for Amphiprion akindynos, Pomacanthus imperator, Chaetodon baronessa, Chlorurus sordidus, Pomacanthus sexstriatus. Habitat dominated by coral encrusting (CE), coral branching (CB), coral massive (CM), soft coral (SC) with dead coral (DC), dead coral with algae (DCA) and rubble lifeforms elected by Aeoliscus strigatus, Parupeneus spilurus, Caesio teres, Cirrhilabrus ryukyuensis, Parupeneus barberinus, Siganus virgatus, Cetoscarus bicolour, Amphiprion akindynos, Pomacanthus imperator, Pterocaesio tile, Ptereleotris evides, Rhinomuraena quaesita.
WENDY FADRI ARIANSYAH. Analisis Pemilihan Habitat Spesies Ikan Karang Berdasarkan Bentuk Pertumbuhan Terumbu di Perairan Pulau Pasi, Kabupaten Kepulauan Selayar, Sulawesi Selatan. Dibimbing oleh SULISTIONO dan M. MUKHLIS KAMAL.
Penelitian ini bertujuan untuk mengetahui preferensi habitat ikan-ikan karang pada berbagai bentuk pertumbuhan terumbu serta mengkaji assosiasi diantara keduanya. Penelitian ini dilakukan pada Pulau Pasi pada bulan Maret sampai April 2010. Sepulauh transek kuadrat permanen berukuran 5x5 m2 yang dilengkapi transek kecil berukuran 1 x 1 m2 di dalamnya dipasang sejajar garis pantai di sekelling pulau untuk mendapatkan total 250 foto yang akan digunakan untuk mengamati lifeform komunitas karang. Acropora bercabang (ACB) ditemukan dominan di enam lokasi dengan tutupan karang berkisar antara 46,09 -89,16% sedangkan (ACT) Acropora tabular ditemukan dominan pada 3 lokasi dengan tutupan karang berkisar antara 22,87-34,99%. Terumbu karang dianalisa dengan menggunakan Indeks kesamaan Bray-Curtis dan diperoleh tiga kelompok habitat. Ikan-ikan yang ditemukan pada 10 stasiun pengamatan berjumlah 3.990 ekor yang mewakili 29 famili. Famili yang banyak ditemukan adalah Pomacentridae (56,39%), Labridae (8,97%), Acanthuridae (5,54%), Chaetodontidae (4,81%), Caesionidae (4,51%), dan 24 famili lainnya (19,77%). Ikan-ikan yang ditemukan jika dikelompokkan menurut English et al. (1997), dari 10 stasiun pengamatan ditemukan 135 spesies, 74 spesies merupakan ikan-ikan mayor, 34 spesies merupakan ikan target dan 27 spesies merupakan ikan-ikan indikator. Hasil identifikasi berdasarkan Fishbase (2010) terhadap ikan-ikan-ikan-ikan yang ditemukan di Pulau Pasi ternyata 13,78% ikan merupakan herbivora, 22,56 % adalah karnivora, 31,63% merupakan omnivora, 3,76% merupakan corallivora, 26,04% merupakan planktivora dan 2.23% adalah detritivora. Hasil perhitungan menunjukkan bahwa nilai Indeks Keanekaragaman (H’) berkisar antara 3,49 sampai 4,13, Indeks Keseragaman (E) berkisar antara 0,91 sampai 0,95 dan nilai Dominansi berkisar antara 0,02 sampai 0,04. Perhitungan Indeks Fidelitas (Fij
) menunjukkan bahwa Pomacentridae berasosiasi dengan karang bercabang. Habitat yang didominasi oleh Acropora tabular (ACT), coral encrusting (CE) dan coral massive (CM) dengan substrat berpasir (S) memiliki preferensi yang tinggi bagi Amphiprion akindynos, Pomacanthus imperator, Chaetodon baronessa, Chlorurus sordidus dan Pomacanthus sexstriatus. Habitat yang didominasi oleh coral encrusting (CE), coral branching (CB), coral massive (CM), soft coral (SC) serta adanya dead coral (DC), dead coral with algae (DCA) serta adanya patahan karang (rubble) sangat disukai oleh Aeoliscus strigatus, Parupeneus spilurus, Caesio teres, Cirrhilabrus ryukyuensis, Parupeneus barberinus, Siganus virgatus, Cetoscarus bicolour, Amphiprion akindynos, Pomacanthus imperator, Pterocaesio tile, Ptereleotris evides dan Rhinomuraena quaesita.
Praise and gratitude be to Allah, the Most Gracious and Merciful, without His blessing, I could not have completed my work. This thesis has made as one of the requirement to qualify the graduate school of Bogor Agricultural University with the title “Analyzing the Election of the Basic Habitat Coral Reef Fishes Based on Coral Life-forms at Pasi Island, Selayar Islands Distric, South Sulawesi”.
I especially express my most sincere gratitude to my supervisors Dr. Ir. Sulistiono, M.Sc and Dr. Ir. M. Mukhlis Kamal, M.Sc for coming up with the idea, support, and guidance during finishing my thesis. Many thanks also due to Prof. Dr. Ir. Mennofatria Boer, DEA and Dr. Ir. Ridwan Affandi, DEA for critics and suggestions during thesis examination; the Lecturers and staffs of Study Program of Coastal and Marine Resources Management Science for guidance, support and help during my study period. I also owe my sincere thanks to, Coral Reef Management and Rehabilitation Program phase II, Ministry of Marine Affairs and Fisheries Republic of Indonesia (COREMAP II-MMAF), and Graduate School-Bogor Agricultural University, for giving me opportunity and scholarship.
At the completion of work, I would like to acknowledge the selfless love, care and support by my parents H. Fathul Arifin Manurung and Hj. Muhri Syafridah Chaniago, my wife Kiki Ernawati and my son Sahl Izzan Muhammad Ariansyah, as well as to whole my family. I am also highly thankful to my colleagues in Sandwich Program, for share and togetherness during my study period. I extend my sincere thanks to Regal, Igo, Ralph, Fitri, Ardi, Adi, Ridho, Chimbo and Kenji, for support during my entire research work. Last but not the least, I thank to all individual who have in any way been associated with the completion of this work but have not been mentioned so far.
I realized that this thesis is still not perfect, so that constructive suggestions and criticisms would be welcomed for improvement of this recent work.
Bogor, September 2010
SOUTH SULAWASI
WENDY FADRI ARIANSYAH
A Thesis
As a part of the requirements for achieving degree
Master of Science
In Study Program of Coastal and Marine Resources Management Science
GRADUATE SCHOOL
BOGOR AGRICULTURAL UNIVERSITY
BOGOR
Name : Wendy Fadri Ariansyah
SRN : C252080234
Study Program : Coastal and Marine Resources Management Science
Approved by the advisory board
Acknowledged by
Date of Examination : September 2nd, 2010 Approved on: Supervisor
Dr. Ir. Sulistiono, M.Sc
Co-supervisor
Dr. Ir. M. Mukhlis Kamal, M.Sc
Head of Study Program Dean of Graduate School
© Copyrighted by Bogor Agricultural University (IPB), 2010
Copyright protected by Indonesian Legislation
1. It is prohibited to cite all or part of these thesis without referring to or mentioned the source of information.
a. Citations only permitted for educational purposes, research, scientific writing, report writing, criticl writing or problem review
b. Citations doesn’t disserve to the interests of Bogor Agricultural university
xxi
1.3 Objectives and Benefits ... 3
2 LITERATURE REVIEW ... 5
2.1 Coral Reefs ... 5
2.2.1 Coral Biology ... 5
2.2.2 Limiting Factor for Coral Reef ... 6
2.2.3 Types and Forms of Coral Reefs ... 7
2.2.3 Reefs as Habitat ... 9
2.2 Reef Fishes ... 10
2.2.1 Grouping Reef Fish ... 11
2.3 Interaction between Coral Reef and Reef Fishes ... 14
3 MATERIALS AND METHODS ... 17
3.1 Study Sites ... 17
3.2 Methods and Techniques of Data Collection ... 18
3.3 Data Analysis ... 20
3.3.1 Life forms Coverage ... 20
3.3.2 Simpson Dominance Index (C) Shannon-Wiener Diversity Index (H’), Evenness Index (E) and ... 20
3.3.2.1 Shannon-Wiener Diversity Index (H’) ... 20
3.3.2.2 Evenness Index (E) ... 21
3.3.2.3 Simpson Dominance Index (C) ... 21
3.3.3 Bray-Curtis Similarity Index... 21
3.3.4 Sorensen Similarity Index ... 22
3.3.5 Nodules Analysis, Constancy Index (Cij) and Fidelity Index (Fij) . 22 3.3.6 Principal Component Analysis (PCA)... 23
4 RESULT AND DISCUSSION ... 25 Shannon-Wiener Diversity Index (H’), Evenness Index (E) ... 30
4.3.2 Grouping of Reef Fishes Based on Sorensen Similarity Index 4.3.3 .... 31
Association of Coral Reefs and Reef Fish 4.3.4 Preference of Habitats by Reef Fishes Based on Coral ... 32
Lifeforms ... 43
4.3.5 Reef Fishes Trophic Level at Study Sites ... 44
4.4 Management of Reef Fishes... 48
xxi
5 CONCLUSIONS AND SUGGESTIONS ... 53
5.1 Conclusions ... 53 5.2 Suggesstions ... 53
xxiii
1 The data of physical - chemical parameters at Pasi Island ... 25
2 Percentage of coral lifeforms (in %) from 10 study sites
3 Characteristics of group of habitats in Pasi Island waters
... 27
4 Shannon-Wiener Diversity Index (H’), Evenness Index (E) and Simpson ... 29
Dominance Index (C)
5
... 31
Grouping of reef fish based on habitat
6 Constancy Index (C
... 35
ij) groups of fishes to groups of habitats
7 Fidelity Index (F
... 36
ij) groups of fish species against groups of habitats
8 The fishes were included in the IUCN Red List status at Pasi Island
... 39
xxv
1 Flowchart of the problem formulation ... 3
2 Zooxanthella in the tissues of a coral polyp
3 Darwin’s three stages of atoll formation (Coral reef info 2008
... 6
4 Study sites at Pasi Island
... 8
5 Permanent Quadratic Transect 5 x 5 m
... 17
2
.
6
... 19
Observer's position on the transect
7
... 20
Comparative composition of coral lifeforms
8 Dendrogram grouping of habitats based on Bray-Curtis Similarity Index
... 28
... 28
9 Comparison of groups of reef fishes based on habitat
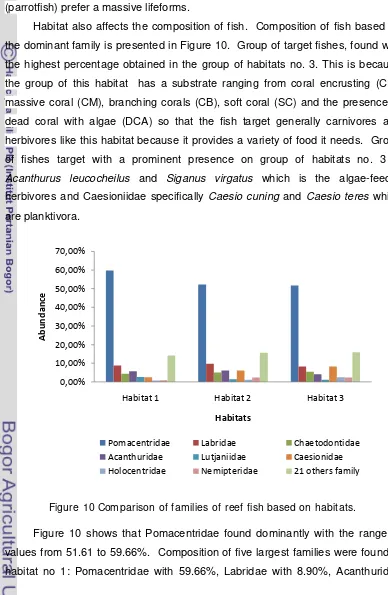
10 Comparison of families of reef fish based on habitat
... 32
11 Principle Component Analysis (PCA) for 3 groups of habitats
... 33
12 The composition of reef fishes at the Pasi Island
... 42
13 Reef fishes trophic levels composition (a = morning; b = afternoon)
... 45
14 Reef fishes trophic levels based on group of habitats
... 45
15 The Vulnerability level in IUCN Red List status
... 46
xxvii
1 The fishes that was found at Pasi Island, Selayar Islands District ... 65
2 Trophic level composition of reef fishes at Pasi Island
3
Binary data of reef fishes at study sites... 69
4
Group of Fishes Characteristics Based on Sorensen Similarity Index at... 70
1.
INTRODUCTION
1.1 Background
Coral reefs provide several shape and different size of space for many
fishes. Every species have preference to certain habitat. Reef fishes use coral
reef as feeding ground, spawning ground and some of them using as nursery
ground (Nybakken 1997). Reef fishes could be as permanent residence or only
whereas living in the ecosystems. Choat and Belwood (1991) noted that there is
a number of fish which always associated with the coral reefs. Existences of
fishes in this ecosystem varied within habitat and influence by reef complexity as
its substrate.
Every group of fishes have different habitat. Generally, each species have
preferences for certain habitat (Hutomo 1986). Selection of shelter sites of
appropriate size in the habitat may be a major factor determining the distribution
of reef fish (Friedlander & Parrish 1998). According to previous studies, several
reef fish species live in close association with colony of branching corals e.g.
Chaetodon,Chromis, Dascyllus and Thalassoma (Nybakken 1997), Pomacentrus
(Ohman & Rajasuria 1998), Gobiidae (Choat & Bellwood) and damselfish
Plectroglyphidodon lachrymatus (Sale 1991; Wilson & Wilson 1985; Kuiter 1992;
Meekan et al. 1995; Allen 2000); and Scaridae (parrotfish) were associated with
massive coral (Nybakken 1997).
Besides habitat size and shape factor of reefs, distribution and existences
of fishes on the reefs is influenced by physical and chemical factor such as
waves and currents, sedimentation, depth and topographic condition of reef
substrate (Galzin et al 1994, Chabanet et al. 1997). Ecological parameter such
as live coral cover, feeding diversity and reproduction also influence the diversity
of reef fishes (Galzin et al. 1994).
The complexity of coral reefs habitat emerges as of shape existing colony.
English et al. (1997) divide life form category become: Acropora branching
(ACB), Acropora digitate (ACD), Acropora tabulate (ACT), coral branching (non
Acropora) (CB), coral encrusting (CE), coral foliose (CF), coral massive (CM),
coral sub massive (CS), coral mushroom (CMR), Millepora (CME), Heliopora
(CHL), other organism (OT) (including: soft corals, sponges, zoanthids, other
(DC) (including: dead coral with algae, rubble, and dead coral with massive
formation).
Harriott and Banks (2002) reviewed a wide range of factors that influence
coral-dominated communities to form reefs, such as water temperature, coral
reproduction and recruitment, competition for space with macro-algae,
oceanographic processes and the physical environment, light availability, and the
potential for coral calcification and growth. Kleypas et al. (1999) acknowledged
that biological factors and regional physical conditions are also likely to be locally
significant.
Coral reef has a complex function
To maintain its function, coral reef ecosystems with their reef fishes needs
to manage effectively and sustainably. Research on biological and ecological
aspects that can provide information about the condition of reef fish in coral reef
ecosystems is needed by parties concerned in determining the suitable
management system with the characteristics of these ecosystems.
but still not supported by the resistance
to damage caused by natural and human activities. Damage to coral reefs is
characterized by a decrease in live coral cover which affect to diversity and
abundance of reef fish and other biota that inhabit.
Observations on habitat selection of reef fishes species on coral life forms
was conducted in Pulau Pasi which administratively located in Kecamatan
Bontoharu, Selayar Islands District. The Coastal water of this island is important
as it has been initiated as a Marine Protected Area (MPA).
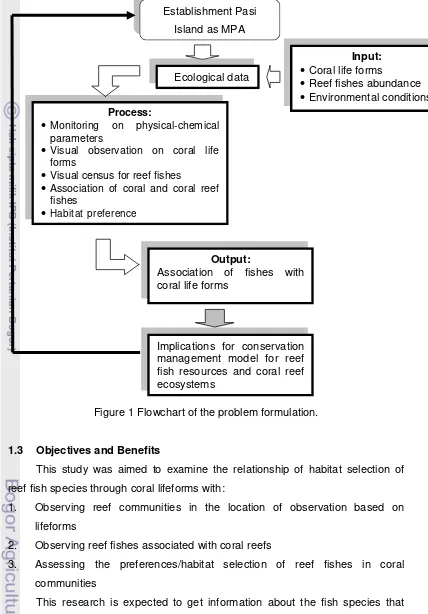
1.2 Problem Formulation
Establishment of Pasi Island as a Marine Protected Area (MPA) should be
supported with ecological information, particularly related to the association coral
reef with fish communities. The data are not available until now. These data are
needed as an ecological basis for management of fishery resources and habitat
conservation.
There is an association between fish and their habitats. The fish that live in
coral reefs have interests and preferences in that ecosystem. Live coral cover
and coral’s life forms can affect the species, abundance and community structure
of reef fish are associated with. Associations and habitat selection of reef fish
communities in a variety of life forms become a main problem that studied in the
Figure 1 Flowchart of the problem formulation.
1.3 Objectives and Benefits
This study was aimed to examine the relationship of habitat selection of
reef fish species through coral lifeforms with:
1. Observing reef communities in the location of observation based on
lifeforms
2. Observing reef fishes associated with coral reefs
3. Assessing the preferences/habitat selection of reef fishes in coral
communities
This research is expected to get information about the fish species that
associated with coral communities and habitat selection factors on various coral
Input:
• Coral life forms
• Reef fishes abundance
• Environmental conditions
Process:
• Monitoring on physical-chemical parameters
• Visual observation on coral life forms
• Visual census for reef fishes
• Association of coral and coral reef fishes
• Habitat preference
Output:
Association of fishes with coral life forms
Implications for conservation management model for reef fish resources and coral reef ecosystems
Establishment Pasi
Island as MPA
life forms at the site of observation for giving an advice in the management of
2. LITERATURE REVIEW
2.1 Coral Reefs
2.1.1 Coral Biology
Coral reefs are an ecosystem that is formed from the deposition of calcium
carbonate (CaCO3
Corals are another name of Scleractinian order
) produced mainly by corals with accretion from calcareous
algae and other organism which produce calcium carbonate (Nybakken 1997).
Odum (1971) defined coral reef as a part of ecosystem that built by some biota,
animal and plant that continuously trapping calcium and carbonate ion from sea
water for constructing skeleton thus in a whole process forming a reef.
which has a hard limestone.
Corals may be colonial or solitary
According to Barnes (1980), the diameter of colonies of coral polyps usually
1-3 mm, whereas there is a solitary species reaches 25 cm. Reef structure
consists of crystals of calcium carbonate and is secreted by the epidermis which
is in the upper of the polyp. This secretion process will form skeletal cup where
the polyps live. The cup is called calyx, the wall surrounding is theca and the
base of the cup called basal plate. As its function to providing a place for the
polyps, shells also provide protection. If there is any threat from predators, the
polyps would be contracted and become small and hidden in the shell making it
difficult for predators to prey.
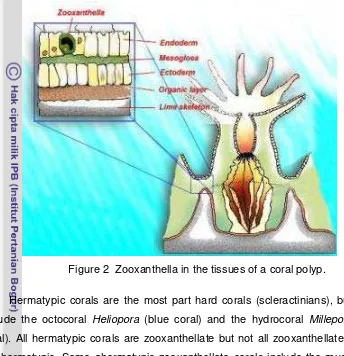
. As individual, coral consist of polyps and the
skeleton. Coral polyps (Figure 2), the mouth is situated at the top and also
functions as an anus. Coral tissue composed of ectoderm, mesoglea and
endoderm (Veron 1986). Ectoderm is the outer tissue that has cilia, mucus and
nematocysts. Mesoglea is a layer that lies between the ectoderm and the
endoderm, formed like a jelly. Endoderm is deeper layer and contains
zooxanthellae (Nybakken 1997).
Corals have one-celled algae called zooxanthellae living in their internal
tissues. This symbiotic relationship allows for the production of enough calcium
carbonate for coral reefs to originate and grow. Zooxanthella is producers.
Almost 90 % of zooxanthella production transfer to coral tissue.
There are two group corals, one called hermapatypic that can produce
reefs and the other called ahermatypic that do not produce reef. The first group
have symbiotic with zooxanthellae and need sunlight for their live and to form
forming reef which are called non-reef building corals and normally in their live do
not depend on sunlight (Veron 1986).
Figure 2
Hermatypic corals are the most part hard corals (scleractinians), but also
include the octocoral Heliopora (blue coral) and the hydrocoral Millepora (fire
coral). All hermatypic corals are zooxanthellate but not all zooxanthellate corals
are hermatypic. Some ahermatypic zooxanthellate corals include the mushroom
coral (Fungia) and Neptune’s Cap (Halomitra).
Zooxanthella in the tissues of a coral polyp.
2.1.2 Limiting Factor for Coral Reef
There is some physical factor influence on coral reef development. At
minimum level on this factor they cannot grow well. This factor called limiting
factor. Nybakken (1997) noted six major limiting factors for coral reef: light,
temperature, depth, salinity, sedimentation and emergence into air.
The first requirement for active coral reef development and growth is light
(Nybakken 1997). If corals are unable to get enough light (whether due to
increased water turbidity and the increased suspended sediment clouding the
water column, or due to a dramatic and rapid increase in water depth), they stop
growing and eventually die (Nybakken 1997). Light is necessary to promote
oxygen production, which stimulates the coral metabolism and leads to increased
calcium carbonate deposition and therefore coral reef growth. Corals require
water depth where light intensity is at least 1-2% of surface intensity (Nybakken
1997). This dependence on light limits the depth of waters where corals are
found. No species of coral has been found to develop in waters deeper than 70
meters, with most corals growing in waters less than 25 meters (Nybakken
1997).
Another factor limiting coral growth and distribution is temperature. Coral
reefs dominate between the latitudes of 25o
South and 25oNorth where water
temperatures tend to remain consistently warm year round (Hoegh-Guldberg
1999). Nybakken (1997) finds corals prefer a mean annual water temperature
between 23-25oC, although various coral species are known to exist in the
temperature range of 18oC – 30o
Another factor that limits the growth of coral reefs is the salinity. Hermatypic
coral
C (Hoegh-Guldberg 1999).
cannot survive at salinities deviating from 32 – 35‰, but there are
exceptions such as those found in the Persian Gulf, where coral reefs can grow
despite the salinity reached 42 ‰ (Nybakken 1997).
Sedimentation also affects coral growth. The sediment was derived from
the activities of the river which through away to the waters will cover coral polyp
and inhabit feeding process. Another disturbing thing is the limitation of the
intensity of light coming into coastal waters due to sedimentation and dissolved
particles that interfere with the process of photosynthesis of zooxanthellae
(Nybakken 1997). Porites is dominant in such hydrographic conditions because
it has a tolerance to sedimentation, probably due to a cleaning mechanism to
remove sediments through mucus secretions or ciliary action (Goh and
Sasekumar 1980), while Acropora and Montipora have lower tolerance to
sedimentation (Riegl 1999).
2.1.3 Types and Forms of Coral Reefs
Coral reefs developed by the same processes, but their geomorphology is
shaped by the formation on which they grow and sea level history. Actually, most
of coral reefs were established less than 10,000 years ago, after sea level rise
associated with the melting of glaciers caused flooding of the continental shelves.
When the coral reefs were established, they began building reefs that grew
upward together with continued sea level rise. The geomorphology of reefs
caused by two main aspects: relative sea level rise and the nature of the
underlying substrate.
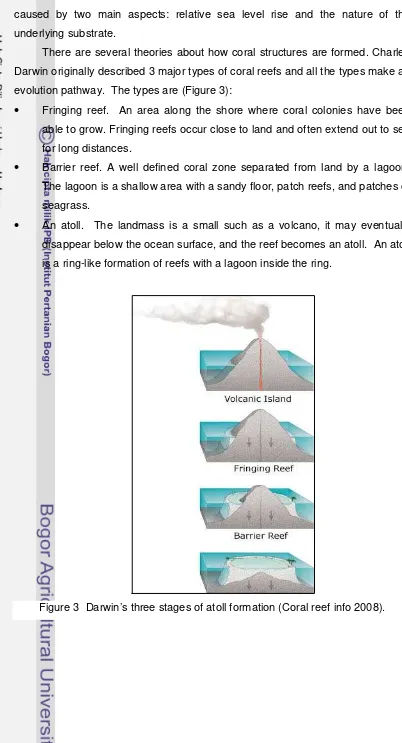
There are several theories about how coral structures are formed. Charles
Darwin originally described 3 major types of coral reefs and all the types make an
evolution pathway. The types are (Figure 3):
• Fringing reef. An area along the shore where coral colonies have been
able to grow. Fringing reefs occur close to land and often extend out to sea
for long distances.
• Barrier reef. A well defined coral zone separated from land by a lagoon.
The lagoon is a shallow area with a sandy floor, patch reefs, and patches of
seagrass.
• An atoll. The landmass is a small such as a volcano, it may eventually
disappear below the ocean surface, and the reef becomes an atoll. An atoll
is a ring-like formation of reefs with a lagoon inside the ring.
According to their growth, scleractinian which can form a reef divided to
Acropora and non-Acropora (English et al. 1997). The differencies Acropora and non-Acropora based on their structural skleton. Some formation to non-Acropora:
1. Branching: have branches longer than its diameters. Abundant along edge
of reef. At least 2o
2. Encrusting : major portion attached to substrate as laminar plate
branching
3. Foliose : coral attached at one or more poits, leaf-like or plate-like
appearance
4. Massive : have solid boulder or mound
5. Sub massive : tend to form small columns, knobs ar wedges
6. Mushroom : solitary, free-living coral of the Fungia
7. Heliopora : blue coral, knowing with it’s blue skeleton
8. Millepora: fire coral, hot if touched.
9. Tubipora : formation with tube, organ pipe-coral
Formations of Acropora are:
1. Branching : have branches like tree, at least 2o
2. Encrusting : usually the base-plate of immature Acropora form
branching
3. Submassive : robust with knob or wedge-like form
4. Digitate : no 2o
5. Tabular: horizontal flattened plates.
branching
2.1.4 Reefs as Habitat
Coral reefs productivity were high due to the mutual relationship between
coral polyps (coral animals) with zooxanthellae (algae) that live in these polyps
(Odum 1971). Results showed that primary productivity of coral reefs reach
1.500 - 3.500 gC/m2/year whereas open water only 18 - 50 gC/m2/year
(Nybakken 1997).
The high productivity of coral reef and the space of reef structures attract
fish to associate. Fish have different spatial requirements and habitat usage.
Fish that have a fixed association with a habitat are known as resident or
site-attached. Individuals that are not associated with any single habitat and move
between different areas are known as transient or vagile. Both resident and
transient fish are found associated with microhabitats (Almany 2003).
McCoy and Bell (1991) define habitat structure: heterogeneity, complexity
and scale. Heterogeneity is the amount of variance accountable to the relative
complexity is the total abundance (per area or unit volume) of individual structural
components; and scale is the size of the area or volume used to measure
heterogeneity and complexity. According to Friedlander and Parrish (1998), key
habitat characteristics have been known to affect fish assemblages on
continuous coral reef habitats.
Microhabitat components are important factors in fish assemblages living
on coral reefs. According to Khalaf and Kochzius (2002), fish species richness
was positively correlated with hard substrate cover and habitat diversity but Sale
et al (2005) said that responses to microhabitat, at or soon after settlement, help
determine distribution of fish recruits at small scales, but microhabitat does not
have an effect fish distribution over large scales.
The other study also reported positive correlations between benthic
diversity and fish diversity, species richness, and abundance on coral and rocky
reefs (Garcı´a-Charton & Pe´rez-Ruzafa 2001). Sites with higher benthic diversity
offer a wider variety of habitats and resources to meet the needs of more
species. Crustose coralline algae were found to correlate positively with several
fish parameters and families with Pomacentridae and herbivore abundance.
Members of the Pomacentridae family guard algal territories, where there is
potential for macroalgae to take hold where coral is unable to colonize. In other
study, Maduppa (2004) stated that 40% of reef fishes found in Acropora
branching (ACB) are Pomacentridae and also in foliose coral (CF) around 48,6% but in massive coral (CM) dominated by Labridae 27,4%.
2.2 Reef Fishes
Sale (1991) define reef fishes are fish that live from juvenile to mature in
coral reef. The existence of fish on reefs related with physical condition of coral
reef. Differences in live coral cover will affect the density of coral reef fishes,
especially those that have strong linkages with live coral (Chabanet et al. 1997;
Suharsono 1995).
The reef fishes diversity marked by species diversity. One cause of the high
diversity of species on the reef is due to the variation of the existing habitat. It is
also influenced by several factors: substrate complexity, food availability, water
quality, currents, waves, hiding area, live coral cover, etc. (Bouchon-Navaro et al.
From the PPTK-UNHAS results (2007) found 14 Family and 80 species of
coral reef and also found 213 species of fish representing the 31 family of reef
fish in a location that will be observed in the Selayar District.
2.2.1 Grouping Reef Fish
English et al. (1997) classifying species of reef fish into three main groups,
namely:
a. Target fish, which is economically important and favored target of
fishermen. These groups used coral reefs as spawning and nursery
ground. These groups consist of Serranidae, Lutjanidae, Lethrinidae,
Nemipteridae, Caesionidae, Siganidae, Haemulidae, Scaridae and
Acanthuridae;
b. Indicator fish, that typical reef fishes inhabit the coral reef ecosystem and
as an indicator for healthy ecosystem. This group represented by
Chaetodontidae;
c. Major fish are small fishes with 5–25 cm length, with varying discoloration
characteristics and became known as the ornamental fish. These groups
are generally abundance, both in number and type of individuals, and tend
to be territorial.
Major fish spend all their life in coral reefs,
Lowe and McConnel (1987) classified reef fishes community divided into
two groups:
represented by
Pomacentridae, Apogonidae, Labridae, and Blenniidae.
1. Group of fishes that sometimes occurs in coral reef area like Scombridae
and Myctophydae, and
2. Group of fishes that depend to coral reef as feeding ground, settlement or
both.
Daily distribution of coral reef divided into two groups: diurnal, and
nocturnal. According to Lowe and McConell (1987), mostly reef fishes are diurnal
(active during the day); and nocturnal fishes (active at night) usually act as
carnivores. According to Randall et al. (1990), diurnal fishes mostly herbivores
with clearly colour which are hide and shelter at the night in hole around reefs
and some of them drowned in sand.
Randall (1990) describes families of reef fishes included:
1. Achanthuridae: known as Surgeonfish, grazing on benthic algae and have
fishes are able to slash other fishes with their sharp caudal spines by a
rapid side sweep of the tail.
2. Balistidae: group of triggerfish, solitary diurnal carnivores, feeding on a
wide variety of invertebrates including hard-shelled mollusks and
echinoderms; some also feed on algae or zooplankton.
3. Blennidae : living in little hole on reef, mostly bottom dwelling species
feeding on a mixed diet of algae and benthic invertebrates; some are
planktivores, and some are specialized to feed on skin or fins of larger
fishes, with mimic as cleaner.
4. Caesonidae: known as yellow tail, during the day they occur in large
zooplankton feeding schools in mid-water over the reef, along steep outer
reef slopes and around deep lagoon pinnacles. Although they are active
swimmers, they often pause to pick zooplankton and at cleaning stations,
and shelter within the reef at night.
5. Centriscidae : Swims in vertical position with the snout downwards; feeds
on small zooplankton
6. Caetodontidae : called butterfly fishes, most with bright coloration, a dark
band across the eye and an 'eyespot' dorsally, many feed on a combination
of coelenterate polyps or tentacles, small invertebrates, fish eggs, and
filamentous algae while others are specialists or planktivores
7. Ephippidae : compressed laterally and deep-bodied, mouth small,
omnivores of algae and small invertebrates
8. Gobidae: mostly found in shallow coastal waters and around coral reefs.
Most are cryptic bottom dwelling carnivores of small benthic invertebrates;
others are planktivores. Some species have symbiotic relationships with
invertebrates (e.g. shrimps) and others are known to remove ecto-parasites
from other fishes
9. Labridae: called wrasses, an important food fishes, have size, shape and
colour very diversified. Most species are sand burrowers; carnivores on
benthic invertebrates; also planktivores, and some small species remove
ectoparasites of larger fishes
10. Mullidae: called with goatfishes, have chin with 2 long barbels, which
contain chemosensory organs and are used to probe the sand or holes in
11. Nemipteridae : known as threadfin breams or whiptail breams, carnivorous
fishes that feed mainly on benthic small fishes, cephalopods, crustaceans
and polychaetes; some species are planktivores
12. Pomacentridae: called with damselfishes, have variable coloration with
individuals and with locality for the same species. Many species are highly
territorial herbivores, omnivores, or planktivores. Damselfishes lay elliptical
demersal eggs that are guarded by the males. Included are the anemone
fishes (Amphiprioninae), which live in close association with large sea
anemones
13. Scaridae: known as parrotfish, herbivorous, usually scraping algae from
dead coral substrates. Bits of rock eaten with the algae are crushed into
sand and ground with the algae to aid in digestion, making parrotfish some
of the most important producers of sand on coral reefs. Scaridae are
important food fishes.
14. Serranidae: known as Sea basses: groupers, bottom-dwelling predators
and highly commercial food, they feed on crustaceans and fishes.
Subfamilies Anthiinae, Epinephelinae (tribes Epinephelini, Niphonini,
Liopropomatini, Diploprioni, Grammistini) and Serranidae.
15. Sygnathidae: knowing as seahorses or pipe fishes. Some very colourful.
Usually limited to shallow water. Feed on minute invertebrates sucked into
a tubular snout. Males have a brood pouch in which the eggs are laid and
where they are fertilized and incubated.
16. Zanclidae: Acanthuridae from which it differs mainly in lacking a peduncle
spine. Feed on mainly on sponges, also benthic invertebrates
According to Sale (1991), reef fish groups most closely associated with
coral reef environments into three main groups namely:
a. Labroid : Labridae (wrasses), Scaridae (parrot fish), and Pomacentridae (damselfishes)
b. Acanthuroid : Achanturidae (surgeon fishes), siganidae (rabbit fishes), and Zanclidae (Moorish idols)
c. Chaetodontoid: Chaetodontidae (butterfly fishes) and Pomachantidae (angelfishes).
2.3 Interaction between Coral Reef and Reef Fishes
Variance in species richness has been correlated with variance in habitat
complexity (Friedlander et al. 2003). Both schooling and solitary fishes are
essential residents of the reef ecosystem. According to Robertson (1986), coral
reef communities (abundance and structure) are influenced by specific interaction
within species.
Interaction between coral reef and reef fishes divided into 3 forms (Choat &
Bellwood 1991) such as:
1. Direct interaction as a shelter from predators for young fish.
2. Interactions in search of food for fish that consume benthic biota, including
the relationship between reef fish and biota that live on coral and algae.
3. Indirect interactions between coral reef structure and hydrological
conditions and sedimentation with foraging habits
According to Nybakken (1997), interaction that happened between coral
reef and fish in coral reef ecosystems are:
of planktivores and
carnivores.
1. Predation. There are two groups of fish that are grazing actively to the
coral colonies. Included in this category: (a) species that consume the
coral polyp themselves such as puffers (Tetraodontidae), file fish
(Monacanthidae), trigger fish (Balistidae) and butterfly fish
(Chaetodontidae), and (b) a group of omnivores that remove the coral
polyps to obtain either the algae in the coral skeleton or various
invertebrates that have bored into the skeleton such as surgeon fish
(Acanthuridae) and parrot fish (Scaridae).
2. Grazing. Activity of herbivorous fishes such as Siganidae, Pomacentridae,
Acanthuridae and Scaridae to make a pressure for algae and keep the
algae reduce to minimum and enhance the survival of coral recruit.
Based on their food habit, Wootton (1992) classified reef fishes into 6 types
such as: omnivores, detritivores, herbivores, zooplanktivores, molluscivores and
carnivores. Coral fishes make their living in many specialized ways. Some are
herbivores, cropping algae, or, like parrot fishes (Scaridae), scraping and biting
off coral to obtain the algal symbiont. Others, such as puffer fishes
(Tetraodontidae), box fish (Ostraciontidae), gobies, and some damselfishes, eat
invertebrates, and these include the filefishes (Monacanthidae) and butterfly
forceps-like mouth. Yet others prey on fishes, such as the trumper fishes
(Aulostomatidae) which stalk small fishes by swimming close to other
non-predatory fishes (Bone & Moore 2008).
Coral reefs are not only prepared by the reef, but also have a sandy
substrate, has a cave, area of algae, as well as other shallow water. Variations
in these habitats also resulted in increased diversity of species in coral reefs.
Fish species may show a preference for certain habitats. Elliot and Marsical
(1995) found different Pomacentridae also showed specific interactions as well
as Amphipiprion Sp associated with anemones. According to Sale (1991), Reef
fish like certain habitats that can support their survival e.g. Pomacentrus coelestis
that associated with rubble.
Fishes can play an essential role in the reef's food web, acting as both
predators and prey. Their leftover food scraps and wastes provide food and
nutrients for other reef inhabitants. Some of fish like Parrotfish are herbivores
and eat the algae within the coral. After they grind the coral's exoskeleton to get
to the algae, they form sands.
Some species are known as cleaners, and set up cleaning stations along
the reef. When a larger fish want to a cleaning station, a cleaner wrasse removes
parasites from the fish. If the same two fish met anywhere else, the larger fish
would eat the smaller one. But it appears that different rules apply at the cleaning
stations.
The dominance of one or two microhabitat components can have an effect
upon the dominance of certain fish families (e.g. Sargassum rich bommies have
the highest proportion of fish from the Labridae family). Fish species interact
closely with their habitat for the majority of their lives and therefore, there is
reason to hypothesize that the distribution and structure of reef fish communities
should correlate with variables of the habitats present (McGehee 1994; Ohman &
Rajasuriya 1998). Factors previously found to influence reef fish community
structure include benthic diversity, habitat complexity, live coral cover, macroalgal
cover, depth and exposure. Topographically complex reef habitats or those with
high numbers of lifeforms or high benthic diversity might provide more
microhabitats, refuge sites, and food resources for a higher number of individuals
and species.
Benfield (2008) found a positive relationship between live branching coral
corals in both habitats and used these structures as refuge sites (e.g.
Epinephelus analogus and Serranus psittacinus).
Herbivores also were positively correlated with live branching coral cover
within coral community sites (Ohman & Rajasuriya 1998). Filamentous algae
grow on and between the colonies and branches of the coral provide a food
source (Ohman & Rajasuriya 1998) and many of the herbivorous members of the
Pomacentridae, which were common in this habitat, utilize branching coral for
shelter (Wellington 1982; Ohman & Rajasuriya 1998).
Another correlation found by (Dominici-Arosemena & Wolff 2006) who
found the presence of massive corals was related to higher levels of species
richness and diversity. Thus, massive corals, especially when it reach 1 m
diameter increase the variety of growth forms and provide areas of topographical
complexity in a landscape of low variability, which attract fish. Massive corals
provide microhabitats that offer some food (e.g. crabs, tunicates, bivalves and
brittlestars) that increase the fish species richness and change the abundance of
certain groups, e.g. Balistidae, invertivores and omnivores.
The positive relationship between Tetradontidae and the abundance of
massive corals can be explained by the preference of this family for this food
resource (Guzman & Robertson, 1989). In this observation, they found some
species found associated with the massive corals were generally larger which
would account for the correlation between massive corals and the species length
ordination for coral community sites.
Maneuverability is important in the reef habitat, and, as a result, many coral
reef fishes have abandoned normal oscillatory swimming except in emergencies
and instead flap their pectoral fins (wrasse, parrot fish, and surgeon fishes
(Acanthuridae) or the dorsal and ventral unpaired fins (Trigger fishes
(Balistidae)), or undulate unpaired fins (seahorses, pipe fishes and trumpet
3.
MATERIALS AND METHODS
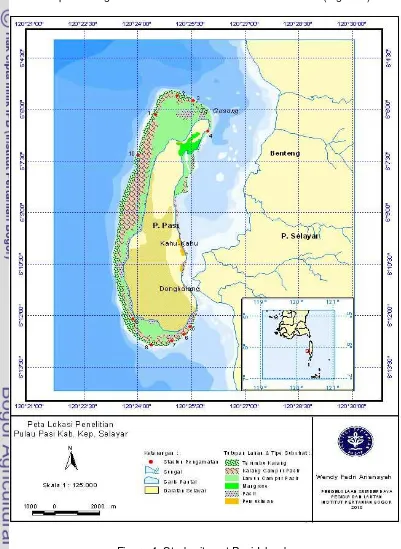
3.1 Study Sites
This study was carried out in Pasi Island water of Selayar Islands Districts,
South Sulawesi Province from March to April 2010. Ten study sites were
selected representing the environmental variation of coastal area (Figure 4).
To maintain ecosystems, Selayar Islands District has initiated the
formation of regional Marine Protected Area (MPA) as an effort to manage the
rate of damage to the ecosystem while preserving the sustainability of resources
for the community.
The selection of this area as study site is based on the introduction of
Selayar Islands District as the Maritime District. According to PPTK Unhas
(2007), live coral cover in this area was around 60%. This area has
Pasi island has an area of 2.388,78 ha with 29.545, 66 m
coastline; 66, 62 ha of mangrove; 408, 36 ha of coral reefs; 603, 61 ha coral
reefs with sands; 799, 53 ha seagrass with sands, 171, 32 ha sandy inundated
by sea water; 58, 95 ha white sandy beaches; 25, 99 ha settlement; 845, 42 ha
coconut plantation and 1.391, 40 ha patch (PPTK Unhas 2007).
A total of 10 selected study sites scattered around the island, 3 sites at the
north of island, 1 site on the east, 5 sites on the south and 1 site on the west. The
selections are based on the good condition of coral cover and dominance of the
life forms branching Acropora and tabular Acropora in study sites. On the east
and west of the island only one transect was taken because of the coral cover in
the eastern part of the observation area that is not too large, while in the western
part due to strong waves at the time of observation that is not possible to take
more than one site.
tremendous
potential for tourism but still not explored.
Equipment and materials used in this study were divided into two parts,
namely:
1. To observe the physical-chemical parameters of waters such as:
temperature (thermometer), brightness (seichi disc), current velocity
(floating dredge), depth (depth gauge), salinity (refractometer)
2. To observe coral reefs and reef fishes such as: Self-contained Underwater
Breathing Apparatus (SCUBA), GPS (Global Positioning System),
underwater cameras (Canon and Olympus 5 MP 5 MP), a permanent
plastic transect with size 5 x 5 m2 created in which 1 x 1 m2 transect
(Figure 6), stationery underwater, and roll meters. Coral reefs identified
based on English et al. (1997) and fish identified based on Kuiter &
Tonozuka (2001a,b,c).
3.2
Before study sites determined, preliminary observations made by
snorkeling to get an overview of the area to be defined as a study site.
Observations carried out only in shallow water with 3-7 m depth. The area
selected must have good coral cover to represent coral reef ecosystems.
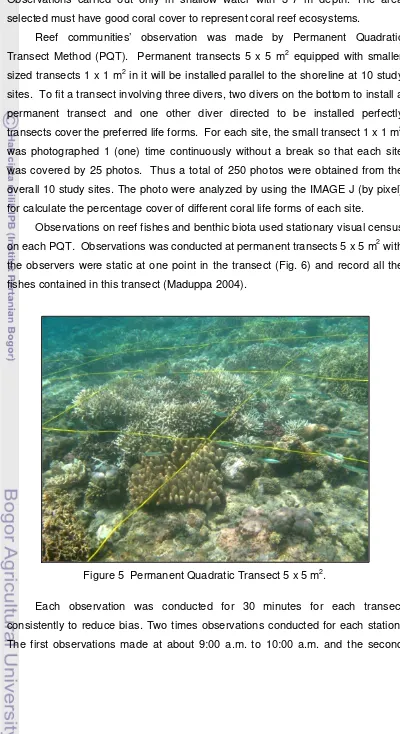
Reef communities’ observation was made by Permanent Quadratic
Transect Method (PQT). Permanent transects 5 x 5 m2 equipped with smaller
sized transects 1 x 1 m2 in it will be installed parallel to the shoreline at 10 study
sites. To fit a transect involving three divers, two divers on the bottom to install a
permanent transect and one other diver directed to be installed perfectly
transects cover the preferred life forms. For each site, the small transect 1 x 1 m2
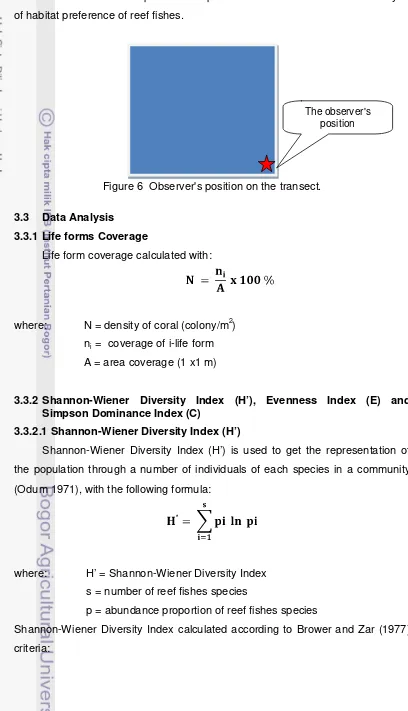
Observations on reef fishes and benthic biota used stationary visual census
on each PQT. Observations was conducted at permanent transects 5 x 5 m
was photographed 1 (one) time continuously without a break so that each site
was covered by 25 photos. Thus a total of 250 photos were obtained from the
overall 10 study sites. The photo were analyzed by using the IMAGE J (by pixel)
for calculate the percentage cover of different coral life forms of each site.
2
with
the observers were static at one point in the transect (Fig. 6) and record all the
fishes contained in this transect (Maduppa 2004).
Figure 5 Permanent Quadratic Transect5 x 5 m2
Each observation was conducted for 30 minutes for each transect
consistently to reduce bias. Two times observations conducted for each station.
observation at about 3:00 p.m. to 4:00 p.m. The data were recorded for analysis
of habitat preference of reef fishes.
Figure 6 Observer's position on the transect
3.3 Data Analysis
.
3.3.1 Life forms Coverage
Life form coverage calculated with:
where: N= density of coral (colony/m2
n
)
i
A = area coverage (1 x1 m) = coverage of i-life form
3.3.2 Shannon-Wiener Diversity Index (H’), Evenness Index (E) and Simpson Dominance Index (C)
3.3.2.1 Shannon-Wiener Diversity Index (H’)
Shannon-Wiener Diversity Index (H’) is used to get the representation of
the population through a number of individuals of each species in a community
(Odum 1971), with the following formula:
where: H’ = Shannon-Wiener Diversity Index
s = number of reef fishes species
p = abundance proportion of reef fishes species
Shannon-Wiener Diversity Index calculated according to Brower and Zar (1977)
criteria:
H’ ≤ 2.30 : slight diversity, very powerful environmental pressure
2.3 < H’ ≤ 3.30 : moderate diversity, intermediate environmental pressure
H’ > 3.30 : high diversity, ecosystem in balance
3.3.2.2 Evenness Index (E)
Evenness Index (E) index is used to measure the balance of the
community. This is based on the similarity of individuals among species in a
community. Evenness Index(E) calculated with the following formula:
where:
E = Evenness Index
Hmax = maximum balance of the species
Index value ranges from 0-1 with the Brower and Zar (1977) criteria
E ≤ 0.4 :
:
0.4 < E ≤ 0.6 : moderate,
small, depressed communities
E > 0.6 : high,
community labile
stable communities
3.3.2.3 Simpson Dominance Index (C)
Dominance index is used to calculate domination of a species. This index is
calculated by Simpson's dominance index (Simpson in Odum 1971) with the
following formula:
Where: C = Simpson Dominance Index
Pi =
Index values range from 1-0 which means if the value approached 1, there is a
tendency of a species to dominate others
proportion of individual species of reef fish
3.3.3 Bray-Curtis Similarity Index
Bray-Curtis similarity index is used to determine patterns of habitat
groupings based on cluster analysis using the percentage composition of the
benthic biota (biological parameters). Biological parameters of the data is used
to classify this habitat are the percentage of life forms coverage obtained at each
Bray-Curtis similarity index calculated with the following formula:
where: D = Bray-Curtis similarity index
Yi1
Y
= value of i- parameter on the 1 site
i2
n =
= value of i- parameter on the 2 site
number of parameters compared
3.3.4 Sorensen Similarity Index
Sorensen similarity index is used to classify and arrange the reef fish
species using cluster analysis. To calculate the Sorensen similarity index,
numerical data on reef fish number of individuals is transformed into a binary
form (Krebs 1985). Sorensen similarity index calculated with the following
formula:
where: So
a =
= Sorensen similarity index
b = number of site with only A species number of site with fish A and B species
c = number of site with only B species
Sorensen similarity index used to create a matrix that will form a dendrogram of
groups of reef fishes based on average linkage method.
3.3.5 Nodules Analysis, Constancy Index (Cij) and Fidelity Index (Fij
The result of grouping coral habitats and reef fishes were used for nodules
analysis. The technique used to combine these two cluster analysis is forming a
two-way binary matrix, groups of habitats on the row and groups of fish
occupying the column.
)
The binary data from the nodules analysis is used to analyse constancy
level group of fishes in certain habitat based on constancy index as following
where:
= the number of presence members of i-group fish species in j-group
of habitat
i
n
= number of element i-group of fishes
j
Constancy index values range from 0 – 1, with criteria: = number of element j-group of habitats
Constancy index can be seen the level of specificity / fidelity of i-group fishes
species in j-group habitats based on fidelity index (Murphy & Edwards 1982 in
Aktani 1990) as following:
= 1 all member of of i-group fishes species exist on j-group habitats.
where: Fij
≥ 2 show a strong level of preference of i-group fish species in j-group of
habitats.
species in j-group of habitats.
3.3.6 Principal Component Analysis (PCA)
Principal Component Analysis is used in order to identify fish species
population that specific to a particular habitat. Principal component analysis is
based on the presence or absence of fish populations in different groups of
habitat. This would indicate the existence of similarities or differences between
fish communities from different groups of habitat were observed.
The purposes of principal components analysis in a large data matrix
(Bengen 2000) are:
a. Extracting important information stored in a table / matrix of large data
c. Observing a table / matrix data from the similarity viewpoint between
4.
RESULT AND DISCUSSION
4.1 Environmental Condition at Pasi Island
The result of observation due to physical - chemical parameters and
environmental condition at Pasi Island were shown in Table 1. Physical and
chemical parameters may indicate whether the coral reefs are in optimal
condition for growth or not.
Table 1 The data of physical - chemical parameters at Pasi Island
Parameters Study Sites
1 2 3 4 5 6 7 8 9 10 Avg.
Variation of temperature at each site measured in small value, ranging from
30,2 0C to 31,6 0
Salinity was obtained at all sites ranged from 30 ‰ to 32 ‰. The lowest
value was obtained at site no. 4 while the salinity at other sites is relatively the
same. The range of values was obtained show that the salinity in the Pasi Island
within the tolerance ranges for coral growth.
C. The lowest value was obtained at site no. 4 located in the
eastern part of the island. The highest value was obtained at site no. 9 located in
the southern part of the island. The range of temperature was obtained from the
observed at all sites still in a good range for coral growth.
Surface current velocity at the sites of the study ranged from 0.02 to 0.12 m
/ sec. The lowest current velocity at site no. 4 is 0.02 m / s because the station is
close to the jetty and near the coast that could reduce its drive, while the highest
current velocity at site no. 1 with 0.12 m / sec. Current velocity can affect coral
growth because it not only can bring nutrients but also clean up sediments on the
reefs. Current velocity also gives negative impact on coral reefs. Current those
are too heavy can break the reef and stirring the bottom of waters. The waters
become muddy and will disrupt the photosynthesis process of zooxanthellae
(Nugeus 2002).
Brightness values were obtained at all sites are 100%. This is related to
the depth of water for all sites located in the shallow waters between 3-7 m
depth. If the reefs are in the shade or protected from light, the growth will be
needed by the zooxanthellae whose existence is closely related to the coral
growth (Nybakken 1997).
Physical-chemical parameters measured in waters Pasi Island in general
are in good condition for supporting coral growth optimally. The results showed
that types of coral reefs in Pasi Island, Selayar Islands District categorized as
fringing reef. According to Nybakken (1997), fringing reef is coral reef that grew
and developed around the islands along the coastline with less than 40 m depth.
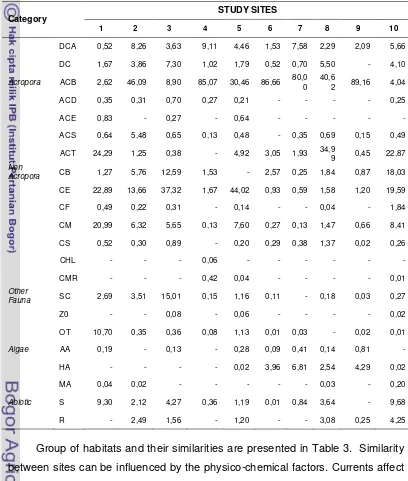
4.2 Coral Reef Lifeforms
The observed coral reef ecosystems vary from each station which can be
caused by differences in biology, physics and chemistry of waters. Percentage of
coral lifeformss obtained is presented in Table 2.
Table 2 shows that the branching Acropora (ACB) emerged as dominant at
sites no. 2, 4, 6, 7, 8 and 9 with a range value of 46.09% - 89.16%. These high
percentages of ACB are due to a fairly shallow waters and slow currents that can
help the coral to grow optimally. At site no. 1 dominated by tabular Acropora
(ACT), encrusting coral (CE) and massive corals (CM). The high presence of
coral massif (CM) at this site can be caused by the current that is strong enough
compared with other sites. At this site was also obtained for 10.70% of seagrass
communities due to the location that the station is bordered by seagrass bed, but
was chosen because of the diverse composition of the substrate.
Tabular Acropora found in a large quantity at site no. 1, 8 and 10. The
existence of this Acropora species can provide shading effects to the coral
beneath. This shading may slow growth or even increase mortality rates effect
for branching corals but does not give impact to the reefs that have massive and
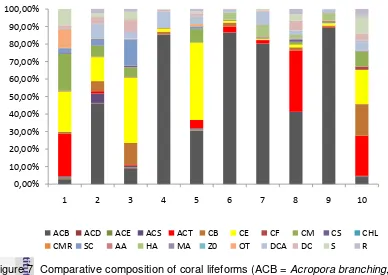
encrusting lifeforms (Stimson 1985). Comparison of the composition of each
lifeforms can be seen in Figure 7.
Habitat grouping based on coral lifeformss were observed using
Bray-Curtis similarity index based on similarity value of coral cover from each site.
Sites can be grouped based on similarity characteristics lifeforms. From the
result that there are three groups of habitat that have the same characteristics
from 10 sites that were observed (Figure 8).
Group of habitats 1 consisting of sites no. 6, 9, 4, 7, 2 and 8 are dominated
by branching Acropora (ACB), dead coral with algae (DCA) and the presence of
Halimeda (HA). Group of habitats 2 consists of site no. 1 and 10 are dominated
sandy substrate (S). Group of habitats 3 consists of site no. 3 and 5 are
dominated by encrusting coral (CE), branching corals (CB), massive coral (CM),
soft coral (SC) and the presence of dead coral (DC), dead coral with algae (DCA)
and rubble.
Table 2 Percentage of coral lifeforms (in %) from 10 study sites
Group of habitats and their similarities are presented in Table 3. Similarity
between sites can be influenced by the physico-chemical factors. Currents affect
coral lifeformss, if it too strong can break branching coral and turn around tabular
lifeforms, but massive coral more adaptive to the current.
Figure 7 Comparative composition of coral lifeforms (ACB = Acroporabranching,
ACD = Acropora digitate, ACE = Acroporaencrusting, ACS = Acropora
submassive, ACT = Acropora tabulate, CB = coral branching, CM =
coral massive, CS = coral submassive, CHL = coral heliopora, CMR =
coral mushroom, SC = soft coral, AA = algae assemblages, HA =
Halimeda, MA = macro algae, ZO = Zoanthids, OT = others, DCA =
death coral with algae, DC = death coral, S = sand, R = rubble).
Figure 8 Dendrogram grouping of habitats based on Bray-Curtis Similarity Index.
Coral reef formation requires conditions favorable for the dispersal and
recruitment of key species, and the presence of environmental conditions
suitable for those species to build reefs (Harriott & Banks 2002). According to
Wood (1983), currents not only help the spread of coral larvae, oxygen and food,
but also spread the warm water that is necessary for development of
reproductive organs and manufacture of calcium carbonate structure of stony
corals. From the observation of larvae is known that certain species of coral
larvae will attach to the type characteristic of certain waters, such as the larvae
that will be the type of massive coral reefs will choose the waters that have low
sedimentation, in contrast to coral reefs that have branched lifeforms that can live
in areas with highly sedimentation and generally fix to the wall-shaped substrate
(Dunno 1982 in Babcock & Smith 2000).
Table 3 Characteristics of group of habitats in Pasi Island waters
Group of habitats
Sites The similarity in the characteristics
I Sites no. 6, 9, 4, 7, 2 and 8
The habitat dominated by branching Acropora (ACB) lifeforms about 40,62 – 89,16%, dead coral with algae (DCA) about 1,53 – 9,11% and the presence of Halimeda (HA) about 2,54 – 6,81%
II Sites no. 1 and 10 The habitat dominated by Acropora tabular (ACT) lifeforms about 22,87 – 24,29 %, coral encrusting (CE) about 19,59 – 22,89 % and coral massive (CM) about 8,41 – 20,99 % with a sandy substrate (S) about 9,30 – 9,68 %.
III Sites no. 3 and 5 The habitat dominated by coral encrusting (CE) lifeforms about 37,32 – 44,02 %, coral massive (CM) about 5,65 – 7,60 %, coral branching (CB) about 12,59 %, soft coral (SC) about 1,16 – 15,01 % and the presence of dead coral (DC) about 1,79 – 7,30 %, dead coral with algae (DCA) about 3,63 – 4,46 % with rubble about 1,20 – 1,50 %.
Porites massive (radial growth rates of 1–2 cm year–1) is relatively slow
growing, while Acropora corals are capable of very rapid growth (lateral rates of
5–20 cm year–1) once established in a habitat (Done et al. 1988; Doherty et al.
1997). Porites, these corals are considered to have a high tolerance to
fluctuations in water quality and other environmental conditions (Nasir 2004;
Veron 1992).
4.3
Fishes were found at 10 study site were 3,990 representing 29 families.
Families which are found are Pomacentridae (56.39%), Labridae (8.97%),
Acanthuridae (5.54%), Chaetodontidae (4.81%), Caesionidae (4.51%), and 24
other families (19.77%). According to Bell and Galzin (1984), Pomacentridae is
the most fishes found on coral reefs and have the highest abundance compared
to other families. Observations at several sites show that some genus of
Pomacentridae emerged with a great quantity such as Abudefduf, Amblyglyphidodon, Chromis, Dascyllus and Pomacentrus.
From the observation, the number of families, species and individuals were
found varies between each station at the first and second observations (Table 4).
At site no. 1, 3 and 5 there is a difference data between the number of families
and species between the first and second observations, while 7 other sites are
quite similar. This difference could be due to absent of Dasyatiidae,
Muraneiidae, Pomacanthidae, Haemuliidae, Holocentridae, Tetraodontidae,
Syngnathidae and Zanclidae. Dasyatiidae and Muraneiidae are a group of hiding
fishes, especially on sandy substrate (Kuiter & Tonozuka 2001a) and thus require
carefulness in visual observation. Holocentridae is a group of nocturnal fishes
that take refuge in the cave during the day (Kuiter & Tonozuka 2001a).
Pomacanthidae are a group of fishes that likes to hide in caves and rock crevices
and are usually found in deep waters while Tetraodontidae liked the muddy
substrate and can be found through estuaries (Kuiter & Tonozuka 2001b).
According to English et al. (1997), from 10 study sites, found 135 species,
74 species are the major fishes, 34 species are the target fishes and 27 species
are indicators. Composition for each group is dominated by the major fishes with
75.36%, the target fishes 16.84% and 7.79% indicators fishes.
Density of fishes at all sites varies in the range from 6.08 to 11.32 fishes /
m2; with an average density are 7.98 fishes / m2. The highest density was
obtained at site no. 2 with a range from 10.36 to 11.32 fishes / m2 and the lowest
density was obtained at the site no. 3 with a value of 6.08 to 6.40 fishes / m2.
4.3.1 Shannon-Wiener Diversity Index (H’), Evenness Index (E) and
Simpson Dominance Index (C)
Reef fish community condition can be known from the Diversity Index (H ')
which indicates the size of the community property that is based on the number
of species in one site the following number of individuals in the species.
Evenness Index (E) is similarity between the number of individuals in one
community between species, and dominance index (C) was used to observe
whether there is dominance by a particular species in an ecosystem.
Table 4 shows that the diversity index (H ') ranged with value from 3.49 to
4.13. The highest values found at a first observation on site no. 1. This indicates
Table 4 Shannon-Wiener Diversity Index (H’), Evenness Index (E) and Simpson
Evenness Index (E) ranged from 0.91 to 0.95. This value is close to value 1
which means that the number of individuals among species in all sites is almost
the same. Simpson Dominance Index (C) ranges from 0.02 to 0.04. The smaller
value of dominance index, especially that close to the value 0, meaning that the
least of dominance of a species in the site.
The difference values were obtained are influenced by environmental
factors. Different environmental factors were giving a different effect on reef fish
communities (Chabanet & Letourneur 1995). The physical properties of complex
habitats on the reef have a correlation to the diversity of fish communities
(Luckhurst & Luckhurst 1978; Chabanet et al. 1997).
Abundance of fishes related with habitat characteristics, especially the coral
cover and the complex nature of topography (Conell & Kingsford 1998). This is
supported by the arrangement of the complex architecture of the substrate that
form a variety of refuge (shelter) for a variety of fauna (Chabanet et al. 1997).
4.3.2 Grouping of Fishes Based on Sorensen Similarity Index
Fish were observed at all study sites are grouped at the species level to
Sorensen similarity index at the level 66.7% indicated that there were 21 groups
of reef fish species that exist on the Pasi Island.
Grouping is meant to find the similarities of fish species observed at all
study sites based on the number of stations that have certain fish species.
Characteristics of each group of fishes species based on Sorensen similarity
index are presented in Appendix 4.
4.3.3
Groups of reef fishes have a preference for certain habitats. Grouping of
reef fishes based on its habitat shown in Table 5 and comparisons between
groups of fish indicators, major and target are presented in Figure 9.
Association of Coral Reefs and Reef Fish
Figure 9 Comparison of groups of reef fishes based on habitat.
Figure 10 shows that group of the habitat 1, which is dominated by
branching Acropora (ACB), dead coral with algae (DCA) and the presence of
Halimeda (HA) has a fewer percentage of the fish indicators than other habitats, but this habitats are favored by group of small major fish from Pomacentridae
supported by a higher presence than any other habitat. Branching corals provide
shelter for small fish from predators. Chaetodontidae as indicators species found
abundant in this habitat, this is consistent with the opinion of Bouchon Navarro et
al. (1985) which states that the fish Chaetodontidae generally associated with the
branching Acropora, while Gomez et al. (1988) found an association between
Chaetodon trifasciatus with a high percentage of branching Acropora. The
0,00%
Habitat 1 Habitat 2 Habitat 3