Sediment Transfer Across Various
Type Of Filter Strips
Naik Sinukaban, Suria Darma Tarigan, Wahyu Purwakusuma
D. P. Tejo Baskoro, Enny Dwi Wahyuni
Acknowledgement
© Copyright ICRAF Southeast Asia
Further information please contact:
ICRAF SE-Asia
Southeast Asian Regional Research Programme PO Box 161
Bogor 16001 Indonesia
Tel: 62 251 625415, fax: 62 251 625416 Email: [email protected]
ICRAF Southeast Asia website: http://www.icraf.cgiar.org/sea
Cover design: Dwiati N. Rini Illustration design: Wiyono
Declaimer
ANALYSIS OF WATERSHED FUNCTION
SEDIMENT TRANSFER ACROSS VARIOUS TYPE OF FILTER STRIPS
LABORATORY OF
SOIL PHYSICS AND SOIL CONSERVATION DEPARTMENT OF SOIL SCIENCE BOGOR AGRICULTURE UNIVERSITY
in association with
International Centre for Research University of Lampung
in Agroforestry (ICRAF) (UNILA)
Southeast Asian Regional Research Programme
ANALYSIS OF WATERSHED FUNCTION
SEDIMENT TRANSFER ACROSS VARIOUS TYPE OF FILTER STRIPS
FINAL REPORT
Naik Sinukaban Suria Darma Tarigan Wahyu Purwakusuma
D. P. Tejo baskoro Enny Dwi Wahyuni
LABORATORY OF
SOIL PHYSICS AND SOIL CONSERVATION DEPARTMENT OF SOIL SCIENCE BOGOR AGRICULTURE UNIVERSITY
in association with
International Centre for Research University of Lampung
in Agroforestry (ICRAF) (UNILA)
Southeast Asian Regional Research Programme
This report has been prepared by Prof. Dr. Ir. Naik Sinukaban, Dr. Ir. Surya Darma Tarigan, Ir. Wakyu Purwakusuma, MSc., Ir. D.P. Tejo Baskoro, MSc., and Ir. Enny Dwi Wahyuni, Msi., the staff of Laboratory Soil Physics and Conservation, Soil Science Department, Bogor Agricultural University after undertaking a research work in Kampung Karang Bodong, Sumber Jaya Area of Tulang Bawang watershed (Lampung).
The report describes various types of filter strips generally found at the research area and their effect on sediment transfer from adjacent land use, application of ANSWER Model in Unila Erosion Plot-Kampong Karang Bodong, and hydrological and climatological analysis of the Way Besai Upper Catchment.
In this opportunity the authors wishes to convey their gratitude to:
- The International Centre for Research in Agroforestry (ICRAF) South East Asia and The Asian Development Bank (RETA 5711) for the Financial Support (as source of funding) - The Unila Team for their collaboration.
- The field worker and others who get involved in the research for their support in collecting field data.
This report has been prepared by Prof. Dr. Ir. Naik Sinukaban, Dr. Ir. Surya Darma Tarigan, Ir. Wakyu Purwakusuma, MSc., Ir. D.P. Tejo Baskoro, MSc., and Ir. Enny Dwi Wahyuni, Msi., the staff of Laboratory Soil Physics and Conservation, Soil Science Department, Bogor Agricultural University after undertaking a research work in Kampung Karang Bodong, Sumber Jaya Area of Tulang Bawang watershed (Lampung).
The report describes various types of filter strips generally found at the research area and their effect on sediment transfer from adjacent land use, application of ANSWER Model in Unila Erosion Plot-Kampong Karang Bodong, and hydrological and climatological analysis of the Way Besai Upper Catchment.
In this opportunity the authors wishes to convey their gratitude to:
- The International Centre for Research in Agroforestry (ICRAF) South East Asia and The Asian Development Bank (RETA 5711) for the Financial Support (as source of funding)
- The Unila Team for their collaboration.
- The field worker and others who get involved in the research for their support in collecting field data.
Bogor, January 2000
Page
I. INTRODUCTION ……….. 1
1.1 Background and Objective ………..……….. 1
1.2 Location ……….. 1
II. METHODOLOGY ……….. 3
2.1. Sediment Transfer across Filter Strips ……….. 3
2.1.1. Identification of Land Use Type and Its Corresponding Filter Strips ……….. 3
2.1.2. Measurement of Sediment Transfer ……….. 5
2.1.3 Measurement of Soil Erosion ……… 5
2.2.2.2. Antecedent Soil Moisture (ASM)of saturation ………… 7
2.2.2.3. Infiltration Rate Description (FC and A) and Infiltration Exponent (P) ……… 7
2.2.3. Data Collection of Land Use and Surface Parameter ……… 8
2.2.3.1. Interception Parameters (PIT and PER) ……… 8
2.2.3.2. Surface Storage Descriptors (HU and RC) ……… 8
2.3. Hydrological Analysis ………. 9
2.3.1. Rainfall ……….. 9
2.3.2. Streamflow ……….. 9
III. RESULT AND DISCUSSION ………..……….. 10
3.1 Sediment Transfer across Filter Strips ………..……… 10 3.1.1. Description of Filter Strips and Land Use Type ……… 10 3.1.2. Effect of Filter Strips on Sediment Transfer ……… 11
3.1.3. Sediment Yield (Trapped sediment) on Various Land Use Types ……… 14
3.1.4. Soil Erosion from some Representative Land Use Types ………… 16
3.2. ANSWERS Model ……… 17
3.2.1. Rainfall Characteristics ……… 18
3.2.2. Soil Parameters ……….…... 18
3.2.3. Land Use Characteristics ……… 18
3.2.4. Individual Element Information ……… 19
3.2.5. Predicted Run-off and Erosion in the Unila Catchment with Existing Filter strip ……… 19
3.2.6. Simulation of Filter strip Role in Sediment Transfer ……… 20
3.3. Hydrological Analysis and Effect of Land Use Change on Streamflow Characteristics of Upper Way Besay Catchment ………..……… 22
3.3.1. Hydrological Analysis ……… 22 3.3.1.1. Rainfall ……… 25
3.3.1.2. Streamflow ……… 24
3.3.1.3. Rainfall-Run Off Relationship ……… 26
Page
Table 2.1. Typical Value of Roughness Coefficient (HU) and
Maximum Roughness Height (HC) ………. 9
Table 3.1. Characteristics of Various filter strips and its corresponding
Land Use Type ………. 10
Table 3.2. Trap efficiency of various filter strip as compared to that on
Upper land use ……….……… 12
Table 3.3. Trap efficiency of various filter strips ……….………… 13
Table 3.4. Sediment Yield (Trapped sediment) of Various
Land Use Type ……….……… 14
Table 3.5. Soil Erosion and Run Off on some representative land use types ……..… 17
Table 3.6. Description of Soil Parameters for Each Soil Types ……… 18
Table 3.7. Characteristics of each Soil Types ……… 18
Table 3.8. Effectiveness of Existing Filter Strip to Reduce Run-off and Trap Sediment as Predicted by ANSWERS MODEL
At Catchment Outlet ……… 20
Table 3.9. Net Erosion or Deposition at Selected Element of Filter strip
as Predicted by ANSWER MODEL ……… 20
Table 3.10. Simulation Results of Different Configuration of
Synthetic Filter Strip ………..…………... 21
Table 3.11. Minimum and Maximum flow in 1975, 1980, 1985, 1990, 1995
At study area ………... 26
Table 3.12. Change in percentages of land use system from 1970 to 1990 ……….. 28
Page
Figure 1.1. Research Location in Lampung Province ……….. 2
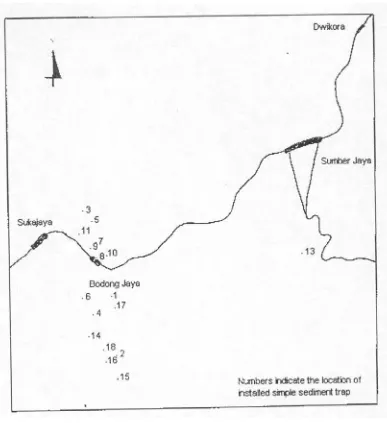
Figure 2.1. Location of Simple Sediment Trap ……….. 4
Figure 2.2. Design of Simple Sediment Trap Used in the Experiment …………..……. 5
Figure 2.3. Design of Simple Erosion Plot Used in the Experimen ………..…. 6
Figure 2.4. Sketch of Simplified Well Permeameter Assembly ………. 8
Figure 3.1. Trap efficiency of Shrubs and Young Shrubs over 312 Days of Observation ……….………. 13
Figure 3.2. Monthly rainfall distribution of study area ………. 22
Figure 3.3. 1975 Monthly rainfall distribution of study area ………. 22
Figure 3.4. 1980 Monthly rainfall distribution of study area ………. 23
Figure 3.5. 1985 Monthly rainfall distribution of study area ………. 23
Figure 3.6. 1990 Monthly rainfall distribution of study area ………..….. 23
Figure 3.7. 1995 Monthly rainfall distribution of study area ………. 23
Figure 3.8. Monthly streamflow distribution ………. 24
Figure 3.9. Mean Monthly streamflow distributionin 1975, 1980, 1985, 1990, and 1995 ………..……….. 25
Figure 3.10. Monthly basis rainfall runoff relationship ………. 26
Figure 3.11. Daily basis rainfall runoff relationship ……….. 26
Figure 3.12. Monthly basis rainfall runoff relationship in 1975, 1980, 1985, 1990, and 1995 ………..……….. 27
Page
Appendix 1. Small ridge as a field boundary in multi strata system
(dense coffee with Erythrina overground) ……… 34
Appendix 2. Small ridge as a field boundary in tegalan with horticultural crops ……….. 34
Appendix 3. Hedgerow of banana with small ridge covered by grass as a field boundary, tegalan with horticultural crops, and multi strata system ( mixed gardens ) ………. 35
Appendix 4. Hedgerow of banana with small ridge covered by grass as a field boundary ……… 36
Appendix 5. Hedgerow of banana with small ridge covered by grass as a field boundary and unweeded coffee gardens ……….……… 37
Appendix 6. Dense woody shrubs as a field boundary and coffee gardens ……….. 38
Appendix 7. Dense woody shrubs as a filter strip and unweeded coffee gardens ……… 38
Appendix 8. Dense grass and young woody shrubs as filter strips and clean weeded coffee gardens ……… 39
Appendix 9. Terraced land with woody young shrubs as a filter strip and clean weeded coffee gardens ……… 40
Appendix 10. Young woody shrubs with imperata grass as a filter strip and unweeded coffee gardens ……… 41
Appendix 11. Hedgerow of “pisangan” as a field boundary and clean weeded coffee gardens ……… 42
Appendix 12. Calliandra with coffee underground at Kampong Dwikora ………… 42
Appendix 13. Calliandra with coffee underground at Kampong Tebo …………..……… 43
Appendix 14. Clean weeded coffee gardens ………..…….. 43
Appendix 15. Natural Forest ……….. 44
Appendix 16. Cleared land with the remnant falling trees (the former natural forest) ………..………. 44
Appendix 17. Multistrata system ( Erythrina with dense coffee underground ) ……….. 45
Appendix 18. Predicted and Meaured Run-Off at Outlet of Micro-Catchment for Rainfall Event of 18-02-1999 ……….……… 46
Appendix 19. Predicted and Meaured Run-Off at Outlet of Micro-Catchment for Rainfall Event of 21-02-1999 ……….. 47
Appendix 20. Predicted and Meaured Run-Off at Outlet of Micro-Catchment for Rainfall Event of 13-05-1999 ……….. 48
Appendix 21. Spatial Configuration of Existing Field Strip ……….. 49
Appendix 22. Spatial Configuration of First Simulated Field Strip ……….. 50
Appendix 23. Spatial Configuration of Second Simulated Field Strip ………..…. 51
Appendix 24. Spatial Configuration of Third Simulated Field Strip ……… 52
Appendix 25. Spatial Configuration of Fourth Simulated Field Strip ……….….. 53
Appendix 26. Spatial Configuration of Fifth Simulated Field Strip ………. 54
Appendix 27. Data of sediment yield on small ridge and Multistrata System (Erythrina with Coffee Undergrowth) ………..…... 55
Appendix 28. Data of sediment yield on small ridge and Horticultural crops ……….. 55
with small ridge along crop rows ………..……… 59 Appendix 33. Data of sediment yield on dense woody shrubs and unweeded
coffee gardens ………..…….. 59
Appendix 34. Data of sediment yield on dense grass, young woody shrubs, and clean
weeded coffee gardens ………..……….. 60
Appendix 35. Data of sediment yield on terraced land and
clean weeded coffee gardens ……….………….. 61
Appendix 36. Data of sediment yield on woody shrubs and
weeded coffee gardens ………..………. 62
Appendix 37. Data of sediment yield on Hedgerow of Pisangan and
Clean weeded coffee gardens ………..…. 63
Appendix 38. Data of sediment yield on Calliandra with coffee undergrowth
(at Kampong Dwikora) ………. 63
Appendix 39. Data of sediment yield on Calliandra with coffee undergrowth
(at Kampong Tebo) ………. 64
Appendix 40. Data of sediment yield on Clean weeded coffee gardens …………..……. 64 Appendix 41. Data of sediment yield on Natural Forest ………. 65 Appendix 42. Data of sediment yield on Cleared land with falling trees
(The former natural forest) ………..……. 65
Appendix 43. Data of sediment yield on Multistrata System
(Erythrina with dense Coffee Undergrowth) ……….………. 66 Appendix 44. Data of sediment yield on Tegalan with Horticultural crops ….……. 66 Appendix 45. Water run-off and soil erosion from some
representative land use types ……….. 67 Appendix 46. Soil Profile Description in Micro-Catchment ………..….. 68 Appendix 47. Soil Physical Characteritics of Micro-Catchment ………..……..
70
I. INTRODUCTION
1.1. Background and Objective
The relationship between erosion measured in a standardised 'erosion plot' or predicted by a model calibrated from such experiments and the magnitude of sediment yield in rivers can be overstated due to the intercepting effect of filter strips/border strips and hedgerows that capture sediment from erosion higher up slope.
There appears to be a major gap between results of plot level erosion studies and studies based on stream flow. The whole matrix of field borders in which the plots are set appears to have been ignored in most previous researches. To properly link between the on-site erosion and sediment yield in rivers, factors, such as field border strip and the ‘hot spots’ that directly contribute sediment to streams e.g. from footpaths should be taken in to consideration.
The first part of this research emphasises the measurement of sediment transfer across various types of filter strips. The working hypothesis is that transfer beyond filter strips is small, regardless of land use, despite significant soil loss within fields for some types of land use.
Nevertheless, those measurements are considered as point measurements. At landscape scale, the spatial configuration of mentioned filter strips will greatly influence the linkage between on-site and off-site effect. The configuration of the filter strips in a catchment scale has not been taken into consideration in the first part of this research. Therefore, those point measurements need to be transferred into broader scale. To transfer into a broader scale a spatial model is needed.
An existing spatial model, the so called ANSWERS model is considered as an appropriate tool to simulate the sediment transfer. The application of the ANSWERS to simulate the sediment transfer across filter strips is the second emphasis of this research.
The third part of this research deals with analysis of the flow pattern of the Way Besai river in Sumber Jaya (Lampung, Sumatra). We analysed these flow patterns and their association to rainfall and land use change over the past 25 years.
1.2. Location
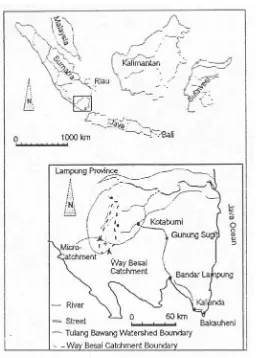
This research was located at the Way Besai catchment in the northern part of Lampung Province, between 4o 15’ to 5o 15’ S and 104o 15’ to 104o 30’ E (see Figure 1.1).
Location of Sediment Transfer Measurement
The measurement of sediment transfer was carried out in 5 different filter strips/land use. These filter strips were situated at the upper parts of the Way Besai catchment. Surrounding the area some small erosion plots having size 3x1 m2 had been established to measure erosion.
Location of ANSWERS Model Application
The values of parameters used for model prediction and calibration were collected from a micro-catchment. This micro-catchment is situated 2 km to the East of Fajar Bulan Village. The micro-catchment has an areas of approximately 2 ha.
Location for Hydrological Analysis of Way Besai
II. METHODOLOGY
2.1. Sediment Transfer across Filter strips
2.1.1. Identification of Land Use Type and Its Corresponding Filter strips
To identify and characterise the physical condition of various land use type and their corresponding filter strips, a field survey was carried out in the surroundings of Kampong Karang Bodong as a representative area of the Way Besai Catchment (sub-watershed of the Tulang Bawang river). The survey was conducted in 26 - 30 December 1998. The following land use types were selected: :
a. Natural forest
b. Cleared land with recently felled trees (next to natural forest) c. Reforestation zone with Calliandra (in former coffee gardens) d. Coffee gardens
e. Mixed gardens or multi strata systems f. Tegalan with upland horticultural crops
Land use characteristics identified were coverage (canopy and basal cover), slope characteristics (slope steepness, length, and configuration), and major filter strips in the respective land use type. In addition, some other physical condition related to sediment transfer process were also identified.
In every selected land use type and its corresponding filter strips, representative sites for sediment yield and transfer measurement were then located. The selection was based on the prevailing characteristics found on the field. The number of selected sites for measurement on each land use type were variable depending on the characteristics of the land use type.
2.1.2 Measurement of Sediment Transfer
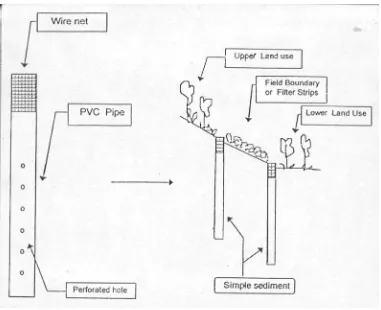
Sediment transfer across filter strips was evaluated by measuring trapped sediment on upper and lower site of filter strips/ field boundaries. To measure trapped sediment, simple sediment traps were installed in each representative filter strips. Sediment traps were made of PVC pipe of 2.5 inch in diameter and of about 100 cm long (the length of the PVC pipe are not necessarily the same, but can be different to suit the soil condition, especially the presence of bed rock). On the lower half of the pipes, the pipes wall were perforated to enable water penetrating the soil through the pipe wall and sediment were left deposited in the pipe (Figure 2.2).
Sediment traps were installed in pairs both in the upper and lower site in every filter strips (in pairs before and after filter strips as a filter element). The number of sediment traps for each filter strips depended on the width or length of the filter strips. The minimum number of sediment trap installed were 5 pairs for each filter strips.
Figure 2.2. Design of simple sediment trap used in the experiment
2.1.3. Measurement of Soil Erosion
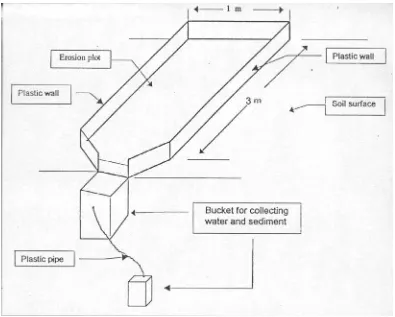
Additionally, a more conventional plot method was used for quantifying soil erosion per unit area under representative land uses. To measure soil erosion, two small plot were installed for each selected representative land use type (design of the erosion plot are illustrated in Figure 2.3).
Selected representative land use type on which soil erosion are measured are as follow : 1. Natural forest
2. Calliandra (in former coffee gardens)
3. Multistata system (Coffee gardens with Erythrina overstory) 4. Clean weeded coffee gardens
5. Unweeded coffee gardens
Figure 2.3 Design of small erosion plot used in the experiment
2.2. ANSWERS Model
As mentioned in the previous section, the ANSWERS model was used to simulate the role of filter strips/filters strips in sediment transfer. The function of filter strips in trapping sediment had to be incorporated into ANSWER model through the use of options available at the BMP (Best
Management Practices) descriptors.
The robustness of the model in predicting erosion/sedimentation and validation of it’s measured parameters should be first proven, before it can be used for the simulations. For this purpose the ANSWERS Model was run using data from the micro-catchment. The result of the discharge and sedimentation prediction was compared to the measured data.
2.2.1. Structure of ANSWER Model
ANSWERS is a deterministic model based upon the fundamental hypothesis that: “At every point within a watershed, functional relationship exist between water flow rates and those hydrologic parameters which govern them, e.g., rainfall intensity, infiltration, topography, soil type, etc. Furthermore, these flow rates can be utilized in conjunction with appropriate component relationship as the basis for modelling other transport related phenomenon such soil erosion and chemical movement within that watershed”. An important feature of the above hypothesis is applicability on a “point” basis.
could be extended indefinitely until one assumed the entire watershed was composed of a single element with “averaged” parameter value, i.e., a lumped model. The actual geometric size of an element is not critical because there is no finite-sized area within which some degree of variation in one or more parameters does not exist. The crucial concept is that an element must be sufficiently small that arbitrary changes of parameter values for a single element have a negligible influence upon the response of the entire watershed.
2.2.2. Data Collection of Soil Parameter
The soil parameters include the following characteristics: Total porosity (TP), field capacity (FP), antecedent soil moisture (ASM), infiltration rate descriptors (FC and A) and infiltration exponent (P). The soil parameters are classified according to it’s soil group. To determine the soil group in the research location, a soil survey had been carried out.
2.2.2.1 Total Porosity (TP) and Field Capacity (FP)
Total Porosity (TP)
Total porosity of a soil is defined as: TP = 100 - (BD/D) *100, where; TP = Total porosity, percent BD = Bulk density
PD = Particle density (assumed to be 2.65)
Field Capacity (FP)
Field capacity is determined using Bouyoucus method. Where a saturated soil sample is put under 1/3 atm air pressure. The respective soil moisture is determined using dry weigh method. Field capacity is expresed in percent of saturation.
2.2.2.2.Antecedent Soil Moisture (ASM)
The form of the moisture balance equation is:
ASM = ASML + RAIN - ET - RO - PERC, where:
Antecedent soil moisture is expressed in percent of saturation.
2.2.2.3.Infiltration Rate Description (FC and A) and Infiltration Exponent (P)
Infiltration rate description is very important parameter in ANSWERS Model. The steady state infiltration rate (FC) indicates the rate at which the soil will absorb water when the soil is saturated. The difference between the maximum and steady state infiltration rates (A) combined with the infiltration exponent (P) helps to describe the typical exponential “drawdown” of the infiltration rate.
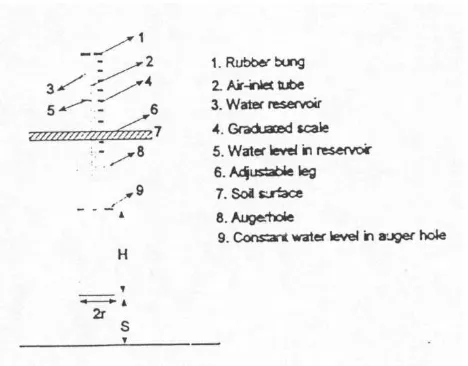
The detail assembly is show in Figure 2.4. The water is infiltrated/transmitted from a simple constant head parameter, consisting of two concentric tubes provided with a set of vertically adjustable legs, into a slightly wider auger-hole.
Figure 2.4. Sketch of Simplified Well Permeameter Assembly (not to scale)
The results of the permeability data are used to determine the steady state infiltration by the following manner
- The midpoint of the upper 2/3 of the range is assumed to be the maximum rate. - The value of A is equal to the maximum rate minus FC.
2.2.3 Data Collection of Land Use and Surface Parameter
The land use and surface parameters consists of the following components: Interception parameters (PIT and PER), surface storage descriptors (HU and RC)
2.2.3.1 Interception Parameters (PIT and PER)
Potential interception volume (PIT) describes the volume of moisture that could be removed if the area were completely covered by that crop. The actual percantage of cover (PER) assumes the non-covered area has no interception. The actual percentage of cover (PER) is defined as:
PER = (Pa/Pp) *100%, where; PER = actual percentage of cover
Pa = actual coverage area of sampled location Pp = potential coverage area.
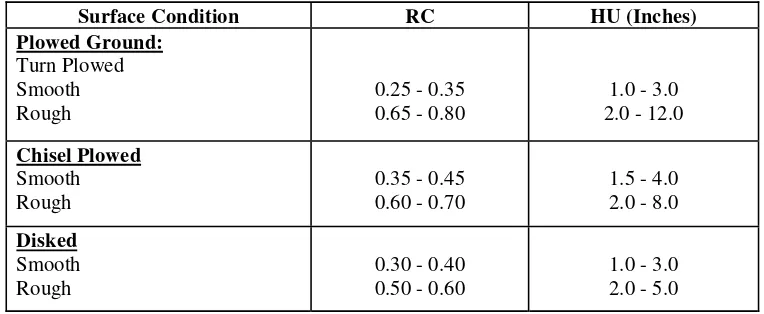
2.2.3.2 Surface Storage Descriptors (HU and RC)
Table 2.1.Typical Value of Roughness Coefficient (HU) and Maximum Roughness Height (HC)
Surface Condition RC HU (Inches) Plowed Ground:
Remarks: RC = Roughness coefficient; HU = Maximum roughness height
2.3. Hydrological Analysis
2.3.1. Rainfall
Historical rainfall data 1975-1997 were collected from 3 rainfall stations: Sumberjaya (R 234), Fajarbulan (A 12), and Air Hitam (R 248). Regional rainfall data were analyzed to find mean rainfall of the study area using Thiessen Polygon method. Variability of the rainfall is indicated by its coefficient of variation
CV = standart deviation/mean
2.3.2. Stream flow
Stream flow data were collected at Sumberjaya stream gauge station which is located at 05 00 S and 104.29.00 W. Historical data (1975-1997) from this station were analyzed. In this report the analysis include average annual stream flow using arithmatic mean, minimum discharge (Q
III. RESULT AND DISCUSSION
3.1. Sediment Transfer across Filter Strips
3.1.1. Description of Filter Strips and Land Use Type
General characteristics of the measured filter strips and adjacent land use are presented in Table 3.1. Filter strips and its corresponding land use type vary greatly in their characteristics. All filter strips tend to have more gentle slope and higher canopy coverage as compared to its upper land use. The same land use type does not necessarily have similar filter strips. Natural forest generally covers the upper part of the slope and tend to have no representative filter strip or field boundary. This suggests that filter strips are usually established by human activities, especially when they cultivate the land.
Natural forest generally has the densest vegetative coverage both in canopy and basal cover, followed by calliandras, multistrata systems, unweeded coffee gardens, clean weeded coffee gardens, and tegalan with horticultural crops. Coffee gardens vary in coverage especially due to differences in their age and arrangement. Some coffee gardens have small ridges that follow the crop rows. In tegalan with horticultural crops, most crops are planted on small ridges (guludan)t along the slope. The newly cleared land (the former natural forest) has no canopy cover, but since the falling trees are left and still remain on the field, its basal cover (especially litter) are very high.
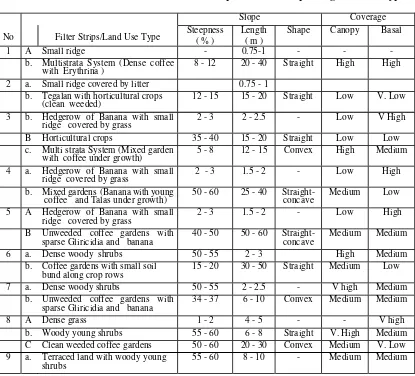
Table 3.1 Characteristics of Various filter strips and its corresponding Land Use Type
Slope Coverage
b. Tegalan with horticultural crops
(clean weeded) 12 - 15 15 - 20 Straight Low V. Low 3 b. Hedgerow of Banana with small
ridge covered by grass 2 - 3 2 - 2.5 - Low V High B Horticultural crops 35 - 40 15 - 20 Straight Low Low c. Multi strata System (Mixed garden
with coffee under growth) 5 - 8 12 - 15 Convex High Medium 4 a. Hedgerow of Banana with small
ridge covered by grass 2 - 3 1.5 - 2 - Low High b. Mixed gardens (Banana with young
coffee and Talas under growth) 50 - 60 25 - 40 Straight-concave Medium Low 5 A Hedgerow of Banana with small
ridge covered by grass 2 - 3 1.5 - 2 - Low High B Unweeded coffee gardens with
sparse Gliricidia and banana 40 - 50 50 - 60 Straight- concave Medium Medium
6 a. Dense woody shrubs 50 - 55 2 - 3 High Medium
b. Coffee gardens with small soil
bund along crop rows 15 - 20 30 - 50 Straight Medium Low 7 a. Dense woody shrubs 50 - 55 2 - 2.5 - V high Medium
b. Unweeded coffee gardens with sparse Gliricidia and banana
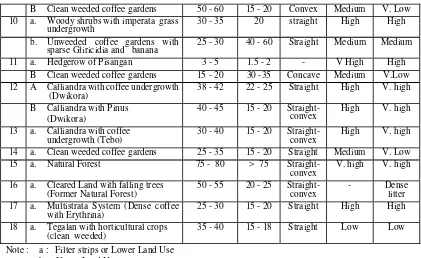
B Clean weeded coffee gardens 50 - 60 15 - 20 Convex Medium V. Low 10 a. Woody shrubs with imperata grass
undergrowth 30 - 35 20 straight High High
b. Unweeded coffee gardens with
sparse Gliricidia and banana 25 - 30 40 - 60 Straight Medium Medium 11 a. Hedgerow of Pisangan 3 - 5 1.5 - 2 - V High High
B Clean weeded coffee gardens 15 - 20 30 -35 Concave Medium V.Low 12 A Calliandra with coffee undergrowth
(Dwikora) 38 - 42 22 - 25 Straight High V. high 16 a. Cleared Land with falling trees
(Former Natural Forest) 50 - 55 20 - 25 Straight-convex - Dense litter 17 a. Multistrata System (Dense coffee
with Erythrina) 25 - 30 15 - 20 Straight High High 18 a. Tegalan with horticultural crops
(clean weeded) 35 - 40 15 - 18 Straight Low Low Note : a : Filter strips or Lower Land Use
b : Upper Land Use
Natural forest which generally covers the upper part of the hill, has a very steep slope ( 75 % to over 80 %). Calliandra covers the area with slope steepness vary from 30 % to 45 %. Coffee gardens and tegalan with horticultural crops areas has a very high variation on slope steepness. In this experiment, selected Coffee gardens occupy the area with slope steepness, range from 8 % to over 60 %, whereas horticultural crops occupy the area that relatively gentle slope (about 12 %) to relatively steep slope (up to 40 %). Coffee and horticultural crops on steep slope seems to have a high soil erosion and may become a major problem in the area. Field observations indicated that some newly cleared land with young coffee are progressively increasing the area.
3.1.2 Effect of Filter Strips on Sediment Transfer
The effect of filter strips on sediment transfer is assumed as the differences between sediment yield on the upper site and that on the lower site of filter strips (percent of decrease). This differences represent the amount of of sediment that are trapped due to the presence of a filter strip. Therefore, the differences can actually represent the effectiveness of filter strips in reducing sediment transfer across filter strips.
Result of the experiment shows that effectiveness of filter strips in trapping sediment vary significantly. As shown in Table 3.4, hedgerow of banana that planted in a small ridge with grasses undergrowth tends to show the highest value of trap efficiency, followed by terraced land covered by shrubs, hedgerow of pisangan, shrubs, and small ridge. This results indicate that characteristics of filter strips and its corresponding upper land use have a considerable effect on sediment transfer.
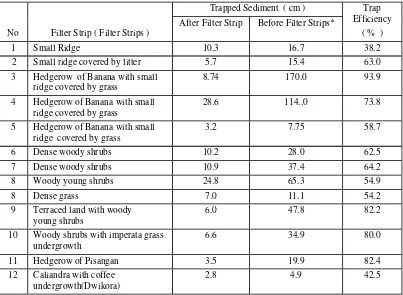
Table 3.2. Trap efficiency of various filter strip as compared to that on upper land use
Trapped Sediment ( cm )
No Filter Strip ( Filter Strips )
After Filter Strip Before Filter Strips*
Trap ridge covered by grass
3.2 7.75 58.7
10 Woody shrubs with imperata grass undergrowth
6.6 34.9 80.0
11 Hedgerow of Pisangan 3.5 19.9 82.4
12 Caliandra with coffee undergrowth(Dwikora)
2.8 4.9 42.5
*) at upper land use
Figure 3.1. Trap efficiency of Shrubs and Young Shrubs Over 312 days of observation
The results of the experiment also shows that small ridge constructed across the slope (about 20 cm high and 75 m wide) can also significanly reduce sediment yield about 38.2 % (Table 3.2). The small ridge reduce surface run-off transport capacity which in turn reduce erosion and increase deposition. Though sediment yield decreases, the value of trap efficiency is not high enough. Since the soil on the ridge are not protected adequately against raindrop impact, soil erosion on the ridge still occurs. The presence of litter or basal cover that protect the ridge against raindrop impact will significantly improve the function of the ridge in reducing soil erosion as shown by the field boundary No 2.
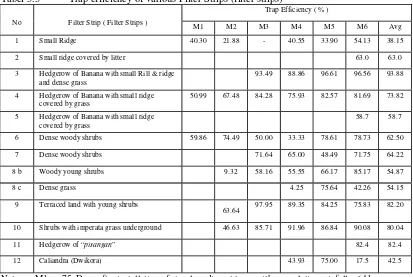
Tabel 3.3 Trap efficiency of various Filter Strips (filter strips)
Trap Efficiency ( % )
No Filter Strip ( Filter Strips )
M1 M2 M3 M4 M5 M6 Avg
1 Small Ridge 40.30 21.88 - 40.55 33.90 54.13 38.15
2 Small ridge covered by litter 63.0 63.0
3 Hedgerow of Banana with small Rill & ridge and dense grass
93.49 88.86 96.61 96.56 93.88
4 Hedgerow of Banana with small ridge covered by grass
50.99 67.48 84.28 75.93 82.57 81.69 73.82
5 Hedgerow of Banana with small ridge covered by grass
9 Terraced land with young shrubs
63.64 97.95 89.35 84.25 75.83 82.20
10 Shrubs with imperata grass underground 46.63 85.71 91.96 86.84 90.08 80.04
11 Hedgerow of “pisangan” 82.4 82.4
12 Caliandra (Dwikora) 43.93 75.00 17.5 42.5
M3 : 15 Days after M2, with cumulative rainfall 156 mm M4 : 32 Days after M3, with cumulative rainfall 132 mm M5 : 53 Days after M4, with cumulative rainfall 202 mm M6 : 75 Days after M5, with cumulative rainfall 259 mm
The result of the experiment also shows that the effectiveness of calliandra with coffee undergrowth in trapping sediment is not as high as it is expected. The average value of trap efficiency is only 42.5 %, slightly higher than that of small ridge with no litter and significantly lower than that of the others. Low value of trap efficiency on calliandra is apparently due to similarities of the characteristics of the filtersStrips to that of upper land use (calliandra with pinus). Besides, low sediment yield from upper land use might also be the reason for this low trap efficiency.
3.1.3. Sediment Yield (Trapped sediment) on Various Land Use Types
Sediment yield in this experiment were obtained by measuring the depth of trapped sediment (in cm) in the simple sediment trap in a given time. Sediment yield on various representative Land use types as measured at some periods of are shown in Table 3.4.
Table 3.4. shows that land use type with different vegetative coverage has a significant effect on sediment yield. Sediment yield in tegalan with horticultural crops is considerably higher than that on other land use types. Second largest of sediment yield is resulted from clean weeded coffee gardens, then followed by unweeded coffee gardens, multistrata systems, newly cleared land with the falling trees, calliandra, and natural forest.
Tegalan with horticultural crops, though has relatively gentle slope and short slope length has the highest sediment yield. Cultivating the soil with ridges and furrows along the slope for better drainage and aeration which is commonly practiced in this horticultural crop fields increases soil erosion and hence, sediment yield. The presence of ridges contructed along the slope allow run off to flow concentratedly, and this will increase its destructive force and transport capacity.
Furthermore, tegalan with horticultural crops has high exposure to raindrop impact due to its low coverage.
Table 3.4 also shows that sediment yield in Coffee gardens vary significantly. Clean weeded coffee gardens shows significantly higher sediment yield than other type of coffee gardens. Mixed coffee gardens with different canopy strata that have dense litter/ basal cover generally have low sediment yield even in steep slope. Mixed gardens with low density and low coverage of basal cover/ litter cover, on the other hand, have higher sediment yield ( Table 3.4). Sediment yield in mixed garden with low basal cover and medium canopy cover (No 4b) is 19.9 cm; it is much higher than sediment yield in other multistrata systems.
Table 3.4 Sediment Yield (Trapped Sediment) of Various Land Use Types
Sediment Yield ( cm )
No Land Use Type/Filter Strips M1 M2 M3 M4 M5 M6 Cum*
a Small ridge 4.00 2.50 0.50 1.07 1.17 1.10 10.3
1 b. Multistrata System (Dense coffee with Erythrina)
6.70 3.20 0 1.80 1.77 3.27 16.74
a Small ridge covered by litter 5.66 5.7
2 b. Tegalan with horticultural crops (clean weeded)
15.40 15.4
a. Hedgerow of Banana with small ridge covered by grass
4.50 1.17 1.67 1.10 8.8
b. Horticultural crops 69.10 10.50 49.30 40.70 170.0
3
c. Multistrata System (Mixed garden with coffee undergrowth)
a. Hedgerow of Banana with small ridge covered by grass
15.00 4.00 2.83 2.37 1.18 .24 28.6
4
b. Mixed gardens (Banana with young coffee and Talas under growth)
50.60 12.30 18.00 8.64 6.77 17.70 114.0
a. Hedgerow of Banana with small ridge covered by grass
3.20 3.2
5
b. Unweeded Coffee gardens with sparse Gliricidia and banana
7.75 7.8
a. Hedgerow of banana with dense woody shrubs
6.50 0.50 0.67 1.00 0.83 0.67 10.2
6
b. Coffee gardens with small soil bund along crop rows
16.20 1.94 1.33 1.50 3.88 3.15 28.1
a. Dense woody shrubs 4.40 1.50 1.70 3.33 11.0
7 b. Unweeded Coffee gardens with sparse Gliricidia and banana
18.10 4.23 3.27 11.8 37.4
a. Dense grass 3.83 0.67 2.50 7.0
b. Woody young shrubs 10.70 3.00 4.00 2.75 4.33 24.8
8
c. Clean weeded Coffee gardens 11.80 7.17 9.00 8.13 29.20 65.3
a Terraced land with woody young shrubs
2.88 0.33 1.15 0.20 1.45 6.0
9
b Clean weeded coffee gardens 5.50 24.20 10.80 1.27 6.00 47.8
a Woody young shrubs 3.40 0.50 1.16 0.25 1.24 6.6
10 b. Unweeded Coffee gardens with sparse Gliricidia and banana
6.30 3.50 10.70 1.90 12.50 34.9
11 a Hedgerow of Pisangan 3.50 3.5
b Clean weeded coffee gardens 19.90 19.9
a. Calliiandra with coffee undergrowth (Dwikora)
13 a. Calliandra with coffee underground (Tebo)
17 a. Multistrata System (Dense coffee with Erythrina over growth)
7.50 1.17 1.33 1.72 0.80 6.20 18.7
18 a. Tegalan with horticultural crops (clean weeded)
soil erosion than high canopy cover.
Calliandra (in former coffee gardens) has a relatively low sediment yield. As compared to coffee gardens, sediment yield and/ or soil erosion on calliandra is much lower even though slope steepness on calliandra is higher than that on coffee gardens. This is because vegetative coverage (especially basal cover) of calliandra is higher than that of coffee gardens (Table 3.1).
Cleared land with falling trees (in former natural forest) has a relatively low sediment yield (Table 3.4). Sediment yield in cleared land with falling trees is quite similar to that from natural forest. Very high litter and basal cover after clearing (because the fallen trees are left on the field) is apparently the main reason for this low sediment yield. This result suggests that cleared land without removing tree remnant can still effectively maintain soil condition.
Natural forest, despite its very steep slope, has the lowest sediment yield. Dense canopy cover with very good stratification of its canopy coverage as well as high basal cover (especially of litter) seems to be the reason for such a low sediment yield in natural forest. Furthermore, soil in natural forest without human intervention tend to have high organic matter content and good soil physical properties (crumb to granular structure and good porosity that lead to high infiltration capacity).
3.1.4. Soil Erosion from Some Representative Land Use Type
In relation to the amount of sediment yield in a given unit area, sediment yield resulted from simple sediment traps are of little value. Therefore, as a comparison, soil erosion from some representative land use type were also measured in small erosion plot. Soil erosion measured using small erosion plot are presented in table 3.5.
Table 3.5 shows that clean weeded coffee gardens have the highest soil erosion, followed by unweeded coffee gardens, multistrata system, calliandra, and natural forest . This tendency is quite similar to that from sediment yield measurement as previously discussed.
Table 3.5. Soil erosion and run-off on some representative land use type
Sediment were collected 5 times from 9 December 1999 to 24 January 2000 with total rainfall 97 mm
Soil erosion on natural forest and calliandra is significantly lower than that of other land use types, even though the slope on these two land use types are steeper. These two land use type are characterized by dense and very good distribution of canopy strata so that its effectiveness to intercept raindrop impact is very high. This characteristic is apparently the main reason for such a low soil erosion. Furthermore, relatively low human intervention in these two land use types maintain high soil organic matter content and high infiltration capacity; therefore off is low. Result of run-off measurements support this argument (Table 3.5). Run-run-off from natural forest and calliandra are lower than that from other land use type.
Table 3.5 also shows that soil erosion from unweeded coffee gardens can also be low and similar to that of multistrata systems or even to that of natural forest. This is because grass and litter under coffee gardens are very dense; the litter and grasses can effectively protect the soil from raindrop impact. This result suggests that-apart from possibility of nutrient competition-weed and litter in coffee gardens play a positive role in reducing soil erosion.
3.2. ANSWERS Model
To run the ANSWERS model an extensive field data collection has been carried out. This include among others are topographic survey, soil survey, sampling for soil physical characteristics, measurement of infiltration descriptors and land use survey. Those data were distributed to the corresponding elements in the model. Data collection and data entry are the most tedious work in running ANSWERS Model.
Application of ANSWERS Model
Input formation for the ANSWER Model contains the following types of data : - Rainfall characteristics
- Soil Parameters - Land use characteristics
- Individual element information (location, topography, drainage, soils, land use and BMP’s)
The individual element information is the largest body of data and the most time consuming to collect.
To run the ANSWERS model an extensive field data collection has been carried out. This include among others are topographic survey, soil survey, sampling for soil physical characteristics, measurement of infiltration descriptors and land use survey. Those data were distributed to the corresponding elements in the model. Data collection and data entry are the most tedious work in running ANSWERS Model.
3.2.2 Soil Parameters
Four soil types were identified at the research location. Infiltration descriptors (FC, A and P) is a very important component of soil parameter. Steady state infiltration (permeability) using permeameter equipment has been measured in 55 location. The description of soil parameters for each soil types presented in Table 3.6.
Table 3.6. Description of Soil Parameters for Each Soil Types
Soil Parameters
P = Infiltration component DF = Infiltration control depth zone ASM = Antecedent soil moisture FC = steady state infiltration rate A = Diference between maximum
steady state infiltration rate
3.2.3 Land Use Characteristics
Existing land use at the research location is grouped into 8 types. The characteristics of each land use type is shown in Table 3.7.
Table 3.7. The Characteristics of Each Land Use Type
Land Use Parameters Remarks: PIT = Potential interception volume
PER = Percentage of surface covered by specific land use RC = Roughness coefficient
HC = Maximum roughness heigh N = Manning’s n
3.2.4. Individual Element Information
The catchment is divided into 630 element having 5 x 5 m in size. The element is established from topographic map and field check with scale of 1:250. Only one rainfall station is available at the research location.
3.2.5. Predicted Run-off and Erosion in the Unila Catchment with Existing Filter strip
The pattern of sediment and run-off prediction of ANSWERS Model for selected rainfall events are presented in Appendices 18, 19 and 20. Alongside the model results, the observation data of run-off are also presented for comparison. For rainfall event of February 21st, 1999 the measured peak discharge at the outlet is 1.0 mm/h. Meanwhile, the peak discharge predicted by ANSWERS model is 0,95 mm/h. For the rest of the rainfall event there seems to be a large gap between observed and predicted run-off. This large gap could result from the size of the catchment which has an area of only 1.6 ha. As it was mentioned before, the simulation of catchment erosion using ANSWERS model involves many parameters. Some parameters such as infiltration descriptors (FC, A, and P) and surface roughness (HU) are very responsive to the change of the rainfall characteristic. Actually it is impossible to determine the real values of those parameters in a catchment level. The deviation seems always to exist. But in a large catchment the positive and the negative deviation might balance each other. In a small catchment this balancing effect seems to be minor. As a result the predicted and the measured parameters might deviate considerably in a particular characteristic rainfall event.
Nevertheless, the simulation of ANSWERS model to the role of filter strip in sediment trapping seems consistent from one rainfall event to other rainfall event as it is discussed below.
The influence of filter strip in sediment transfer can be judged by observing the result of model simulation at outlet level (Table 3.8) and at selected element level of filter strip under
consideration (Table 3.9). Influence of filter strip on predicted runoff volume and average soil loss at catchment outlet is shown in Table 3.8. In general the filter strip reduce the rate of both parameter.
The ANSWERS MODEL has a built-in procedure to simulate trapping effect of filter strip. These procedures are called Best Management Practices (BMP’s). There are four options of special structural BMP’s included in the ANSWERS model, these are: Ponds, parallel tile-outlet terraces, grass waterways and field boundary . All of those BMP’s have different trap efficiency.
In this research the option of BMP’s used to simulate the effect of filter strip in sediment transfer is field boundary option. The spatial configurations of the existing filter strips are presented in Appendix 21. The filter strip commonly consists of hedgerow of banana with small ridge covered by grass having 35 m in length and 1 m in width. There are two types of filter strips existing in the catchment. The first type of filter strip is perpendicular to the flow direction. The second type is situated to the left and right side of existing channel (see Appendix 21).
Table 3.8. Effectiveness of Existing Filter Strip to Reduce Run-off and Trap Sediment as Predicted by ANSWERS MODEL at Catchment Outlet
Parameter Without Filter strip With Filter strip
1 Runoff volume (mm/h) 0.249 0.222
2. Average soil loss (kg/ha) 14 12
The general trend of role of filter strip in trapping sediment at element level is obvious from Table 3.9.
Table 3.9. Net Erosion or Deposition at Selected Element of Filter strip as Predicted by ANSWERS MODEL
Net Erosion (-) or deposition (+)
before filter strip on the filter strip after filter strip Nr. Rainfall event Nr. Rainfall event Nr. Rainfall event
On the first three selected element before filter strip the net erosion occurs for every rainfall event (Element Nr. 237, 238, and 239). Meanwhile, on the elements of filter strip it’s self net deposition occurs (Element Nr. 263) or net erosion become lesser (Element Nr. 264, and 265) due to the trapping effect of filter strip. Some elements of the filter strip (for example element Nr. 285) do not show any trapping effect. This might have been caused by the fact , that the deposition is not merely stimulated by filter strip. Other factors like degree of slope changes in steepness, the presence of rough terrain which are expressed by parameters of roughness coefficient (RC) and roughness height (HU) could induce deposition as well.
Trap Efficiency of Filter strip
The efficiency of filter strip in trapping sediment in element scale vary considerably from one element to another element. For example, the incoming erosion to the element Nr. 263 amounts to 63 kg/ha. This amount of material will be deposited as many as 53 kg/ha, the trap efficiency is therefore 84% (assuming that the element Nr. 263 receives material exclusively from its upper neighbouring element). This trap efficiency is in order of magnitude with result obtained from field experiment of first research. On the other case, the incoming erosion to the element Nr. 265 amounts to 100 kg/ha, the amount of material deposited in the element Nr. 265 is only 9 kg/ha. This case reflects a lower trap efficiency. This variety is attributed to the difference in rainfall characteristics and other factor like degree of slope changes in steepness, the presence of rough terrain which are expressed by parameters of roughness coefficient (RC) and roughness height (HU).
3.2.6. Simulation of Filter strip Role in Sediment Transfer
Filter strip might consist of combination of different types of vegetated strips ranging from hedgerow of banana to tree crops. In an effort to reduce sediment yield by applying agroforestry practices, the following question often arises: how should the configuration of tree crop strips in the field be laid to increase its effectivity to trap sediment.
Schematic Configuration of Filter strip
Average Soil Loss (kg/ha) Run-off (mm/H)
1
12 0.219 2
11 0.217 3
13 0.230 4
12 0.222 5
12 0.218
Remarks :
Channel Catchment Boundary
Filter strip
According to some literatures (Van Noordwijk,1998), the position (configuration) of the tree crop strips is more important than the percentage of coverage. In this research the ANSWERS model is used to simulate the effect of different position (configuration) of filter strip on average soil loss and run-off. Five different types of synthetic field boundaries are used in the simulation process. The relative position of each filter strip to the direction of flow are presented in Appendices 22, 23, 24, 25, and 26. The results of the simulation are presented in Table 3.10.
3.3. Hydrological Analysis and Effect of Land Use Change on Streamflow Characteristics of Upper Way Besay Catchment
3.3.1. Hydrological Analysis
3.3.1.1.Rainfall
The rainfall over the Way Besay Upper Catchment is primarily characterized by high
intensity convection storms of short duration and limited aerial extend. These storms usually occur as the result of warm air raising off the land mass in the late afternoon.
The rainfall in the Way Besay Upper Catchment has been studied and the result are presented in the following section.
Annual Rainfall
The average long term annual rainfall on the Upper Way Besay Catchment is about 2589 mm. This long term average was obtained from Thiessen polygonal generation of annual rainfall from Air Hitam, Fajar Bulan and Sumber Jaya rainfall station during observation period of 1975-1998. Coefficient of variation for the 24 years observation is 0.16. This indicates that the annual rainfall variation of the study area during period of observation is relatively small and it might be considered that there has been no significant climatic change during that period.
Monthly Rainfall
The monthly variation in rainfall is large with a definite wet season extending from
November to May (Figure 3.2.). The wettest months are spread evenly between December to March and the driest month are July and August.
Daily Rainfall
Heavy rainfall over the Upper Way Besay Catchment is usually caused by high intensity convective storms of short duration and limited areal extend. The maximum daily rainfall recorded at the representative rain gages vary between 35 mm to 83 mm. During 24 years observation (1975-1978), the lowest maximum rainfall occurs in 1990 and the highest one occurs in 1985.
3.3.1.2.Streamflow
The quantity and distribution of streamflows are essentially dependent on rainfall,
evapotranspiration, and physical characteristics of a catchment. Vegetation cover and land use type will strongly influence streamflow; therefore any changing in land use will affect the streamflow. The Upper Way Besay Catchment has a drainage area of 38900 ha.
Mean Flows
The average annual streamflow or total water yield at the study area (1975-1997) is 20.2 m3/second or 650 million m3/year from drainage area of 389 km 2. It is about 63.7% of the average annual rainfall of the study area, where the average rainfall is 1007 million m3. Variability of the total water yield ranged from 513 million m3/year to 781 million m3/year with a coefficient of variation of 0.15.
The average mean monthly stremflow in 1975-1997 is presented in Figure 3.8 and the mean monthly streamflow of period 1975, 1980, 1985, 1990, and 1995 are depicted in figure 3.9. Stream flow represented 54%, 60%, 61%, 61% and 75% of rainfall for the respective years.
Minimum and Maximum Flows
Table 3.11. The minimum and maximum flow of 1975, 1980, 1985, 1990, 1995
Year Qmin Month of occurrence Qmax Month of occurrence Ratio
1975 8.1 July 44.3 February 5.4
1980 9.5 August/September 38.8 December 4.1
1985 10.9 August/September 36.3 April 3.3
1990 3.9 November 30.3 February 7.7
1995 7.2 September 56 March/April 7.8
3.3.1.3. Rainfall-Run Off Relationship
The rainfall-runoff relationship in 1975, 1980, 1985, 1991, and 1995 are presented in Figure 3.12. The base flow in these figures were separated from the total stream flow using the straight line method.
3.3.2. Effect of Land Use Change on Streamflow Characteristics
Land Use Change
Table 3.12. Changes in percentage of land use system from 1970 to 1990*)
Syam et al (1997) said that in period 1970 most of the study area was occupied by dense forest (57%) followed by underbrush forest (12%), upland area under shifting cultivation (9.4%) and grassland (9%). Crops and vegetables is 5% and paddy fields accounted for less than 1%. No plantation area was found in 1970.
In 1978, the area under dense forest decreased substantially from 57% to 33%. The underbrush forest increase from 12% to 16% and grassland increase from 9% to 18%. Plantation areas were found and had occupied 21% of the total area. Based on stream flow characteristics data of 1980, these land use changes were followed by the increase of ratio of total runoff to rainfall from 54% in 1975 to 60%. The surface runoff increase from 9 to 10% and the base flow increase from 45 to 50%. Lack of stream flow data of 1970, and land use data between 1970-1978 caused the loss of the very important information of the early stage of land use changes especially from dense forest and under brush forest to plantation and grass land. Transmigration was believed to be the major driving force for the land use changes in Lampung which started in 1970s. 15% of total transmigrant were located in Lampung during this period. At the same time two remarkable land use changes were found.
Streamflow characteristic and land use change
Table 3.13. Water balance of the study area for the year 1975, 1980, 1985, 1991 and 1995.
Year Component Unit
1975 1980 1985 1991 1995
Rainfall (mm) 2531 2797 2959 2459 2663
Total Runoff (mm) 1369 1678 1793 1718 2001
(mm) 237 293 382 374 342
Surface Runoff
(Quick flow) % to rainfall 9 10 13 15 13
(mm) 1132 1385 1411 1344 1659
Base flow
A “positive” correlation between land use change in period 1970-1978 with base flow may be explained that at the end of this period, as being recorded in 1980, the plantation area had been stable (almost 10 years old) so that a good coverage and rooting system as well as other supporting factors which conducive for infiltration had been well established. This “positive” correlation however, was not reached in the 1985. Table 3.13 shows that since 1985 to 1995 the ratio between total runoff to rainfall tend to increase from 60% in 1980 to 61% in 1985, the surface runoff increase from 10% in 1980 to 13% in 1985, while the base flow decrease from 50 to 48%. This condition correlates with some land use changes occurred during that period. Based on table 3.12 since 1984 total plantation area are doubled and become the largest cover of the study area while area under forest and
underbrush forest decreased to 21% and 11% respectively and became 11% and 18% respectively in 1990. In 1990 mix plantation increase to 19% from only 1% in 1980, the grass land decreased from 17% in 1984 to 1% in 1990. Most of the grass land were converted to mixed plantation during this period.
IV. CONCLUSION
1. Sediment yield was significantly influenced by land use type. Natural forest had the lowest sediment yield, followed by Calliandra (in former coffee gardens), Cleared land with falling threes (in former natural forest). Multi strata systems, unweeded coffee gardens, clean-weeded coffee gardens and tegalan with horticultural crops. The presence of litter or basal cover on a land use significantly reduced sediment yield.
2. The presence of vegetative filter strips in the field decreased sediment yield. The effectiveness of a filter strip in trapping sediment yield (filter efficiency) varied depending on the characteristics of the field boundary and upper land use from 38 – 95%, thus letting only 62 - 5 % of the suspended sediment pass through, or reducing the sediment outflow by a factor 1.5 to 20. A hedgerow of banana with a small ridge covered by grass showed the highest sediment trap efficiency, followed by a hedgerow of “Pisangan”, terraced land with woody young shrubs, woody shrubs with imperata grass undergrowth, dense woody shrubs, small ridge covered by litter, calliandra with coffee undergrowth, and a small ridge with no litter and basal cover.
3. The presence of litter and basal cover that result in good vertical distribution of vegetative coverage can significantly increase the sediment trap efficiency of a filter strip.
4. The ANSWER Model can be used to simulate the effect of filter strips on sediment transfer. The different effectivity of filter strip in trapping sediment can be accommodated by reprogramming and re-compiling the existing sub-routines in the ANSWER Model.
5. The rainfall at study area is relatively homogenous and the variability of annual rainfall relatively small.
V. REFERENCES
Beasley, D.B., and L.F. Huggins. 1991. ANSWER (Areal Nonpoint Source Watershed Environment Response Simulation). User’s Manual. Secon Ed. USDA
Daniels, R.B. and J.W. Gilliam. 1996. Sediment and Chemical Load Reduction by Grass and Riparian Filter. Soil Sci. Soc. Am. J. 60:246-251.
Israelson, O.W. and V.E. Hansen. 1976. Irrigation Principles and Practice. Third Ed. Jphn Wiley & Son, Inc. New York.
Noordwijk, M. can, M. can Roodes, E/L/ McCallie, and B. Lusiana. 1998. Soil Erosion and Sedimentation as Multiscale, Fractal, Process: Implication for Models Experiments and The Real World. P 223-253. In: P.W.T. Penning de Vries, F. Agus, and J. Kerr (eds). Soil Erosion at Multiples Scales: Principles and Methods for Assessing Causes and Impacts. IBSRAM. CABI Publishing.
Syam, T.H. Nishide, A.K. Salam, M. Utomo, A.K. Mahi, J. Lumbanraja, S.G. Nugroho, and M. Kimura. 1997. Land Use and Land Cover Changes in Hilly Area of South Sumatra, Indonesia (from 1970 to 1990). Soil Sci. Plant Nutr., 43(3): 587-599.
10 - 12 m
Note: the figure is not to scale
Appendix 1. Small ridge as a field boundary in multi strata system (dense coffee with Erythrina overground)
Horticultural Crops
( Tobacco and chilly)
- Crops are in small ridges
- ridges follow the slope
Slope Steepness ( 80 - 100 cm wide )
12 - 15 % - young coffee scarsely scattered - coffee height : 0.5 m
Small ditches as a field boundary
15 - 20 cm high
Slope Direction 30 - 50 cm wide
Small ridge as
a field boundary
1.2 1.5 1.0 1.4 15 - 20 cm deep 20 - 25 cm wide
Simple sediment traps
2.0 1.0 1.6 2.9
15 m
- ridges are constructed along the slope
Hedgerow of banana with grass as a field boundary
Appendix 3. Hedgerow of banana with small ridge covered by grass as a field boundary, tegalan with horticultural crops, and multi strata system ( mixed gardens )
Mixed Gardens
( Banana with young coffee and talas underground ) - medium canopy cover - coffee distance : 2 x 2 m - coffee height : 0.5 - 1 m Slope direction - talas are scarcely scattered
- banana : 8 x 8 m 50 - 60 %
- Hedgerow of banana with
40 m grass underground as
a field boundary
- banana and grass are growth in small ridge - Plant residue of banana are incorporated to the ridge - slope steepness 2 - 3 %
Simple sediment traps
2.8 1.9 0.7 1.2 1.6 3..0 2.4 Group of Bananas
2 m
1 .0 0.7 4.5 3.0 1.5 1.2 1.0
Rice field
Note : figures are not to scale
30-35 m
1.5 - 2 m 20-25 m
2 - 3 %
Unweeded coffee gardens Coffee
- medium canopy - 2 x 2 m distance - 1.5 - 2.5 m high slope direction Other plant 20 - 25 % - glirisidiae
- medium canopy
- sparsely distributed ( random ) Litter / basal cover
- medium coverage
Hedgerow of Banana
40 - 50 % as a field Boundary
- planted on small ridge - covered by grass - low canopy
2.0 3.8 1.6 1.8 - high litter / basal cover
Groups of banana
Simple sediment traps
2.1 1.6 1.2 1.2
rice field
Note : the figure is not to scale
30-35 m
12-15 m
2-2.5 m
2.5 m
Coffee gardens
( with small ridge along crop rows ) - Coffee
Appendix 6. Dense woody shrubs as a field boundary and coffee gardens
Unweeded coffee gardens
Appendix 7. Dense woody shrubs as a filter strip and unweeded coffee gardens
55 %
Drainage channel
Clean weeded coffee gardens
- influenced by erratic water level
1.5 1.6 1.2 1.8 Simple sediment traps
1.6 1.6 1.7 1.8
Note : the figure is not to scale
Clean weeded coffee gardens
( with sparsely scattered banana ) - Coffee
- mediun canopy cover
- 2 x 2.5 m distance
Slope Directions - Banana
- medium canopy cover
50 - 55 % - 8 x 8 m distance - Litter : low
Terraced land with young woody shrubs as filter strip
- 7 individual terraces - 1.2 - 1.5 m wide 2.1 1.5 1.9 1.9 1.8 1.3 1.2 - 50 - 75 cm vertikal inteval
- covered by dense young shrubs
Simple sediment traps
1.5 1.5 1.7 1.5 1.5 1.4 1.2
Note : the figure is not to scale
Appendix 9. Terraced land with woody young shrubs as a filter strip and clean weeded coffee gardens
20-25 m
Note: the figure is not to scale
Clean weeded coffee gardens
Appendix 11. Hedgerow of “pisangan” as a field boundary and clean weeded coffee gardens
Appendix 12. Calliandra with coffee underground at Kampong Dwikora 30-35 m
1.5-2 m 3 - 5 %
17 m
6 m
15 - 20 m
Calliandra with coffee
underground
Appendix 13. Calliandra with coffee underground at Kampong Tebo
Clean weeded coffee gardens
Appendix 14. Clean weeded coffee gardens
Drainage Channnel 15 - 20 m
Natural Forest
- very high canopy cover
- high litter/basal cover
slope direction Simple sediment traps
75 - 80 %
> 75 m
1.1 1.0 1.0 1.4
Appendix 5. Natural Forest
Cleared land
(with the falling trees) - low canopy cover
slope direction - very high litter
50 - 55 %
Simple sediment traps
2.7 2.0 1.9 1.5
Appendix 16. Cleared land with the remnant falling trees (the former natural forest)
> 75 m
Multi strata system
( coffee, erythrina, jambu etc ) - Coffee
good canopy
2 - 2.5 m high
Slope direction 2 x 2 m distance - Others
15 - 20 % good canopy
> 5 m high
distributed randomly
- Litter
dense ( high coverage )
Simple sediment traps
1.6 4.0 2.0 4.0
Note : the figure is not to scale
Appendix 17. Multistrata system ( Erythrina with dense coffee underground )
25-30 m
Appendix 27. Data of sediment yield on small ridge and Multistrata System
Multistrata system (Erythrina with coffee undergrowth )
1 5 3 0.5 1.7 0.3
Appendix 28. Data of sediment yield on small ridge and Horticultural crops
Appendix 29. Data of sediment yield on Hedgerow of banana, Horticultural crops and Multisytrata system (Coffee gardens with other trees overgrowth)
Field Sediment Depth of Sediment ( cm )
Land use Traps M1 M2 M3 M4 M5 M6 Total
Hedgerow of banana
1 3.5 0 2.5
2 3.2
3 0.5
4 6 1.5 1 0.5
5 4 2 1.5
Average 4.5 1.17 1.67 1.4 8.74
Dev 1.08 0.85 0.62 1.27
Horticultural crops
1 28 7.5 26 36.5
2 14.5 13.5 72.5 6
3 101 96.5
4 100 6.2
5 102 58.5
Average 69.1 10.5 49.25 40.74 169.6
Dev 39.31 3.00 23.25 34.18
Coffee Gardens
1 0.5 0.8 0.2
2 2.5 2.2 5.3
3 1 0.5 2
4 0 1.3 1.2
5 1.5 0.5 5
Average 1.1 1.06 2.74 4.9