BSA and Fibrinogen Adsorption on Chitosan/
k
-Carrageenan Polyelectrolyte Complexes
Thiane N. Carneiro, Denise S. Novaes, Rodrigo B. Rabelo, Betul Celebi,
Pascale Chevallier, Diego Mantovani, Marisa M. Beppu, Rodrigo S. Vieira*
PECs of chitosan/
k
-carrageenan are prepared in three different volumetric rations. The
complex formation is characterized in order to evaluate the blending formation. Blood
compatibility is evaluated by protein adsorption (BSA and fibrinogen) and PEC toxicities
are determined with fibroblast cell viability
and proliferation. The swelling degree of PECs
decreases when the amount of chitosan
increases. Due to the linked film formation,
PECs decrease BSA adsorption and increase
fibrinogen adsorption when compared to the
pristine chitosan and
k
-carrageenan films.
Although pristine chitosan and
k
-carrageenan
films produced similar cell expansion and
viabil-ity, the PEC 50:50 vol% chitosan/
k
-carrageenan
PEC may be acceptable as a new scaffold for
cell therapies, due to their effect on cell
survival.
1. Introduction
Polyelectrolyte complexes (PECs) are formed by mixing polysaccharides of opposite charges in an aqueous solu-tion.[1]This network is formed by ionic interactions and is characterized by a hydrophilic microenvironment with a high water content and electrical charge density.[2]Such complexes could be used as biomaterials for applications in blood contact, such as the production of artificial hearts, catheters, endovascular stents, hemodialysis membranes, chemical sensors, and vascular implants. However, most of these applications are limited by the thrombogenic characteristics of polymeric surfaces, leading to the requirement for anti-coagulant therapy by the patient.
Chitosan is a polycationic biopolymer, obtained by alkaline deacetylation of chitin, which is the main component of the exoskeleton of crustaceans.[2] This T. N. Carneiro, D. S. Novaes, Prof. R. S. Vieira
Departamento de Engenharia Quımica, Universidade Federal do Ceara, Centro de Tecnologia, Av. Mister Hull, s/n, Campus do Pici, Bloco 709 Pici, CEP 60455-760 Fortaleza, CE, Brazil
E-mail: [email protected] R. B. Rabelo, Prof. M. M. Beppu
Faculdade de Engenharia Quımica, Departamento de
Termofluidodin^amica, Universidade Estadual de Campinas, Rua Albert Einstein, FEQ, Bloco A, Barao Geraldo, CEP 13083-970 Campinas, SP, Brazil
Dr. B. Celebi, Dr. P. Chevallier, Prof. D. Mantovani
polysaccharide currently is receiving a great deal of attention for use in medical and pharmaceutical applica-tions, due to its favorable physicochemical and biological properties, as this material is biocompatible, non-toxic and antibacterial.[3]Films of chitosan also demonstrate inter-esting mechanical properties.[4]Chitosan is abundant in nature and is also an excellent material for the development of films, spheres, and fibers.[5]This material is insoluble in water but becomes soluble when dissolved in acidic solutions and it has great affinity for other biopolymers with anionic properties in water. However, chitosan has thrombogenic activity on its surface when in contact with blood; its positive charges facilitate the adsorption of plasma proteins such as albumin and fibrinogen at physiological pH, promoting wound-healing.[2,6]
Over recent years, many studies have developed of surface-modified chitosan for specific applications.[3,7–9] The incorporation of negative charges can be an effective way to reduce the thrombogenic properties of chitosan. Hoven et al.[3]showed that surface modifications of chitosan with sulfated groups containing a high negative surface charge have lower amounts of adsorbed proteins than pristine chitosan. However, the process to modify polymer surfaces can involve specific materials there are expensive and difficult to perform reactions. PECs of biopolymers with different charges seem to be appropriate approaches to form antithrombogenic surfaces. PECs of chitosan with different polymers such as gelatin,[10] alginate, xanthan, pectin, heparin, and dextran sulfate have been studied in literature to be used in biomedical applications.[11]
Another polysaccharide of interest is carrageenan, a linear biopolymer (alternating repeating units of
a-D-galactose andL-galactose) that is soluble in water and extracted from red algae. Carrageenan is used in food and pharmaceutical industries in gelling and stabilizing agents, and for microencapsulation and immobilization of drugs and enzymes.[12] The carrageenan structure has ester sulfate groups on the galactose units, which are highly charged groups that repel each other to keep an extended and flexible configuration in the molecule. Depending on the number and position of the ester sulfate groups on the galactose units, the carrageenan isomer is known ask-,l -andi-carrageenan.[4]
k-carrageenan has only one negative group on its structure and presents good properties for developing films. It is thought that negative charges (ester sulfate groups) of the carrageenan contribute to the formation of surfaces with antithrombogenic properties, although such negative charges have a great influence on the swelling properties of materials,[13]which is one of the most important properties of films used for biomedical applications.[14] Due to this charges, k-carrageen have a high swelling ability, reason why it is interesting to form PECs with other polymers that present low swelling properties, in order to have a low swelling degree material.
The electrostatic attraction between cationic groups of chitosan and anionic groups ofk-carrageenan in solution suggest the formation of a polyelectrolyte complex. Chitosan/k-carrageenan PECs have been studied for many biomedical applications, including tissue engineering, cardiovascular devices and also drug delivery systems, being the latter one the most reported application.[1,15–17] Tapia et al.[17]evaluated the possibility of using chitosan/ carrageenan PECs as tablets for drug delivery. The swelling behavior of carrageenan was responsible for the release of the model drug. Spherical matrices of these polymers were also prepared to promote the controlled delivery of theophyl-line.[18]Pinheiro et al.[19]showed that some drugs presented a significant diffusion in chitosan/carrageenan complexes nanolayers using polyethylene terephthalate as support.
The formation of PEC surfaces has the objective of combining some of the characteristics of each polymer in order to form a biocompatible material. The properties of the PECs suggest that a wide set of characteristics of polymers can be linked to constitute a desirable material. Ideally, a biomaterial for blood applications should present chitosan’s mechanical strength and the high negative charge of carrageenan, resulting in a surface with antithrombogenic characteristics. In this case, PECs have the potential to form a biocompatible material that will minimize adsorption of plasma proteins with adequate chemical and mechanical properties, interaction with metal surfaces, and appropriate swelling.
The aim of this study was to prepare and to characterize composite films based on chitosan andk-carrageenan, by different volumetric percentages, to conjugate the high mechanical strength of chitosan and the antithrombogenic properties ofk-carrageenan. The PECs were characterized by Fourier-transform infrared (FTIR) spectroscopy, X-ray pho-toelectron spectroscopy (XPS), scanning electron microsco-py (SEM), atomic force microscomicrosco-py (AFM), and degree of swelling. The adsorption capacity of albumin (BSA) and fibrinogen (FIB) and the albumin adsorption profiles were analyzed at pH¼7.4. Cell viability and proliferation were also analyzed using fibroblasts on the PECs with pristine films as controls.
2. Experimental Section
2.1. Materials
Chitosan with a deacetylation degree of 85% from Sigma (C3646 USA),k-carrageenan from Sigma (22048, USA), BSA from INLAB (Brazil), and fibrinogen from Sigma (USA).
2.2. Preparation of Chitosan Films
undergo the solvent evaporation process until the mass became constant with time, following the method of Beppu and Santana.[20]Subsequently, the films were immersed in a solution
of NaOH (1.0 molL 1) for 24 h in order to neutralize the protonated
amino groups. The films were exhaustively washed with distilled water until all acidic and basic residues were removed. Afterwards the films were dried under vacuum for 2 d.
2.3. Preparation ofk-Carrageenan Films
k-Carrageenan (2.0 wt% was dissolved in water under stirring at 808C for 1 h. The solution was spread into Petri dishes and kept at 608C until a constant weight was reached (6 h). The films were immersed in a 2.0 molL 1KCl solution for 24 h and then washed
with distilled water. Afterwards the films were dried under vacuum for 2 d.
2.4. Preparation of Chitosan/Carrageenan PEC Films
The chitosan solution (2.0 wt% in acetic acid 3.0 vol% was prepared as described in preparation of chitosan films.k-Carrageenan was added to KCl (0.1 molL 1) with a concentration of 2 wt% and
stirred for 1 h for solubilization. These two solutions were mixed under stirring with different volumetric proportions (25Chi/ 75-Car, 50Chi/50-Car, and 75Chi/25-Car) for 24 h. Each solution was then poured into a Petri dish (10 cm diameter) and dried at 608C until the mass became constant with time (5 h). The dried films were placed in a NaOH aqueous solution (0.1 molL 1) for 24 h. The films were dried under vacuum for 2 d at room temperature.
2.5. Analysis by Attenuated Total Reflectance (ATR) FTIR Spectroscopy
FTIR spectroscopy was used to confirm the presence of functional groups and structure modifications between the natural polymers and the PECs in different proportions. Infrared spectroscopy was performed with a Fourier-transform Infrared Spectrometer (Nicolet Magna 550, Thermo-Nicolet, Madison, WI, USA), equipped with a deuterated triglycine sulfate (DTGS) detector and a germanium-coated potassium bromide beam splitter. The depth of analysis is estimated to be 1mm and 100 scans were routinely acquired at a spectral resolution of 4 cm 1. The ATR mode was employed using
split pea attachment (Harrick-Scientific Corp., Pleasantville, NY, USA), equipped with a silicon hemispherical internal reflection element. One sample per period of ageing was analyzed and three different spots were examined on each sample. These analyses were performed in chitosan andk-carrageenan films and also in the PECs.
2.6. Analysis by XPS
XPS spectra were recorded with an X-ray photoelectron spectrom-eter (Physical Electronics 5600). The detection angle was set at 458C and the analyzed area was 0.016 cm2. Charge neutralization was
applied for survey spectra. The X-ray source was run at a power of
300 W, using the Kaline of a standard (non-monochromatized) Al (hn¼1486.6 eV) and Mg (hn¼1253.6 eV).
2.7. SEM
Surface morphology was studied by SEM analysis, using scanning electron microscopy with an X-ray dispersive model Leo 440i energy detector (Cambridge, England). Before being imaged by SEM, the material was sputter-coater with a thin layer of gold model SC7620, VG Microtech (Uckfield, England) with a thickness of 92 ˚A.
2.8. Analysis by AFM
AFM imaging was performed using the tapping mode of a Dimension TM 3100 Atomic Force Microscope (Veeco, Woodbury, NY, USA). The tapping mode was applied using an etched silicon tips (OTESPATM, tip radius<10 nm, aspect ratio1.6/1). The linear
scanning rate was optimized between 0.5 and 1.0 Hz for the tapping mode and scan resolution of 256 samples per line. For each sample, three areas of 20mm20mm were recorded for the estimation of their surface roughness using the root mean square roughness parameterRrms. Processing and analysis of images was carried out
using the NanoScope software (Digital Instruments, version V6.12r1). All images are presented without further treatments. Measurements were performed in air at room temperature and a humidity of 20–30%.
2.9. Swelling Test
The swelling degrees of chitosan,k-carrageenan, and PECs were measured by immersing the films in a phosphate buffer solution (pH¼7.4) at 258C for 30 min. The weight of swollen films was measured every 5 min after removing the surface water with blotting paper. The swelling degree (SD) was calculated on the basis
of the weight of dry (wd) and swollen (ws) films using the following
equation:
SD¼
ws wd
wd
100 ð1Þ
The measurements were carried out in triplicate for each sample and the average value was taken to ensure the result.
2.10. Protein Adsorption
BSA solutions were prepared by dissolving albumin in a mono-phosphate buffer solution at pH¼7.4 to give a final concentration of 10.0 and 20.0 mgmL 1. The PECs films were cut into films of
20 mm5 mm. Each film was placed in an acrylic sealed tube containing 3 mL of the protein solution and taken to a rotary shaker at different interval times (5, 10, 15, 20, 30, 60, and 120 min). In order to evaluate and compare the amount of adsorbed proteins, albumin and fibrinogen solutions of 1.0 mgmL 1were
concentration in each experiment was measured using a UV–visible spectrophotometer (Thermo Scientific Biomatic 3, USA) at a wavelength of 280 nm.
2.11. Test with Cells
2.11.1. Cell Cultures
3T3 fibroblast cell lines were cultured in DMEM, supplemented with 10% FBS (Invitrogen, Burlington, ON, Canada), 100 UmL 1
penicillin, 100mLmL 1 streptomycin (Sigma-Aldrich, St-Louis,
MO, USA) at 378C in a humidified incubator (5% CO2) before the first
medium change. The medium was then changed twice a week. At 80–85% confluence, cells were trypsinized with TrypLE solution (Gibco Invitrogen), 3T3 fibroblast cell lines (10 000 cells/100mL) were then seeded onto pristine chitosan, carrageenan (controls), and PEC films; 25Chi/75-Car and 50Chi/50-Car, respectively.
2.11.2. Cell Viability and Proliferation
Cell viability tests were carried out with 3T3 fibroblast cell lines that were seeded at a density of 10 000 cells per 100mL and were incubated in 96-well tissue culture plates. Cultures were carried out for 7 d. Cells that were seeded on 96-well tissue culture plates were used as negative controls and cells that were seeded on chitosan and carrageenan films were used as positive controls. At least three replicates were studied for each condition. After 1, 4, and 7 d of incubations, the metabolic activity of cells was assessed using a water-soluble tetrazolium based assay [10% WST-1, 4-[3-(4-iodophenyl)-2-(4-nitrophenyl)-2H-5-tetrazolio]-1,3-benzene disul-fonate] for 2 h. Medium from each culture condition (100mL) was transferred to ELISA microplates (96-well plates, Corning Life Sciences, Lowell, MA, USA) for spectrophotometric measure-ment. The absorbance of the solutions was measured spectro-photometrically at 440 nm. Data were expressed as (O.D. value of the sample – O.D. value of the blank)100/O.D. value of the sample.
3. Results and Discussion
3.1. ATR-FTIR Spectroscopy
ATR-FTIR spectroscopy was used to confirm the transition from the pristine polymer films to PEC films with different percentages of these polymers. Polyelectrolyte complex films were analyzed by FT-IR and compared with the spectra of chitosan and carrageenan films, as shown in Figure 1.
Absorption peaks at 1650 and 1540 cm 1were assigned to carbonyl groups (C55O—NHR) and to amino groups (–NH2), respectively. These peaks are typical of chitosan spectra (E). The FT-IR spectrum ofk-carrageenan (A) showed peaks at 1220 cm 1, characterizing a sulfate group (S
55O), and at the 950–810 cm 1region, which is assigned to the asymmetric axial deformation of the ring when the C—C bond increases and the C—O bond decreases. The FTIR
spectra of the PEC films presented adsorption peaks at the same wavenumbers as those of chitosan and of
k-carrageenan. The 75Chi/25-Car PEC (B) (75:25 vol% chitosan/k-carrageenan), which contain a higher percent-age of chitosan, showed more intense peaks for this polymer than fork-carrageenan. In addition, 25Chi/75-Car PEC (D) presented more intense peaks related to
k-carrageenan than those related to chitosan. The reduction in intensity of the adsorption bands of carbonyl groups (C55O—NHR) and amino groups (—NH2) and the increase in intensity of the adsorption bands of sulfate group (S55O) and the asymmetric axial deformation of the ring found in
k-carrageenan demonstrated the formation of PECs.
3.2. XPS Analysis
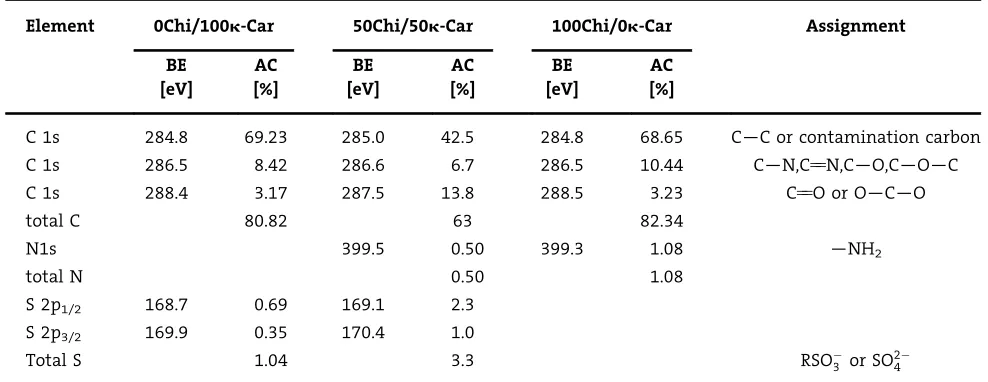
Table 1 shows the C 1s spectra obtained for the pristine chitosan, k-carrageenan and PEC 50Chi/50k-Car, which could be resolved into three components. The total carbon atomic concentration decreased for the PEC, in Figure 2, indicating complex formation. The N 1s spectra showed the presence of just one peak (C—NH2) at 399.5 eV, which decreased in the PEC, due to its complexation with sulfate groups. The S 2p spectra are composed of S 2p1/2and S 2p3/2 peaks, both of which represent sulfur in its highest oxidation state (sulfate O SO3 or R SO2
4 ).
3.3. SEM Analysis
Figure 3 compares the chitosan andk-carrageenan films surface with the three different PEC films. From these images, it was possible to observe homogeneous surfaces for the chitosan andk-carrageenan films and surfaces with increased roughness in the PEC films. Figure 3c–e showed that the PECs were formed, since the films did not present different layers but an integrated complex, confirming blending formation.
Results showed that increasing the concentration of
k-carrageenan increases the heterogeneous cavities on the PEC surfaces. The PEC 25Chi/75k-Car (E) has an elevated degree of roughness due to its high quantity of k-carrageenan; therefore, it presented many cavities and heterogeneous surfaces that made its appearance non-regular. This may be a collateral effect of a partial coacervation among the amino and sulfate groups of both original polymers. This coacervation would cause a combination of chains, with the exclusion of water and the consequent reduction of the volume
occupied by polymers in the film and the formation of local pores.
3.4. AFM Analysis
Atomic force microscopy was performed for pristine chitosan and k-carrageenan films and PEC films. Three areas of 20mm20mm of each sample were recorded for the estimation of their surface roughness. Figure 4 shows the AFM images of the samples and the average roughness values of the films are shown in Table 2.
It may be observed that PEC films are rougher than pristine chitosan and k-carrageenan films and that their roughnesses are proportional to thek-carrageenan percent-age. Moreover, SEM analysis demonstrated that k -carra-geenan films present a higher roughness, in comparison to chitosan films. As described previously, the method to prepare pristinek-carrageenan films is different from that to prepare the solution ofk-carrageenan to make PEC films. Table 1. Assignments of main spectral bands based on their binding energies (BE) and atomic concentration (AC) for chitosan/k -carrageenan polyelectrolyte complexes (25Chi/75k-Car, 50Chi/50k-Car and 75Chi/25k-Car).
Element 0Chi/100k-Car 50Chi/50k-Car 100Chi/0k-Car Assignment
BE [eV]
AC [%]
BE [eV]
AC [%]
BE [eV]
AC [%]
C 1s 284.8 69.23 285.0 42.5 284.8 68.65 C—C or contamination carbon
C 1s 286.5 8.42 286.6 6.7 286.5 10.44 C—N,C55N,C—O,C—O—C
C 1s 288.4 3.17 287.5 13.8 288.5 3.23 C55O or O—C—O
total C 80.82 63 82.34
N1s 399.5 0.50 399.3 1.08 —NH2
total N 0.50 1.08
S 2p1/2 168.7 0.69 169.1 2.3
S 2p3/2 169.9 0.35 170.4 1.0
Total S 1.04 3.3 RSO3 or SO2
4
Figure 3. SEM images of (a) 100Chi/0k-Car, (b) 0Chi/100k-Car, (c) 75Chi/25k-Car, (d) 50Chi/50k-Car, (e) 25Chi/75k-Car.
In the first case, KCl salt is subsequently added to the formed film, in order to turn thek-carrageenan insoluble in water. The gelation of pristinek-carrageenan is attributed to the double helix formation and the association of the double helices. Potassium ions can cause a shift from polymer-solvent to polymer/polymer interactions, that is induced by the ionic bond between Kþand the sulfate groups of D-galactose residues and the electrostatic bond between Kþ and the anhydrous oxygen atom bridges of the adjacent galactose residue.[21]Thus, pristinek-carrageenan can form a strong and rigid gel and its films have a lower roughness than the PEC films and are more rigid. For the PECs, the salt is added to the k-carrageenan solution before the film formation, and promotes its dissolution. By increasing the
k-carrageenan ratio in the PEC films, the roughness was increased, making the film more fragile and slim (Table 2) Furthermore, it was impossible to scan PEC 25Chi/75k-Car due to its surface irregularities and its high roughness, as demonstrated in the SEM results (Figure 3e).
3.5. Swelling Test
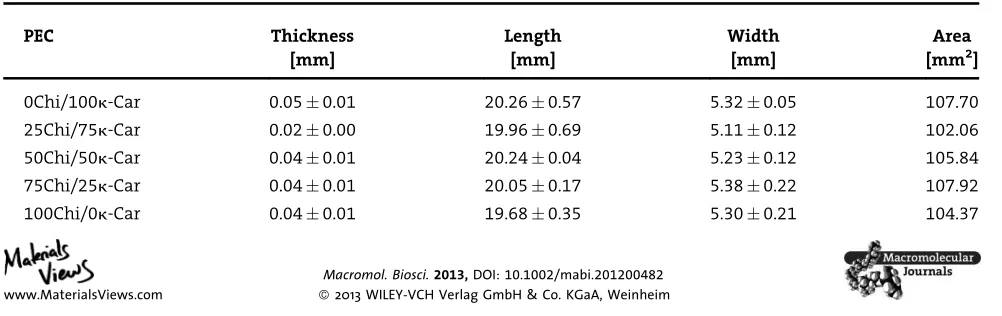
After preparation, the films were cut into small pieces to perform the swelling test. Table 3 presents the average dimensions of the samples. Each membrane was measured using a caliper of 0.01 mm precision. The pristine polymer films had the appearance of transparent membranes with smooth surfaces. In contrast, the PEC membranes were opaque which indicates that PECs may present fiber formation with the interaction of opposite charges of
groups of chitosan and carrageenan. These fibers promote large interstitial voids formed as water evaporates and upon film formation, this structure scatters light and generates opaqueness.[22]
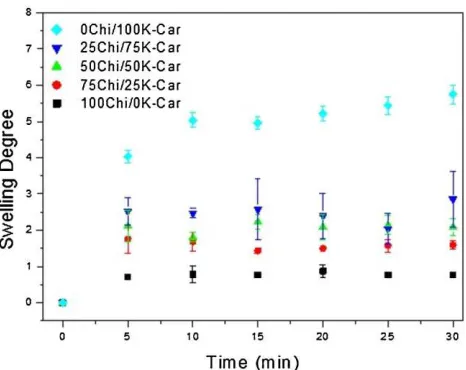
As seen from Table 3 all samples were approximately 20 mm5 mm, and the thickness depended on the type of film. The PEC 25Chi/75k-Car had the lowest thickness value (0.02 mm) and was the most fragile film. As explained above, due to the method of producing PECs in this study, when the percentage ofk-carrageenan was higher, the film was more fragile. The swelling degree was determined by measuring the change in the films’ weight in phosphate buffer. Each essay was performed with three replicates and the results are shown in Figure 5.
It is clear that the k-carrageenan films presented the highest swelling degree for all the membranes analyzed. The amount of water absorbed by k-carrageenan was four-to-six times greater than the quantity absorbed by chitosan. The electrostatic repulsion of sulfonate groups from k-carrageenan contributes to the swelling of this film. Such electrostatic repulsion between similar-charged groups is known to contribute to the swelling of polymer gels.[13]
Chitosan presented the lowest rates of swelling. Vachoud et al.[23] reported that, at pH¼4, the apparent cationic charge density of the chitosan segments is at maximum protonation. Thus, the electrostatic repulsion, the solvation of the ionic groups, and the osmotic contribution is maximum and this lead to maximum swelling. This study also related that, at pH¼10, the amino groups of chitosan are completely deprotonated, contributing to the loss of solubility of the chain segments and to the formation of new cross-links by hydrogen bonding. At the intermediary pH value of 7.4, the amino groups of chitosan are partially protonated. Therefore, electrostatic repulsion contributes to the swelling process at this pH, but this repulsion is not sufficient to take a leading role in controlling this process. As a consequence, chitosan films swelled at pH¼7.4, even though they had not adsorbed a large amount of water.
Polyelectrolyte complexes present swelling degree val-ues that are intermediate, compared to chitosan and Table 2. Roughness analyses of PEC films; each point presents the
average value of three experiments.
Film Roughness
[nm]
chitosan 243
k-carrageenan 321
PEC 75Chi/25k-Car 437
PEC 50Chi/50k-Car 10915
Table 3. Polymer film dimensions, following swelling degree test.
k-carrageenan. TheSDof PECs increased as the percentage of
k-carrageenan in the complex was increased. A possible swelling mechanism for these complexes may be that, in the initial state, chitosan and k-carrageenan are bound to each other, due to the two kinds of functional groups that are considered to be oppositely charged (O SO3 Hþ3N ). When immersed in alkaline solution, the electrostatic bond between the two polymers disap-pears and the electrostatic repulsion between sulfonate groups ofk-carrageenan will contribute to the swelling of the complex.[13]Hence, PECs that have a greater amount of k-carrageenan in their composition have a greater repulsion between the charged groups of this polymer, promoting a higher degree of swelling. The PECs reached a swelling equilibrium in the first minutes of the experi-ments (Figure 5). These results are different from those presented by Tapia et al.,[17]which showed an equilibrium plateau of swelling only after 30 min. Unlike the other membranes, an equilibrium plateau is not observed in the k-carrageenan swelling results. Indeed, structures made from this polymer can reach a swelling equilibrium after more than 10 h.[24]
3.6. Protein Adsorption Analysis
Protein adsorption is an important element to characterize a material for blood-contact applications. The mechanism is known to be a complex phenomenon that involves several interactions such as hydrophobic and electrostatic inter-actions and hydrogen bonding.[3] The use of a foreign surface in the circulation triggers thrombogenic interac-tions in three mainly steps that are highly interlinked: protein adsorption, platelet and leukocyte activation/ adhesion, and activation of complement and
coagula-tion.[25,26]After implantation in the body, the initial step in this series of events that occurs in the biomaterial is adsorption of proteins, which leads to thrombosis and failure of the biomaterials. Therefore, the characterization and measurement of surface-adsorbed proteins is impor-tant for assessing the biocompatibility of a biomaterial.[27] Even though this phenomenon involves numerous pro-teins, it is necessary to first understand the behavior of single protein adsorption onto the polymers surfaces. Albumin and fibrinogen were selected for the protein adsorption study as they are some of the most abundant proteins in human plasma; BSA was used to mimic human serum albumin (HSA). Furthermore, fibrinogen is one of the most important protein in blood clotting because it stimulates platelet adhesion on the artificial surface. Platelets respond to a minimal stimulation and become activated by the interaction of an extracellular stimulus with its surface, and plasma proteins such as fibrinogen and thrombin and other plasma contents such as collagen, leukocytes, and other platelets are potent platelet activa-tors.[25] These activated platelets produce and release substances there are involved on the thrombogenic process. Thrombin is one of these released products and it is responsible for activating other platelets and also for converting fibrinogen into fibrin, structure responsible for the stabilization of platelet thrombus.[28] Hence, it is necessary to study fibrinogen adsorption onto the foreign surface to understand the biological response to the PECs. Reducing fibrinogen adhesion to the surface improves blood compatibility properties of this surface.
Adsorption profiles of PECs of chitosan/k-carrageenan were conducted at different concentrations of BSA (10 and 20 mgmL 1) at pH¼7.4. The amount of adsorbed protein for PECs and pristine polymer films were determined for BSA and FIB at pH¼7.4. Figure 6 and 7 illustrate the profile of the relative concentration of BSA [C(t)/C0] as a function of time for the three PECs prepared at concentrations of 10 and 20 mg mL 1, respectively.
Adsorption results showed that for the three PECs, there was a small amount of BSA adsorbed in both concentrations, and that in all the cases the system has rapidly equilibrated. For both concentrations of BSA, the PEC 75Chi/25k-Car, which contains a greater amount of chitosan, adsorbed a higher quantity of albumin than the other two. This result is expected since at physiological pH and at high concentrations of BSA, chitosan interacts more with albumin thank-carrageenan. At physiological pH, chitosan has some protonated amino groups that can interact with the negative charges of BSA. Under this condition,k-carrageenan presents negative charges (SO2
4 ), resulting in a low potential for interaction with albumin. Therefore, the greater the proportion of chitosan in the polyelectrolyte complex, the higher the affinity for BSA of its surface.
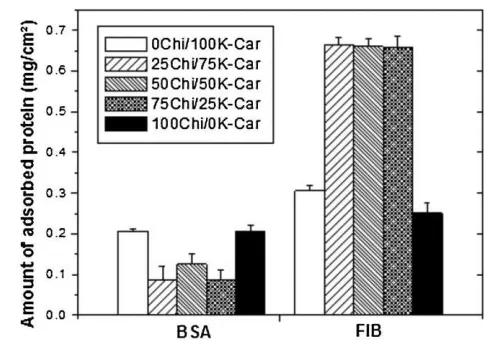
The adsorbed amounts of albumin (BSA) and fibrinogen (FIB) on all films studied are shown in Figure 8. For the five different films, the amount of fibrinogen adsorbed was greater than the amount of BSA. Both proteins are globular and vary in size and also in electric charge, depending on the properties of the experiment. The properties of the two proteins studied are shown in Table 4.[3]According to their isoelectric points, 4.8 for BSA and 5.5 for FIB, both proteins have negative charges at the experimental pH. However, albumin has a tendency to have higher density of these charges than fibrinogen. Thus, BSA provides a great repulsion to the film surfaces.
k-Carrageenan adsorbed the same amount of albumin as chitosan, but a higher amount of fibrinogen. These results
do not follow a predictable behavior.k-Carrageenan should adsorb a smaller amount of proteins due to sulfate groups. However, this peculiar behavior can be explained by the swelling properties of this polymer. The swelling degree of
k-carrageenan is the highest of all films studied. This fact leads to an increase in porosity and in surface area and generates channels that allow proteins to penetrate the film.
With respect to polyelectrolyte complex films, Figure 8 shows that the adsorbed amount of fibrinogen was equivalent for all PECs analyzed. Similarly, the amount of albumin adsorbed may be considered equivalent as the differences between the results for each PEC lie inside the standard deviation limits.
The amount of BSA adsorbed on the surface of PECs was lower than on pristine chitosan andk-carrageenan surfaces. The sulfate groups of k-carrageenan present on PECs repelled the protein solution on its surfaces. Since these films also contain chitosan in its composition, the swelling degree was not as significant as on pristinek-carrageenan films (Figure 5), while PECs adsorbed a smaller amount of BSA than these films.
On the other hand, fibrinogen adsorption was greater on PEC surfaces than on pristine polymers films. As explained Figure 6.Variation in the relative concentration versus time for
different PECs in an initial concentration of 10 mgmL 1of BSA in phosphate buffer pH¼7.4 at room temperature.
Figure 7.Variation in the relative concentration versus time for different PECs in an initial concentration of 20 mgmL 1of BSA in
phosphate buffer pH¼7.4 at room temperature.
Figure 8. The amount of adsorbed proteins on chitosan, k -carrageenan, and PEC films for initial concentrations of 1.0 mgmL 1of BSA or 1.0 mgmL 1 of fibrinogen at pH¼7.4
and room temperature.
Table 4. Physical properties of proteins used in the adsorption analysis.
Protein
Isoelectric point [pH]
Mass [Da]
BSA 4.8 69 000
before, fibrinogen presents a lower density charge and lower repulsion to the films than albumin. The protein also has a five-fold greater mass than that of BSA (Table 4) and hence it has lower mobility, mainly within e pores. This fact, combined with the high roughness of PEC films (Table 2), causes a significant amount of fibrinogen to be adsorbed by the polyelectrolyte complex films, compared to the pristine polymers films.
3.7. Cell Proliferation and Viability
Bio-macromolecules have been intensely exploited as biomimetic scaffolds for engineering cellular functions.[29] Although several studies have shown that chitosan is not cytotoxic toward fibroblasts, chitosan does not present good cell proliferation.[30,31]A number of techniques have been tested for their ability to improve the cytocompati-bility of chitosan for fibroblasts.[30–34]On the other hand,
k-carrageenan demonstrated biocompatibility, with great-er than 90% of the human fibroblasts remaining viable aftgreat-er 7 d as reported by Juris et al.[35]Moreover, the developed chitosan/carrageenan nanoparticles have been
demon-strated to be non-cytotoxic, under a range of concentrations of between 0.1 and 3 mgmL 1.[36]
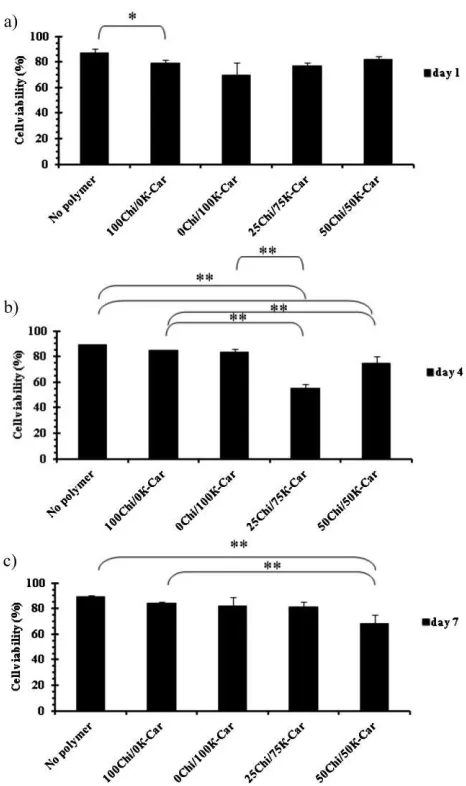
In this study, the in vitro cytocompatibility of three PECs of chitosan/k-carrageenan were evaluated in culture with the 3T3 fibroblast cell line. Figure 9 and 10 display the proliferation capacity and viability of 3T3 cells upon exposure to different concentrations of chitosan/
k-carrageenan for 1, 4, and 7 d. The results are reported in terms of cell expansion and viability, compared to that seen with negative (no polymers) and positive controls (chitosan and carrageenan). To assess the response of the fibroblasts towards the biopolymers, cells were seeded on the surfaces described above. Representative images of cultures at different times after seeding are shown in Figure 9. The typical spindle-shaped morphology of fibroblasts are shown at Day 0 with phase contrast microscope analysis (Figure 9a). Cells showed adhesion and expansion on both chitosan andk-carrageenan surfaces on all 3 d (Figure 9b). Moreover, cell growth increased within 7 d. However, we were unable to observe fibroblast adherence due to the compact structures (high roughness) of the three chitosan/
k-carrageenan PECs (Figure 9b).
Figure 9. Typical 3T3 fibroblasts proliferation on ‘‘no polymer’’ surfaces at day 0 (a) and cells proliferation on chitosan/k-carrageenan (25% chi/75%k-car, 50%/50% and 75%/25 vol% surfaces at days 1, 4, and 7 (b), scale bar: 100mm.
Figure 10 shows cell viability on chitosan and
k-carrageenan films. Pristinek-carrageenan and chitosan, both demonstrated biocompatibilities similar to those of negative controls, within 7 d. Unexpectedly, 75Chi/25k-Car PEC, which contains a greater amount of chitosan, was found to be cytotoxic towards fibroblasts (Figure 10a–c).
similar to those of the no polymer surfaces, which were used as negative controls (Figure 10b). As can be observed, the PEC that was composed of equal concentrations of chitosan and carrageenan (50Chi/50k-Car) was generally suitable for cell expansion compared to 25Chi/75k-Car PEC, due to higher cell viability at Day 4 (Figure 10b). The precise reasons for these reductions (seen with 25Chi/75k-Car) are currently unknown, though the reduction in cell viability could be related to adhesion forces that result in different cell spreading; cell spreading is encouraged only when the cell/material interforce is high enough. It is known that integrins mediate the adhesion of cells to polymers and such interactions have been linked to a wide range of cellular process, such as proliferation, differentiation, and apoptosis.[37]On the last day of culture, no differences were observed on the viability for both PECs. However, cells on no
polymer surfaces or pristine chitosan and k-carrageenan surfaces showed higher cell viabilities, compared to on the PEC surfaces (Figure 10c).
These results prove that there are specific interactions leading to cell proliferation, between pristine chitosan/
k-carrageenan and fibroblasts; this finding is supported by examination of cell expansion and viability. Moreover, 50Chi/50k-Car surfaces are generally suitable for fibroblast expansion due to high cell viability (70%, all culture days).
4. Conclusion
Polyelectrolyte complex (PECs) films, based on chitosan and
k-carrageenan were prepared in three different propor-tions: 25/75, 50/50 and 75/25 vol%. The complex forma-tions were confirmed by FTIR spectroscopy, XPS, and SEM analysis. It was demonstrated that PECs are rougher than both pristine chitosan andk-carrageenan films and that by increasing the amount of k-carrageenan in PECs, the amounts of cavities and the roughness also increase. Moreover, PECs presented swelling degree results that were intermediate between those of pristine chitosan and k -carrageenan, confirming the influence of both polymers. It has also been observed that, for each protein, the adsorption results were approximately the same for all three PECs and that the adsorbed amount of albumin was greater than the amount of fibrinogen, although negative and positive synergistic effects could be observed in PECs as a result of complex formation and final film microporosity that may affect transport characteristics along the membrane. Although pristine chitosan and k-carrageenan gave rise to similar cell expansion and viability, 50Chi/50k-Car PECs may be acceptable for use as new scaffold material for cell therapies, due to their effect on cell survival.
Acknowledgements: The authors thank the CNPq for financial support and the Agence Universitaire de la Francophonie for linkage funding to D.M. and M.B.
Received: December 28, 2012; Revised: March 13, 2013; Published online: DOI: 10.1002/mabi.201200482
Keywords: k-carrageenan; cell proliferation; chitosan; polyelec-trolyte complex; protein adsorption
[1] A. Hugerth, N. Caram-Lelham, L. Sundelof,Carbohydr. Polym.
1997,34, 149.
[2] J. Berger, M. Reist, J. M. Mayer, O. Felt, R. Gurny,Eur. J. Pharm. Biopharm.2004,57, 35.
[3] V. P. Hoven, V. Tangpasuthadol, Y. Angkitpaiboon, N. Vallapa, S. Kiatkamjornwong,Carbohydr. Polym.2007,68, 44. [4] S. Y. Park, B. I. Lee, S. T. Jung, H. J. Park,Mater. Res. Bull.2001,
36, 511. Figure 10.Viability of 3T3 fibroblasts cultivated on negative,
[5] Q. Li, E. T. Dunn, E. W. Grandmaison, M. F. A. Goosen,J. Bioact. Compat. Polym.1992,7, 370.
[6] S. Sagnella, K. Mai-Ngam,Colloids Surf., B2005,4, 147. [7] M. M. Amiji,Carbohydr. Polym.1997,32, 193.
[8] K. C. Justi, V. T. Favere, M. C. M. Laranjeira, A. Neves, A. Casellato,Macromol. Symp.2005,229, 203.
[9] N. Tsubokawa, T. Takayama,React. Funct. Polym.2000,43, 341. [10] J. S. Mao, L. G. Zhao, Y. J. Yin, K. D. Yao,Biomaterials2003,24,
1067.
[11] M. Rinaudo,Prog. Polym. Sci.2006,31, 603. [12] E. Zablackis, G. A. Santos,Bot. Mar.1986,29, 319.
[13] T. Sakiyama, C. Chu, T. Fujii, T. Yano,J. Appl. Polym. Sci.1993, 50, 202.
[14] D. Baskar, T. S. Sampath Kumar,Carbohydr. Polym.2009,78, 767.
[15] P. Piyakulawat, N. Praphairaksit, N. Chantarasiri, N. Muang-sin,AAPS PharmSciTech,2007,8, 97.
[16] S. Rodrigues, A. M. Rosa Da Costa, A. Grenha, Carbohydr. Polym.2012,89, 282.
[17] C. Tapia, Z. Escobar, E. Costa, J. Sapag-Hagar, F. Valenzuela, C. Basualto, M. N. Gai, M. Yazdani-Pedram, Eur. J. Pharm. Biopharm.2004,57, 65.
[18] H. Tomida, C. Nakamura, S. Kiryu,Chem. Pharm. Bull.1994, 42, 979.
[19] A. C. Pinheiro, A. I. Bourbon, M. A. C. Quintas, M. A. Coimbra, Innovative Food Sci. Emerging Technol.2012,16, 227. [20] M. M. Beppu, C. C. Santana,Doctoral Thesis, State University
of Campinas, December,1999.
[21] M. T. Nickerson, A. T. Paulson, F. R. Hallett,Carbohydr. Polym.
2004,58, 25.
[22] R. M. Fitch,Polym. Colloids1997,11, 314.
[23] L. Vachoud, N. Zydowicz, A. Domard,Carbohydr. Res.2000, 326, 295.
[24] A. L. Daniel-Da-Silva, J. Moreira, R. Neto, A. C. Estrada, A. M. Gil, T. Trindade,Carbohydr. Polym.2012,87, 328.
[25] M. B. Gorbet, M. V. Sefton,Biomaterials2004,25, 5681. [26] F. J. Schoen, in: Biomaterials Science: An Introduction to
Materials in Medicine, 2nd ed. (Eds: B. D. Ratner, A. S. Hoffman, F. J. Schoen, J. E. Lemons), Academic Press, New York, NY2004, p. 293.
[27] C. Xu, D. He, L. Zeng, S. Luo,Colloids Surf., B2009,73, 360. [28] K. N. Ekdahl, J. D. Lambris, H. Elwing, D. Ricking, P. H. Nilsson,
Y. Teramura, I. A. Nicholls, B. Nilsson,Adv. Drug Delivery Rev.
2011,63, 1042.
[29] N. Fang, A. Zhu, M. B. Chan-Park, V. Chan,Macromol. Biosci.
2005,5, 1022.
[30] G. I. Howling, P. W. Dettmar, P. A. Goddard, F. C. Hampson, M. Dornish, E. J. Wood,Biomaterials2001,22, 2959.
[31] S. S. Silva, M. I. Santos, O. P. Coutinho, J. F. Mano, R. L. Reis,J. Mater. Sci.: Mater. Med.2005,16, 575.
[32] Y. G. Ko, S. M. Yu, S. J. Park, H. J. Chun, C. H. Kim,Langmuir
2012,28, 7223.
[33] S. S. Silva, S. M. Luna, M. E. Gomes, J. Benesch, I. Pashkuleva, J. F. Mano, R. L. Reis,Macromol. Biosci.2008,8, 568. [34] Y. C. Wang, S. H. Kao, H. J. Hsieh,Biomacromolecules2003,4,
224.
[35] S. J. Juris, A. Mueller, B. T. L. Smith, S. Johnston, R. Walker, R. D. Kross,J. Biomater. Nanobiotechnol.2011,2, 216.
[36] A. Grenha, M. E. Gomes, M. Rodrigues, V. E. Santo, J. F. Mano, N. M. Neves, R. L. Reis,J. Biomed. Mater. Res. A2010,92, 1265. [37] S. Gronthos, P. J. Simmons, S. E. Graves, P. G. Robey,Bone2001,