DOI: 10.12928/TELKOMNIKA.v13i3.1544 1069
Simulation and Implementation Model of Productivity
Measurement Internet Bandwidth Usage
Tjahjanto*1, Benhard Sitohang2, Sudarso Kaderi Wiryono3
1,2
STEI-ITB, School of Electrical Engineering and Informatics, Institute Technology Bandung, Institut Teknologi Bandung, Labtek V, Lantai IV, Jl. Ganesa No. 10 Bandung, Indonesia
3
SBM-ITB, School of Business and Management, Institute Technology Bandung *Corresponding uthor, e-mail: [email protected], [email protected],
Abstract
The Internet is used by a very large number of users, from the ordinary user community, through special users, like people with high intellectual level. The growth in the number of users is increasing very fast. Internet has also been used by multi-sector businesses with multi profession. It makes information the internet usage something very strategic, one of which information is productivity internet bandwidth usage. Therefore the research are needed a simulation and implementation model to be able to measure the productivity of the internet bandwidth usage, which can later become the basis of the measurement of productivity. This paper describes a model implementation and simulation of productivity measurement internet bandwidth usage, which describes all possible measurement values obtained, and is a continuation of previous research, which is the basic concept of productivity in the use of internet bandwidth and how to measure it, so that the measuring results can be used as a guide in determine the direction of policy and the provision of productive Internet bandwidth usage.
Keywords: internet measurement, internet productivity, productivity measurement
Copyright © 2015 Universitas Ahmad Dahlan. All rights reserved.
1. Introduction
Internet has been known to the public at large, especially since the popularity of Facebook (FB), people in Jakarta are among the largest internet users-especially on twitter-in Asia and are number 4 in the world [1]. IT development has triggers the occurrence of a major revolution, the information revolution name. Internet has been used everywhere and has been used by anyone, from the elite to the lower classes. Internet can be accessed from a variety of devices, from the personal computer at home or in the office until the mobile is a laptop, I-Pad, Smart Phone.
The Internet is easy, cheap and mass, making the internet a very strategic something that must be controlled, the problem is how to measure productive our internet usage, either by personal, especially by government institutions.Internet will bring a broad impact (multi-sector) in this life and the future; it is the need for a framework that can measure the productivity of Internet bandwidth usage.
Based on the above background, this paper describes a model implementation and simulation of productivity measurement internet bandwidth usage, which describes all possible measurement values obtained, and is a continuation of previous research. The result of previous research is the basic concept of productivity in the use of internet bandwidth and how to measure it.Implementation and simulation are performed in this research using the framework of previous research that productivity measurement framework without regard to internet bandwidth usage coefficient variable, the variable value is taken through the process of Analytical Hierarchy Process (AHP).
The results of this research, simulation and implementation conducted proof productivity of Internet bandwidth usage can be measured.
For a comprehensive understanding of the productivity of the internet bandwidth usage, of course, must understand the meaning and definition of the word "productivity" in general as the word "productivity", and the meaning of "productivity" in the use of internet bandwidth, as well as the meaning of "productivity internet bandwidth usage" as a single entity, it has been described in previous studies [4-6], and the basis for the development of models and simulations.
Productivity is the ratio of output divided by input based on economic theory. Meanwhile, according to Mali in 1978 that productivity is as follows [7, 8]. Productivity internet bandwidth usage can be measured by looking at the factors effectiveness and efficiency of the Internet bandwidth usage.
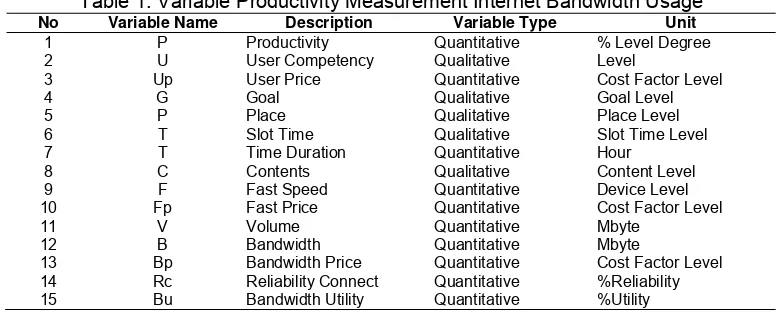
Variable productivity internet bandwidth usage at the moment there are 14 study variables, described in Table 1. The following:
Table 1. Variable Productivity Measurement Internet Bandwidth Usage
No Variable Name Description Variable Type Unit
1 P Productivity Quantitative % Level Degree
2 U User Competency Qualitative Level
3 Up User Price Quantitative Cost Factor Level
4 G Goal Qualitative Goal Level
5 P Place Qualitative Place Level
6 T Slot Time Qualitative Slot Time Level
7 T Time Duration Quantitative Hour
8 C Contents Qualitative Content Level
9 F Fast Speed Quantitative Device Level 10 Fp Fast Price Quantitative Cost Factor Level
11 V Volume Quantitative Mbyte
12 B Bandwidth Quantitative Mbyte
13 Bp Bandwidth Price Quantitative Cost Factor Level 14 Rc Reliability Connect Quantitative %Reliability 15 Bu Bandwidth Utility Quantitative %Utility
Variable measurement of current research has increased when compared to the previous research variables [4, 5], which adds Variable Cost Factor, which consists of a variable Fp: Computer Cost Factor, Bp: Bandwidth Cost Factor, Up: User Cost Factor. While a detailed explanation of other variables have been described in previous studies [5].
2. T-Framework Measurement
Addition of Fp, Bp, and Up resulted in changes in the function of variable input and output functions, see the measurement framework in Figure 1, the so-called T-Framework: (T-Framework is a (T-Framework to measure productivity internet bandwidth usage using variables and indicators which have been determined, and it has been suggested in previous studies [4]).
2.1. Measurement Formula
The picture above Figure 1 measurement framework, obtained the following functions:
Actual Productivity . . . .
. . . . . (1)
PA, Actual Productivity is a massive productivity value of the formulated mathematical calculations described above functions, having regard to units on each variable.
Productivity Index P(%)= % (2)
P%, Productivity Index in percent, is the division between the PA and the value of measuring the value of maximum productivity measure P (max) multiplied by 100%.
P(max) is a measure of the value of measuring the maximum productivity obtained when measuring all variables are best positioned optimally.
Figure 1. Measurement Framework
2.2. Variable Measurement Algorithms
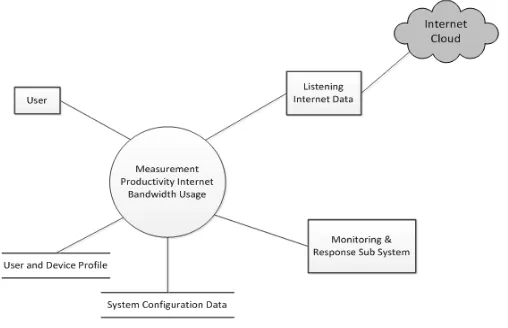
To find the number of measurement variables automatically, from the measured object, the necessary technical measures, in accordance with Figure 2 also having regard to the system model in Figure 3 is the basis for measurement of the following steps:
1. Start the measurement
2. Preparation of configuration settings a) Input Table Type of Industry b) Input Table User Profile c) Table Input Device Profile d) Input Table Category Contents
e) Input System Configuration Data (Measurement Scale) 3. Determine the measurement duration t1-tn
4. Read data from proxy
5. Collect data and IP User Content
6. Filter the data according to the content category 7. Put the measuring table
8. Save the configuration settings
9. Calculations corresponding measurement formula 10. Display the value of the measurement
11. Save the measurement data 12. End of measurement
Figure 3. Function Based Matric
3. Measurement Application Architecture
Figure 4 illustrates the location or position measurement applications on a computer network, a server can be in one box, or can also be in two server box, and placed between the firewall and the hub switch. Also, that can create a computer-based appliance that is installed inside measurement applications productivity internet bandwidth usage, which has its own IP number [6].
4. Measurement Application Architecture 4.1. Variable Qualitative Level with AHP
Figure 4. Application Measurement in the Network
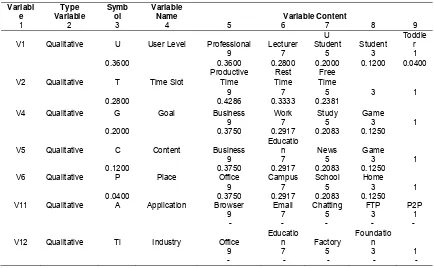
Table 2. Level Variable with AHP Variabl
V1 Qualitative U User Level Professional Lecturer U
V5 Qualitative C Content Business Educatio V11 Qualitative A Application Browser Email Chatting FTP P2P
9 7 5 3 1
- - - - -
V12 Qualitative Ti Industry Office
Educatio
Application variable (V11, A) do not levelling process, these variables are ignored because all internet applications can be run through a web browser, while a variable of type Industry (V12, Ti) levelling process is not done well, as industry type variable will only be selected one course , namely when selecting measurement universe.
Allotment = 0.2800, G: Destination = 0.200, C: Content = 0.1200, and P: Points = 0.0400, which means that the influence of the variable U: User greatest compared to other variables.
In Table 2 Line V1 is User Level, of the results of AHP calculation shows Professionals have level value = 0.3600 compared Teachers value = 0.2800, Student = 0.2000, Student = 0.1200 and Toddlers = 0.0400, which means that professionals are more productive when compared with students. Levelling Also is happen for the value of the next line V2, V3, V4, V5, and V6 in Table 2. That’s Shows in the content of the variable.
4.2. Effective Factor (Output Factor)
As concluded in the previous study [1], that productivity is the effectiveness of the task divided by the efficiency of resource use and multiplied by the quality of the process, which can be abbreviated effectiveness divided efficiency multiplied by the quality factor. Here are the results of the simulation effectiveness consisting of variable U: User, G: Goals, P: Place, T: Time, C: Content, F: Specification, B: Bandwidth and A: Application, in the table below.
Table 3. Effective Factor (Output Factor)
Col No 1 2 3 4 5 6 7 8 9
Unit Level Level Level Slot GHz MBPS Level Desc. User Goal Place Time Content Spec. Bandwidth Application
Var. U G P T C F B A Output
The figure in Table 3 above shows the maximum and minimum values of the output of all variable factors that influence it. While the numbers in column 8 Application variables are all = 1, because the variable A: Application is negligible, since almost all Internet applications can be run on the browser application.
4.3. Efficiency Factor (Input Factor)
Efficiency factor or input consists of a variable V: Volume, D: Duration, Fp: Specification Cost, Up: User Cost, and Ap: Application Cost.
The table below is the result of simulation Efficiency Factor of productivity, of the maximum value to the minimum value that will happen, except column 15 Application Cost, all value = 1 for Application Cost ignored by the same reason as that of the output factor.
Table 4. Efficiency Factor (Input Factor)
Col No 10 11 12 13 14 15 16
Unit 10MB Hour Factor Factor Factor Factor
4.4. Quality Factor
The quality factor productivity measurement consists of variables that factor Connection Reliability index availability of connections and bandwidth Utility is the index of bandwidth usage 5. The following table describes the simulation of all the possibilities that will be obtained in the measurement.
Table 5. Quality Factor
Colom Number 17 18 19
Unit Index Index Index
Description Reliability Connection Bandwidth Utility
Variable Rc Bu Quality
The Table 5 above also explains that the quality of productivity is determined by factors Reliability and Bandwidth Connection Utility, visible when both factors are declining, drive quality also decreased. That change in the quality factor occurs in a linear fashion.
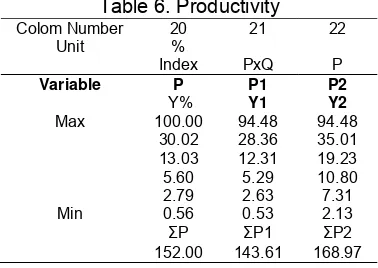
4.5. Maximal and Minimal Productivity Score
The following table described the maximum and minimum measurement of productivity measurement results of the internet bandwidth usage.
Table 6. Productivity
5. Analysis of Measurement 5.1. Input Analysis on Productivity
The graph in Figure 5 does not include the variable formed by the A: Application, because any application can be executed by the browser and the scale of the highest value of all variables is 10. P = Productivity Actual value may decline and rising to the highest level, is influenced by variables input. This shows the change of the input variables affecting productivity.
Figure 5. Input Graph Analysis on Productivity
5.2. Output Analysis on Productivity
Figure 6 portray the graph changes in the value of productivity depends on the output variable. Graph formed without variable Ap: Application Cost, because using only a browser application, all applications can be run internet. Graphic scaled to scale the highest value of all variables is 10.
Figure 6. Output Graph Analysis on Productivity
In the Figure 6 shows the output changes affect productivity. if observed, that the value of productivity will decrease significantly when there is little change in the output variables, especially the variables V, FP and BP, while the variable D: Duration and Up: User Cost Factor, does not need to be high to get maximum productivity value.
5.3. Factor Analysis Output and Input Factors on Productivity
Figure 7 portray changes in the value of P: Productivity varies from minimum to maximum in line with changes in the variables that influence. From the graphic below productivity value change is not linear with changes in variables that affect it.
Figure 7. Output Graph Analysis on Productivity
5.4. Value Analysis Productivity
From Figure 8 graph, the more it appears that the value of P = productivity will decrease with the decrease of the value of other variables (U, G, p, T, C, F, B, V, D, Fp, Bp, Up), so also on the contrary, the value of P = Productivity will rise in line with the increase in the variables that influence it.
However impairment P = Productivity is not as linear variables other (U, G, p, T, C, F, B, V, D, Fp, Bp, Up), tend to go straight down when the other variables are just starting down. This shows that the productivity of Internet bandwidth usage is influenced by almost all supporting variables, not by a certain variable, as described in the chart star image analysis above is Figure 5, Figure 6 and Figure 7.
Figure 8. Graph Analysis Process of Productivity Decline
6. Conclusion 6.1. Conclusion
From the simulation results with the measurement object universal measuring general (regardless of the type of industry to be measured), the following conclusions were obtained:
2. The maximum input factors do not guarantee that the maximum value of productivity would be anyway, so the maximum output factor does not guarantee will get maximum productivity values, shown in Figure 7. The analysis of input and output factors.
3. To obtain maximum productivity required output and input conditions are optimal, consider Figure 7. The analysis of input-output factor.
4. That the value of the bandwidth is not the main factor for productivity productive Internet bandwidth usage.
6.2. Follow-up Implementation and Simulation
From the above conclusion, that the implementation and simulation have described the possibilities of measuring values obtained. And the results of this simulation will be the basis of further research, namely:
1. The further research will perform direct measurements on one or more organizations, can the company or the campus academic organizations, in accordance with the target universe to be measured.
2. The further research will perform a comparative analysis between the results of measuring the simulation with real measurement results, so it is expected that the analysis results can be used to improve the quality factor productivity measurement Internet bandwidth usage.
References
[1] Pramiyati T, Supriana I, Purwarianti A. Determining Trust Scope Attributes Using Goodness of Fit Test: A Survey. TELKOMNIKA Telecommunication Computing Electronics and Control. 2015; 13(2).
[2] Saari S. Productivity Theory and Measurement in Business. European Productivity Conference. Finland.2006.
[3] Strassmann PA. Defining and Measuring Information Productivity. New Canaan, USA: The Information Economics Press. 2004.
[4] Tjahjanto, Benhard Sitohang, Sudarso Kaderi Wiryono. Framework Pengukuran Produktivitas Penggunaan Bandwidth Internet. SNAKOM, Bandung. 2012.
[5] Tjahjanto, Benhard Sitohang, Sudarso Kaderi Wiryono. Variabel Produktivitas Penggunaan Bandwidth Internet (Korelasi dengan variabel IT Resources pada COBIT Framework). KNS&I, Bali. 2013.
[6] Tjahjanto, Benhard Sitohang, Sudarso Kaderi Wiryono. A System Design of Productivity Measurement Internet Bandwidth Usage. R-ICT, Bandung. 2013.
[7] J Sumanth DJ. Productivity Engineering and Management. McGraw-Hill. 1984. [8] Gaspersz V. Manajemen Produktivitas Total. Jakarta: Gramedia. 2000.