Gene expression of manganese superoxide dismutase in human glioma cells
Novi S. Hardiany,1,2 Mohamad Sadikin,1 Septelia I. Wanandi1
1 Departement of Biochemistry and Molecular Biology, Faculty of Medicine University of Indonesia, Jakarta, Indonesia 2 Master Program in Biomedical Sciences, Faculty of Medicine University of Indonesia, Jakarta, Indonesia
Abstrak
Tujuan Menganalisis ekspresi MnSOD pada sel glioma manusia yang dibandingkan dengan sel lekosit sebagai kon-trol sel normal, sehingga dapat mengetahui peran MnSOD sebagai antioksidan endogen yang diduga sebagai supre-sor tumor.
Metode Ekspresi MnSOD dianalisis dengan mengukur mRNA MnSOD secara kuantitatif dan aktivitas spesiik enzim MnSOD. Ekspresi MnSOD dideteksi pada 20 pasien glioma dengan menggunakan Real Time RT-PCR untuk mRNA MnSOD dan pemeriksaan biokimia untuk mengukur aktivitas spesiik enzim MnSOD (kit RanSOD). MnSOD pada lekosit digunakan sebagai kontrol. Analisis statistik yang digunakan yaitu uji Kruskal Wallis.
Hasil Kadar relatif mRNA MnSOD sel glioma 0,015–0,627 kali lebih rendah dibandingkan dengan sel lekosit sebagai kontrol pada 70 % distribusi sampel, 10 % distribusi sampel menunjukkan nilai 1,002–1,059 serta 20 % distribusi sampel menunjukkan kadar relatif mRNA MnSOD 1,409–6,915 kali lebih tinggi dibandingkan dengan kontrol. Begitu pula dengan kadar relatif aktivitas spesiik enzim MnSOD pada sel glioma 0,064–0,506 kali lebih rendah dibandingkan kontrol pada 80 % distribusi sampel serta 20 % distribusi sampel menunjukkan nilai 1,249–2,718 kali lebih tinggi. Kesimpulan Ekspresi gen MnSOD baik mRNA maupun aktivitas spesiik enzim MnSOD pada sebagian besar sampel sel glioma manusia lebih rendah secara signiikan dibandingkan dengan sel lekosit. (Med J Indones 2010; 19:21-5)
Abstract
Aim This study analyze the MnSOD gene expression as endogenous antioxidant in human glioma cells compared with
leucocyte cells as control.
Methods MnSOD gene expression of 20 glioma patients was analyzed by measuring the relative expression of mRNA and enzyme activity of MnSOD in brain and leucocyte cells. The relative expression of mRNA MnSOD was deter-mined by using quantitative Real Time RT-PCR and the enzyme activity of MnSOD using biochemical kit assay (xantine oxidase inhibition). Statistic analysis for mRNA and enzyme activity of MnSOD was performed using Kruskal Wallis test.
Results mRNA of MnSOD in glioma cells of 70 % sample was 0.015–0.627 lower, 10 % was 1.002-1.059 and 20 % was 1.409-6.915 higher than in leucocyte cells. Also the speciic activity of MnSOD enzyme in glioma cells of 80 % sample showed 0,064-0,506 lower and 20 % sample was 1.249-2.718 higher than in leucocyte cells.
Conclusion MnSOD gene expression in human glioma cells are signiicantly lower than its expression in leucocytes cells. (Med J Indones 2010; 19:21-5)
Key words : MnSOD, glioma, gene expression
Glioma is the primary brain tumor frequently found in Indonesia. High grade gliomas such as glioblastoma multiforme often recure within 6 months after surgery,
and despite radiation therapy and chemotherapy, 80
% of patients die within one year. Although ionizing radiation is the most effective treatment modality for malignant gliomas, many of these tumours are resistant to radiation therapy. Therefore, additional therapy, such as gene therapy is needed to improve therapy response.1
Manganese Superoxide Dismutase (MnSOD) is a mitochondrial enzyme that catalyze the conversion
of O2· to oxygen (O
2) and hydrogen peroxide (H2O2).
MnSOD is the major antioxidant enzyme that scavenge superoxide radical, because electron transport chain in mitochondria is the major reactive oxygen species (ROS) production. MnSOD neutralize anion superoxide by two step dismutase reaction. At this process, Mn3+ is
reduced and then oxidized.2
Mn3+ + O 2
•- → Mn2+ + O 2
Mn2+ + O 2
•- + 2H+ → Mn3+ + H 2O2
2H+ + 2O 2
•- → O
2 + H2O2
The decrease in the MnSOD level could elevate the ROS level in mitochondria, leading to oxidative stress including oxidative damage in biomacromolecules, such as protein, lipid and DNA.2 For the past 20 years,
MnSOD activity has been postulated to be low in malignant tumours. Tumour cells generate superoxide and other ROS, and this generation, if it also occurs in vivo, might generate heighten tumour cell proliferation and invasion. It has been hypothesised that the production of ROS combined to a decreased antioxidant enzyme level may be characteristic of tumour cells.3
There is a great amount of experimental data to suggest that the MnSOD expression in cancer cells were low and the malignant phenotype of a cancer cell can be suppressed by raising the MnSOD level. Therefore, it has been hypothesised that the MnSOD gene is a tumour suppressor.4 Overexpression of MnSOD by
gene transfection has been shown to suppress avariety of disorders, including radiation-induced neoplastic
transformation of mouse embryonic ibroblasts, the metastatic capacity of mouse ibrosarcoma cells and
human breast cancer cells, and the growth rate of human
melanoma cells, human transformed ibroblasts, rat
glioma cells, hamster cheek pouch carcinoma cells, and human prostate carcinoma cells.5-8
Nevertheless, the role of MnSOD as a tumour suppressor is still controversial, because explain another study showed that MnSOD expression is high in some of human cancers, include in glioma.9 The level of MnSOD
directly correlates with grade of some tumours and high MnSOD is associated with poor prognosis in some tumours.9 In addition, if MnSOD is really anti-apoptotic,
as it has been observed, MnSOD overexpression in tumours could offer a survival advantage to a tumour cell and lead to treatment resistance.10
Regarding the difference of MnSOD gene expression
in human cancer cells, we want to clarity conirm the
expression of MnSOD in human glioma cells compared with leucocyte cells as control, so we can explore the role of MnSOD.MnSOD expression was analyzed with measuring mRNA of MnSOD and enzyme activity of MnSOD.
METHODS
This study was cross sectional study carried out at Biochemistry and Molecular Biology Laboratory, Faculty of Medicine University of Indonesia within 12
months (April 2007 – March 2008) using 20 of patients
as subjects. The inclusion criteria were a glioma patient with informed consent, who was diagnosed glioma by radiology examination and underwent open surgery craniotomy. The exclusion criteria was a subject with the result of histological examination did not show glioma. Glioma cells samples were obtained by open surgery craniotomy, samples were stored at -70°C or homogenized directly. Leucocyte cells were obtained from blood venous of patients before radiotherapy treatment.Whole blood were collected in EDTA tube to prevent the blood from
clotting. Samples were stored at 2 – 8°C for not more than 24 hours prior to RNA isolation procedures. Procedures followed were approved by Research and Development Committee, Faculty of Medicine University of Indonesia (No. 235/PT.02.FK/ETIK/2006).
RNA Isolation from glioma tissues and from whole blood using Aquapure RNA Isolation Kit (BioRadÒ). The step of RNA isolation followed the instruction that kit were cell lysis, protein-DNA precipitation, RNA Precipitation and RNA hydration. RNA hydration samples were stored at -70°C until use.
Ampliication cDNA using Reverse Tran scriptase
Real Time PCR
RNA samples (both from glioma tissues and whole
blood) were ampliied using iScript One Step RT-PCR Kit with SYBR Green (BioRad). cDNA synthesis and PCR
ampliication were carried out in the same tube. Reaction
protocols were cDNA synthesis for 10 minutes on 50°C, inactivation of iScript Reverse transcriptase for 5 minutes on 95°C, PCR cycles (40 cycles) for 10 seconds on 95°C; 30 seconds on 59°C (after optimalization); 30 seconds on 72°C, Melt curve analysis for 1 minutes on 95°C; 1 minutes on 55°C; 10 seconds on 55°C
(80 cycles, increase 0,5°C every cycles). Primer for
MnSOD gene were gcactagcagcatgttgagc (Forward) and acttctcctcggtgacgttc (Reverse) with amplicon size
were 216 bp. 18S rRNA was used as external standard, ampliication procedures same as MnSOD gene. Primer for 18S rRNA were aaacggctaccacatccaag (Forward)
and cctccaatggatcctcgtta (Reverse) with amplicon size 155 bp. Primers for this reaction were design by Primer3 programme and Primer Analysis software.
Sequence for MnSOD (NM_000636) and for 18S
The MnSOD enzyme speciic activity
Tissue samples (10-20 mg) were homogenized in 600 µl Nuclei Lysis Solution, PromegaÒ on ice. The
mixture was incubated on 65 °C for 10 minutes. The homogenate tissue kept at -200C before use. Whole
blood (200 µl) was added into 600 µl of red blood cell lysis solution (Promega). The mixture was incubated for 10 minutes in room temperature and centrifuged at 16000 rpm for 20 seconds. The white pellet containing leucocyte cells was collected and lysis with 200 µl of nuclei lysis solution (Promega). Lysates were diluted 5 times with PBS and kept at -200C before use.
The MnSOD enzyme speciic activity was biochemically
determined using RanSOD® kit. To inhibit the Cu/
ZnSOD, irstly natrium cyanide (5 mM) was added
into each sample and the mixture was incubated for 5 minutes in room temperature. Xantin oxidase was then added into the mixture, followed by measurement of light absorbance using spectrophotometer at 505 nm after 30 seconds and 3 minutes. The enzyme activity was calculated as a percentage inhibition of the samples
plotted to the standard curve. The speciic activity of
MnSOD enzyme was calculated as enzyme activity (in Unit) per mg protein. Protein concentration was measured
using spectrophotometer at 280 nm and plotted to the BSA
(Bovine Serum Albumin) standard curve. The results of MnSOD mRNA are a ratio or relative mRNA expression,
so MnSOD speciic activity of human glioma cells will be
compared with leucocyte cells to get the ratio value.
RESULTS
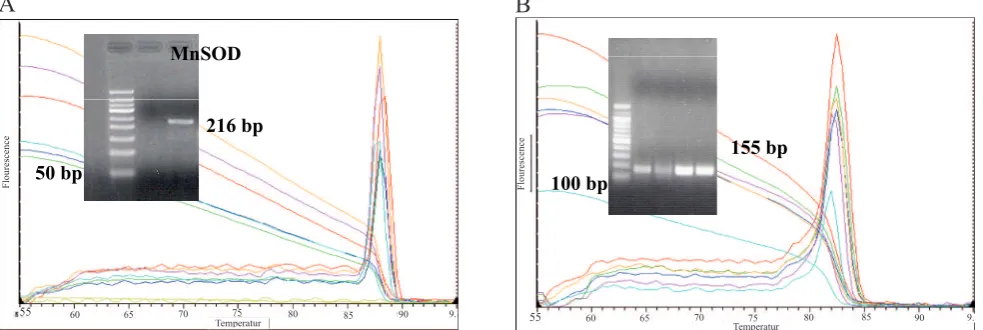
Figure 1 shows melting curve analysis for MnSOD
gene (A) and 18S rRNA (B). Electrophoresis results showed the product of ampliication, only one band for MnSOD gene (216 bp) and for 18S rRNA (155 bp). The result of mRNA MnSOD was deined by calculating threshold cycle (Ct) number (igure 2). The
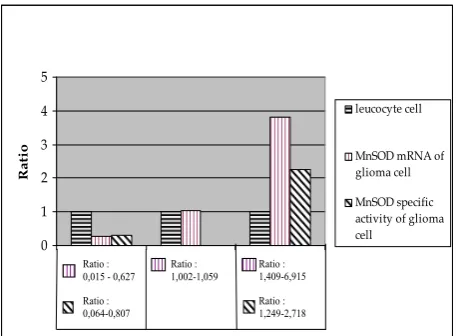
results showed that mRNA MnSOD in 70 % sample distribution of glioma cells was 0,015 – 0,627 lower than control, 10 % sample distribution was 1,002-1,059, and 20 % sample distribution was
1,409-6,915 higher than control. Also, the speciic activity of MnSOD enzyme in 80 % sample distribution of
glioma cells showed 0,064-0,506 lower than control
and 20 % sample distribution was 1,249-2,718 higher than control (igure 3). The value of MnSOD mRNA & speciic activity every glioma samples are compared
with leucocyte as control, therefore the values of glioma samples are relative expression (ratio) with value “1”
for control (igure 4). Analysis of statistic for mRNA
and enzyme activity of MnSOD using Kruskal Wallis
test was signiicant between groups of distribution
sample (p < 0.01). Spearmen’s correlation analysis showed that there were linier relationship between
mRNA and speciic activity of MnSOD enzyme with moderately relationship and statistically signiicant (R
0.699, p< .01).
Figure 1. Melting Curve Analysis. Insert: Electrophoresis on 2 % agarose gel for (A) MnSOD gene (216 bp); (B) 18S rRNA gene (155 bp)
MnSOD
216 bp
50 bp
Temperatur
Flourescence
55 60 65 70 75 80 85 90 9.
155 bp
100 bp
Temperatur
Flourescence
55 60 65 70 75 80 85 90 9.
DISCUSSION
The igure 1 showed one peak in melting curve analysis
and one band in electrophoresis, which were meant that
the primer was speciic. The concept of the threshold
cycle (Ct) is at the heart of accurate and reproducible
quantiication using luorescence-based RT-PCR.
Fluorescent values are recorded during every cycle
and represent the amount of product ampliied to that point in the ampliication reaction. The more template
present at the beginning of the reaction, the fewer number of cycles it takes to reach a point in which
the luorescent signal is irst recorded as statistically signiicant above background. This point is deined as
the Ct and will always occur during the exponential
phase of ampliication.
The results showed that mRNA MnSOD in 70% sample distribution of glioma cells was 0,015–0,627 lower than control, 10% sample distribution was 1,002-1,059 and 20% sample distribution was 1,409-6,915 higher than
control. Also the speciic activity of MnSOD enzyme in 80% sample distribution of glioma cells showed
0,064-0,506 lower than control and 20% sample distribution
was 1,249-2,718 higher than control (igure 3). The value of MnSOD mRNA & speciic activity in every
glioma samples is compared with leucocyte as control, therefore the values of glioma samples are relative
expression (ratio) with value “1” for control. (igure
4). Analysis of statistic for mRNA and enzyme activity
of MnSOD using Kruskal Wallis test was signiicant
between groups of distribution sample (p<.01). Correlation analysis using Spearmen’s correlation showed that there were linier relationship between
mRNA and speciic activity of MnSOD enzyme with moderately relationship and statistically signiicant (R
0.699, p<.01).
The results indicated that MnSOD gene expressions in most of human glioma cell are lower than leucocyte cells as a control. This study has the same result as the previous study which was explored the role of MnSOD as suppressor tumour which was found consistenly low in cancer cell.4
The lowered of MnSOD mRNA expression has not been understood until now. Perhaps it was conducted with mutation. Mutation on MnSOD promoter can cause the MnSOD mRNA alteration. MnSOD mutation that was reported was mutation on promoter of MnSOD in breast cancer.4 However, the mutation on glioma
MnSOD promoter has not been found until now.
Fluorescence
Figure 2. Fluorescent curve in RT- PCR. Ct: Cycle threshold, NTC: Non template Control
Figure 3. Samples distribution of MnSOD mRNA and
MnSOD enzyme speciic activity which is signii cantly different between groups (p < .01)
Figure 4. Relative Expression (ratio) of MnSOD mRNA and MnSOD enzyme speciic activity in glioma
The MnSOD speciic activity in this research was equally low. The lowered of MnSOD speciic activity may related
with polymorphism and redox state. be what other study specify clearly suggest that genetic polymorphism in the human MnSOD gene may be associated with a risk of developing cancer.11 Two polymorphic variants at codon
16 that lead to incorporation of either alanine or valine in the mitochondrial targeting sequence are frequently detected in humans. The valine at this position was predicted to changethe mitochondrial targeting sequ-ence conformation from the preferredamphiphilic helix to a combination of an amphiphilic helix anda ß-pleated sheet, possibly interfering with the transporteficiency of the mature MnSOD protein, potentially decreasing its functional effectiveness.12 Moreover, the lowered of
MnSOD speciic activity in this study maybe was related
with redoxs state. The lowered antioxidant capacity and the oxidant-antioxidant imbalance have been considered to play a role in multistage carcinogenesis.3 Tumour
cell produce high reactive oxygen species (ROS) and MnSOD as antioxidant has a function to reduce ROS. As a results, so the lowered activity of MnSOD in this study was caused by consumption this enzyme. Tumour cells may overproduce ROS because the NADPH-oxidase is regulated by the GTPase RAcI, which is a downstream of the proto-oncogene Ras.13
In this study, there was 20 % of sample distribution which has higher MnSOD gene expression (both mRNA and activity MnSOD). This condition may be conducted with grade of tumour malignancy and the responses of therapy treatments. Other studies also found the following results: (1) the higher MnSOD expression in many human cancers, (2) the level of MnSOD directly correlates with the grade of some tumours, and (3) high MnSOD is associated with poor prognosis in some tumours.9 The high levels of MnSOD
expression by tumor cells could impair the patient’s tumour immunosurveillance capability. Those studies would predict that malignant gliomas constitutively expressing a high level of MnSOD in vivo would be resistant to endogenous TNFa-mediated tumor killing. If this were found to be true in vivo, tumours producing MnSOD may evade the host tumor immunosurveillance mechanisms.9 Therefore, the further studies are required
to analyze the correlation this MnSOD expression with grade of tumour malignany and therapy response. In conclusion, MnSOD gene expression in human
glioma cells are signiicantly lower than its expression
in leucocytes cells.
Acknowledgment
This work was funded by Riset Pembinaan Ilmu
Penge-tahuan Teknologi & Kedokteran (RISBIN IPTEKDOK)
2007. The authors would like to thank Ahmad R. Utomo, PhD at Stem Cell Institute (SCI, Kalbe Farma) for insightful discussions. In addition, we thank to dr. Wawan Mulyawan SpBS (RUSPAU); dr. Renindra Ananda, SpBS (RSCM); dr. Agus Yunianto SpBS (RSPAD) and dr. Syamsu Azhari, SpBS (RSKD) for kindly helping us to collect the sample from glioma patients.
REFERENCES
Kanzawa T, Ito H, Kondo Y, Kondo S. Current and future 1.
gene therapy for malignant gliomas. Journal of Biomedicine and Biotechnology. 2003; 1:25-34.
Halliwell B, Gutteridge JMC. Antioxidant defences: endogenous 2.
and diet derived. In: Free radicals in biology and medicine. 4th
ed. London. Oxford University Press. 2007:79-95.
Toyokuni S, Okamoto K, Yodoi J & Hiai H (1995) Persistent 3.
oxidative stress in cancer. FEBS Lett. 358: 1-3.
Oberley LW & Oberley TD. Role of antioxidant enzymes in 4.
the cancer phenotype. In: Clerch LB & Massaro DJ editors. Oxygen, gene expression and cellular function (Lung Biology in Health and Disease). New York: Marcel Dekker Inc, 1997; p. 279-307.
St Clair DK, Wan XS, Oberley TD, Muse KE & St Clair WH. 5.
Suppression of radiation-induced neoplastic transformation by overexpression of mitochondrial superoxide dismutase. Mol Carcinogen. 1994; 6:238-42.
Safford SE, Oberley TD, Urano M & St. Clair DK. Suppression 6.
of ibro sarcoma metastasis by elevated expression of manganese superoxide dismutase. Cancer Res. 1992; 54:4261-5.
Li J-J, Oberley LW, St. Clair DK, Ridnour LA & Oberley TD. 7.
Phenotypic changes induced in human breast cancer cells by overexpression of manganese-containing superoxide dismutase. Oncogene. 1995; 10:1989-2000.
Venkataraman S, et al. Manganese superoxide dismutase 8.
overexpression inhibits the growth of androgen-independent prostate cancer cells. Oncogene. 2005; 24:77-89
Cobbs CS, Levi DS, Aldape K & Israel MA. Manganese 9.
superoxide dismutase expression in human central nervous system tumors. Cancer Res. 1996;56:3192-5.
Manna SK, Zhang HJ, Yan T, Oberley LW & Aggarwal 10.
BB. Overexpression of manganese superoxide dismutase suppresses tumor necrosis factor-induced apoptosis and activation of nuclear transcription factor-κ B and activated protein-1. J Biol Chem. 1998; 273: 13245-54.
Clair DS. Manganese superoxide dismutase: genetic 11.
variation and regulation. J.Nutr. 2004; 134:3190-1. Ambrosone CB, Freudenhem JL, Thompson PA, Bowman E, 12.
Vena JE, Marshall JR, et al. Manganese superoxide dismutase (MnSOD) genetic polymorphism, dietary antioxidants, and risk of breast cancer. Cancer Res. 1999; 59:602-6.
Brown NS, Bicknell R. Hypoxia and oxidative stress in 13.