Measurement
and
Empirical
Equation on
Several
Education
Zones
in
Surak
afta:
Noise
Mitigation for
Students
lka Setiyaningsih .
!!::t":'.
O_neof
transporration negative impacrto
environment is traffic
li:t::r"::ff.11:.^i91o.urion
suih _as education zone, traffic noise can interfere srudenr,i leaming process. The aimo'
ri.,,
,Jr.liffiT;":H
traffic noise level obtained 6y using sirr,r
"ii..piri;;i;il;;":#i;
provide alternative problems sblvingior each
l"."ti"r.
This research was conducted on six schoolsrso
ai
Islam and MAAl
Islam Jamsaren (Jl. Veteran). SMKNs
"JiLibN
ii'1il.
e,. yani), and SDNKleco
II
and sMp Muirammadiyah s 1n.sru-.t
liyaoir.Data obrained such
as
traffic flow,
vehicles speei,-and
p....nffi',of
healy vehicles were analyzedwith
noise level models UaseOoi
pd
T_10_2004_8. Direct measurement was done by using Sound Level Meter (SLM)*friJ *^.0"i
Lill,iiff.]h.
road andn.*
tri,
,.r,""rt-u"irliig
in .u.r, location duringIn
conclusion' noise level by direct measurement and empirical equation were generally exceeding noise standard fo..Ouruiion zone, i.e. 55 dB (A). Noise mitigation can6e
done;y-;il;idi,"[.ruuon
u.
baniers and designing school wall with combination material (bricks and glasses). Keywords: education zone, noise, traffic , Sound Level MeterI.
Introduction
A *
road system provides extensive benefitsin
termsof
the economic andli'-"/
social welrbeinsof th"
"ommuniry.
rro*.u.,,
we need to reach a balancel!*nXfi
:lJiTi","ff
:9t';;"##"infr
astrucur"il;;;;ilingthe
The increasing in revenue per capita affects
thlamo,nt
of public ownership
of
private vehicles such as,'oior.y"i*,
*J"u*.
The development
of
regional*
economy resulted
in
a progressively increasing community activities so that the movement of vehicles on roads has increased as well. Road segmentsin
Surakarta city have already crowdedwith traffic flow
which gives negative impact of noisepollrtion.
Noise at some sensitive locations such as education zone, particularlythose located
in
major
urban road,is
neededto
be
addressedin
ordernot
tobecome more severe.
sDN
Kleco2
and SMP Muhammadiyah5
are located at Jl. Slamet Riyadi,which is the arterial road
in
Surakarta. SMKN 6 and SLTPNl2,located
atJl'
A.Yani which is
the entranceto
Surakartafrom
the west, so that thedaily traffic
volume is very high.While
SDAl
Islam andMA Al
Islam Jamsaren is located atJl. Veteran. which is linked to East Java and Central Java by south route, in which
many heavy vehicles and buses passed by.
Noise
is
more thanjust
a nuisance sinceit
constitutesa
real and present danger to people's health. Day and night, at any places, noise can produce seriousphysical and psychological stress. No one is immune to this stress. People appear
to adjust to noise by ignoring it but the ear, in fact, never closes. The body at times
still responds with extreme tension, such as to a strange sound in the night.
II.
Objective
The objective
of
this paper isto
comparetraffic
noise level value betweendirect
measurementand empirical
equation,to
determinehow
traffic
noiseconditions
in
the zoneof
education and suggest altematives waysto
solve theproblem.
It
is important because noise exposure in the long term and continuously is very dangerous for human health. Traffic noise could be a problemif
the valueexceeds
the
threshold noise standardfor
land use that have been defined. To obtain noise levelby
direct measurement, SLM was located at close to road sideand receiver (the outer side
of
schoolwall)
and predictedtraffic
noiseby
usingempirical equations
from
data such astraffic
volume,traffic
characteristics, and environmentalcondition.
Basedon
noise standardif
noise level
exceed the acceptable value, thenthis
study also suggest some altematives noise mitigationthat can be applied on each location.
III.
Traffic
Volume
Quut = Qrn + Qav +
Quc
e)
Heavy vehicles percentage can be calculated
by equation:
/)
o/oP,y
=
ZIY-
xl1yo/o4..
,
(3)IOlal
IV.
Understanding Noise
A.
Noise Scale and Definitionsound
is
technically describedin
termsof
theloudness (amplitude)
of
thei^"yj_Td
feeuelgv
(pitch) of the sound. The standard unit of meaJurement of the loudness of sound is the Decibel (dB). Since the human"*
r,""i "q*ily
sensitiveto
sound atall
frequencies, a special frequency-dependentrating scale has been
revised to relate noise to
human,.nritiuity.-nl
o;;d;iHir"ii.""
(dBA)compensates
for
this
studyby
discriminatingagainst frequencies
in
a
mannerapproximating
the sensitivity
of
trrerrum-ari
ear.
Decibelsare
basedon
the logarithmic scale.The
logarithmic*ur"
"-o-pr"sses
the wide
rangein
soundpressure levels
to
a
more usabre rangeof
'db"^ r";;;;:,;ilar
to
the Richter scale used to measure earthq'ikes.In
terms of human response to noise,the difference
of l0
dBA
is judgeatl, u"
rt"i""
as loud andwith
i6
an lay u.ing
four times as loud ana so
ror*r]
B".rya"v
r"i-d.
,ro.-ully
rangefrom
30 dBA(very quiet)
to
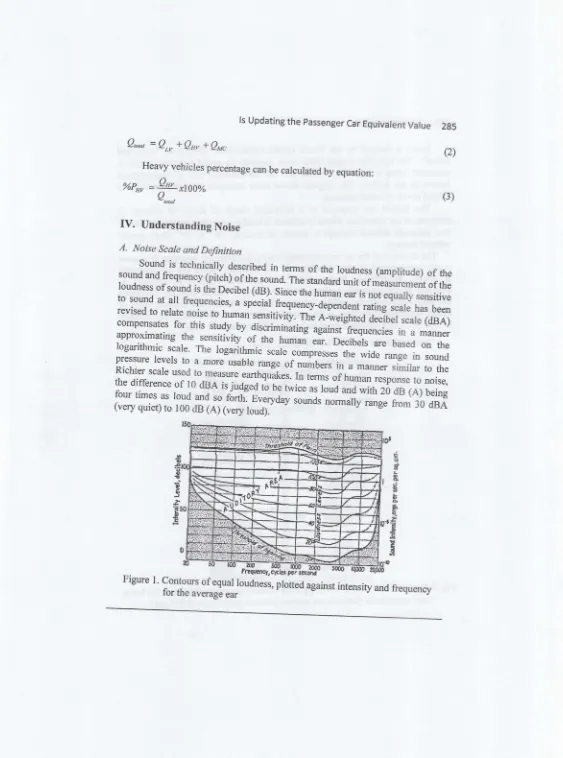
100 dB (A) (very toud). [image:3.595.16.579.24.782.2]€ q F Io e J e & A
a
s E Es
Figure r .
Noise
is
definedby the
world
Health organisation(wHo)
as .lmwantedsound". The intensity
of
perceived noise dependson
sound pressure,which
ismeasured using
a
logarithmic scale andthe
conventionalunit
of
measurement known as the decibel. The diagram shows some examplesof
noise sources and related levels ofsound pressure.The human ear
respondsto
a
frequency rangeof
about
r0
octaves.It
responds to air vibrations whose amplitude is hardly more than molecular size;
it
also responds
without
damageto
soundsof
intenjity
1013to
l0ra times greater without damage.The response of the ear is not proportional to the intensity, however.
It
is morenearly proportional
to
the
logarithmof
the
intensity. Sincethe ear
responds{ifferently
to
different
frequencies,the
logarithmic relation
of
intensity
to loudnessis not
generally perfect,but
it
is
eisier to
handle thanthe
enonnousnumbers involved
in
the audible intensity range. Therefore, the intensity levelof
sound is defined
in
decibels- asl0
times the logarithm of the ratio of the intensity of a sound, I, to a reference level defined as 10-t erg/cm%ec. Thus:Sound intensity level (SPL), decibels =
thlt
I
'8,0
lUo
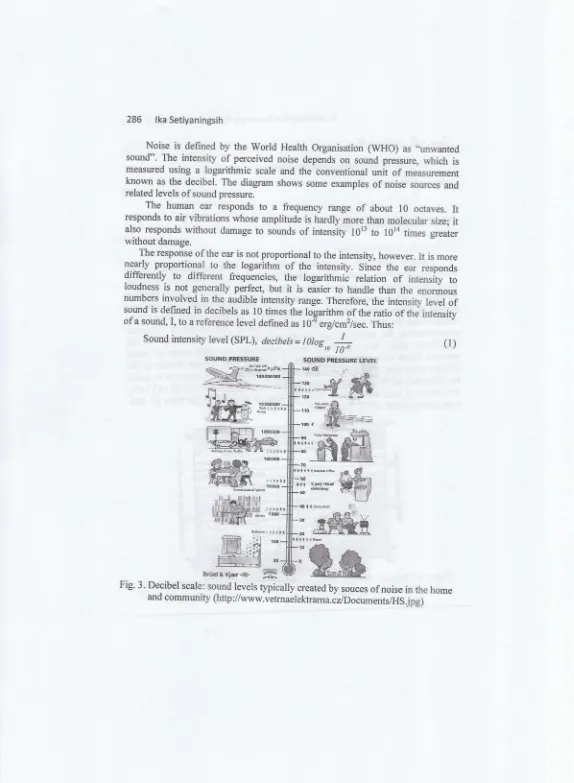
(1)SOUND Prc5SURE LEVEL
e ,*ru""r* ,g. q$
:"*ff'w
Broet&
Kj*r"#. ffi
Fig. 3. Decibel scale: sound levels
typi;lt
created by souces of noise inthe home and community (http://wrvw.vetrnaelektrarna.czlDocumentslHS
jpg)
sOUilD}RESSURE
ffi
4Qt,l6hhi Sl:
6{!'..,
-
affi'ffi
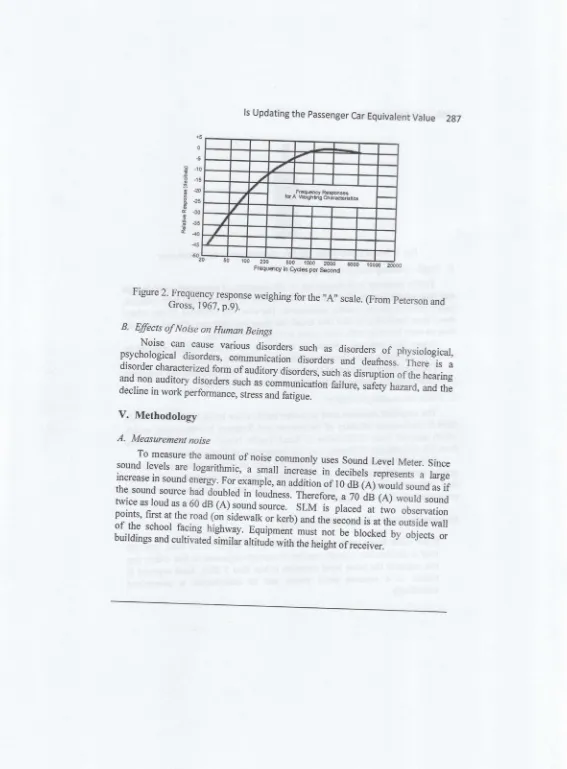
[image:4.595.1.575.27.810.2]r5
s
-10
"15
-20 -?5
I
€51
;l
[image:5.595.14.581.31.800.2]1000
Figure 2'frecuencv-;esponse weighing for the
"A"
scale. @rom peterson and Gross, 1967,p.9).B.
Efectsof
Noise on Human BeingsNoise can
causevarious
disorderssuch-as
disordersof
physiologicar,psychological
disorders, communication disordersand deaftess. There
is
adisorder characterized form of audito.y
ai*Jor,
sugh-as disruption of the hearing and non auditory disorders such as communication
failure,
safety haz.ard, and the
decline in work performance, stress and fatigue.
V.
Methodology
A.
Measurement noiseTo measure the amount
of
noise commonly usessound Level Meter. since
:::1"lTl
are logarithmic,
a
small
;;;:"
in^decibels representsa
largemcrease m sound enerqy. For exampre, an addition
of l0
dBaiffi;
sound asif
the sound source hadioubred
i"
d;a;;r.
Therefore, a
70
dB(A)
would soundtwice as loud as a 60 dB (A) sound
ro*"..
'
iinl
ir
placed
at
two
observation points, first at the road (on sidewalk ort
.rufana
the second is at the outsidewall
of
the
schoolfacins
Tgnry-"v nquiprn"ni'n,ust not be
blockedby
objects orbuildings and cultivarted similar
Fig. 4 Sound Level Meter (SLM) . Source : www.brighthub.com
B.
Trafric counting and spot speed survey-
fraffic
counting is distinguished by the direction of movement, vehicle type andtime-of
the survey. Typeof
vehicle consistsof
motorcycles,light
vehicies,healy
vehicles (buses, trucks, containers). The data wascoliectei
a*ing
schooldays, from
teginning to
end (the break not observed) that was dependon study time on each location, with observation periods
of l5
minutes.Travel time data was obtained by measwing the amount
of
time required by each type of vehicle to go through a segment of road (100 meters).For the implementation,
of
these surveys, ttrisst'dy
requiredthe folrowing
tools: hand counter, stopwatch, tape measure, stationery, ibrrns.
C.
Noise calculation procedures_
-
T"
empirical equation used to predict traffic noise levels based on pdr-10-2004-8 (Indonesian
Ministry
of
settlements and Regional Infrastructure) model,which
adoptedfrom 'calculation
of
RoadTraffic
Noise,-the coRTN
model from
UK
Department of Transport or UK Department of Environment.calculation procedure is divided into the form of mathematical
equations and graphs, and calculation can be used for distance from the side of
the road no more
than 300
meters andwind
speedsbelow
2
m
/
sec.The
above stepsin
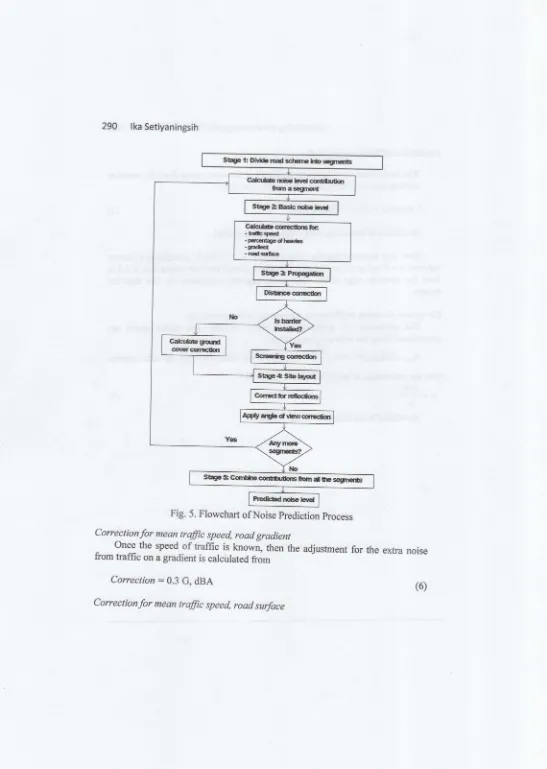
the procedures are shown in Figure 5.Dividing
therood
schemeinto
segmentsIf
the noise levelsvary
significantly along the lengthof
the road, then theroad is divided into
a
small-numlel0f
separate segments so thatwithin
any one segment the noise level variationis
less than2 dBA.
Each segment is [image:6.595.15.580.24.800.2]Prediction of basic
noise levelsThe basic noise level hourly is predicted at
l0
meters away from the nearsidecarriageway according to the following equation:
L
(nurly)
:
42.2 +10log q,dBA
(3)In which 4 is the hourly traffic flow (vehicles/hour).
Here
it
is assumed that the basic velocityy:75
km,4q percentage of heavy vehicles p:
0 and gradientG:Io/o.It
is also assumed that the source line is 3.5 mfrom
the nearside edgeof
the roadfor
carriageways separatedby
less than 5.0 meters.Conectionfor
mean traftic speed, percentage of heavy vehiclesThe correction
for
percentageof
heavy
vehiclesand
traffic
speed aredetermined using the following expressions:
L,
oy
=
33lo EroQt + +of91+
t otog,o (1 JZn )-
6s.g,d{.a)
(4) rn
trris
expres-sion the percentage ofheavy vehicles is given by:t
00f
p=:
q
In
which/is
the hourly of heavy vehicles.Correctionfor mean
trffic
speed, road gradientonce
the speedof traffic
is known, then the adjustmentfor
the exfia noisefrom traffic on a gradient is calculated from
Correction:0.3
G,dBA
(6)Correctionfor mean
trffic
speed, road surfaceStage tt Dtui5 rcad sclatp fO segng|b
Calfl*rx** tt,r*oatt-utill frsra$gBsil
StryaZ B*icrxtselevg
Stage
*
Cffislre cortlilhns tEm X Ae seUnm*s [image:8.595.24.571.19.788.2]Table I. Road Pavement Surface Correction
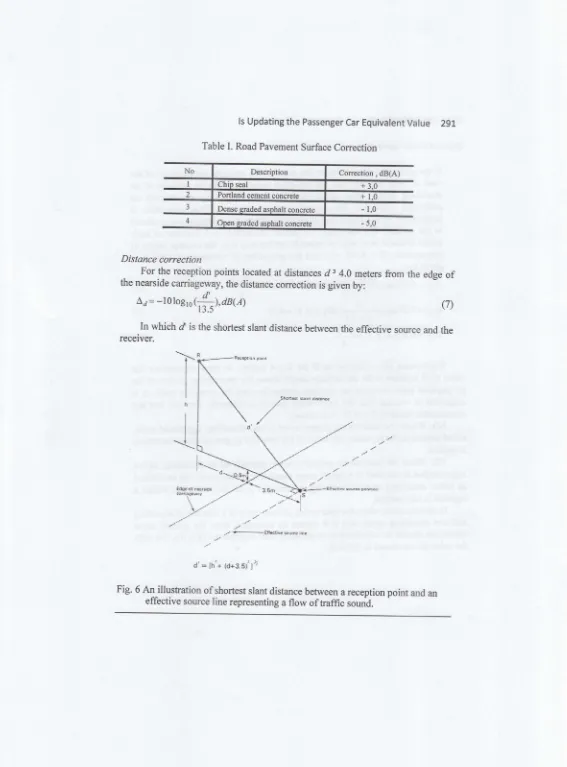
Distance correction
-
For the reception points located at distancesd3
4.0 meters from the edgeof
the nearside carriageway, the distance correction is given by:
Aa =
-l
0 losro{{r),
aaee) (7)In which
d
is the shortest slant distance between the effective source and thereceiver.
T
{
d'*
[h'+ td+3.$t"]tFig. 6 An illustration of shortest slant distance between a reception point and an
effective source line representing a flow
oftraffic
sound./,
/ %efaetivss6ce tin(
y;s
t-\
I [image:9.595.11.578.26.793.2]G ro u nd cove
r
co rrectio nIf
the ground surface between the edgeof
the nearside carriagewayof
the roador
road segment and the receptionpoint is totally or partially
of
an absorbingnature, (e.g.
grassland, cultivated fields
or
plantations) anadditional correction
for
ground cover
is
required.
This
conection
isprogressive
with
distance and particularly affects the reception points closedto
the ground. The correctionfor
ground absorption as a functionof
hori-zontal distance from edge of nearside carriageway
dm,
the average heightof
propagation,
H
:
0.5(h+l),
and the proportionof
absorbent ground,{
isgiven by:
Acc=5.2nocrref#),dB(A)if
0.7s311.!!1
(8)Lcc=5.2Itog,o( .
"'"'d
1-),
dB(A)f
H <0.75 +3.5)+5
A,6a-=0,d8(A)if H
>:-
6
(e)
(10)
Expressions
(8)
-
(10)
arevalid for d > 4
meters.In
these expressions thevalue
ofH
is taken to be the average height above the intervening groundofthe
propagation paths between the segment source line and the reception point.It
is suggestedto
assume thatthe
intervening groundis primarily flat
and that theapproximate value of
H:0.5(1
+ h) meters.NB.
where the intervening ground cover is non-absorbing, e.g. paved areas, rolled asphalt surfaces, water, the valueofl
is zero and no groundcovir
correctionis applied.
NB. when
the intervening ground cover is partiallyof
an absorbing, naturesegmentation is required to separate areas where the ground cover can be defined
as either absorbing
or
non-absorbing, so thatthe
2
dB
(A)
variationwithin
a segment is not reached.In certain cases, when the intervening ground cover is a
mixtwe
of absorbingand non absorbing areas, and
if it
cannot be separated then, the ground cover correction should be calculatedin
accordancewith
expressions (g)-(10), butwith
o/o ofabsorbent ground cover
within the segment *
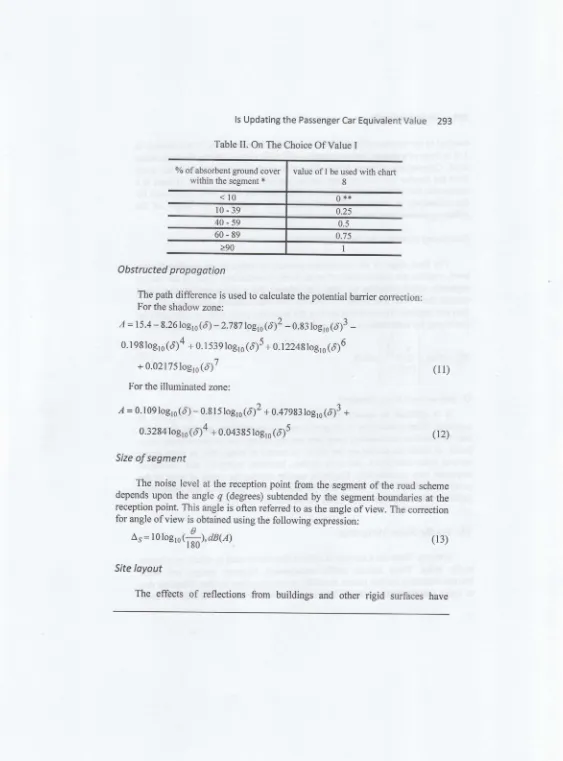
Table
II.
On The Choice Of ValueI
O bst
ructed
p ro po g otio nThe path difference is used to calculate the potential barrier correction: For the shadow zone:
A = | 5.4 -8.26 log,s (d)
-
2.7 87 togro(6)2-
O.S: tog,o (d)3 -0. I 98 log,o(d)a
+ 0. I 53 9 log, o (d)5 +0.t2248togr, (6)6
+ 0.021 75 log
,o(6)7
(l
1)For the illuminated zone:
I
= 0. 109 logro (d)-
0.8 15 log,o (d )2 + 0.47 983tog,o (d)3 +0.3284 log,o
(d)4
+ 0.043 85 log,o (d)5(r2)
Size of
segment
The noise level at the reception
point
from the segmentof
the road scheme depends uponthe
angleq
(degrees) subtended by the segment boundaries at thereception point. This angle is often referred to as the angle of view. The correction
for angle of view is obtained using the following expression:
c
As=
r0logls(ii,dB(A)
(13)Site
loyout
[image:11.595.15.578.28.789.2]resulted in the increase
ofnoise
level and need to be considered.Ifthe
receiver isI
m in front of a fagade, then a correction of 2.5 dB(A)
is added to the basic noise level. calculationsof
noise levels along side roads linedwith
housesbut
awayfrom the facades has also required similar addition
of
the 2.5 dB(A).If
there is acontinuous line ofhouses along the opposite side
ofthe
road, then a correctionfor
the reflections
is
required.The
correctiononly
appliesif
the height
of
the reflecting surface is at least 1.5 m above the road surface.Combi ni ng co ntri bution fro m seg m ents
The
final
stageof
the calculation process,to
arrive at the predicted noise level, requires the combinationof
noise levels contributionsfrom all
the source segments, which comprise the total road scheme. For a single road segment roadscheme there is no adjustment to be made. For road schemes consisting
of
more than one segment the predicted level at the reception point shall be calculated bycombining the contributions,
Li,
fromN
segments using the following expression:(
r,\
I A/ :-:l
z/,oj=rotog,.l
itotu
l,aa14
(14)rv
l;=t
I
tJ
D.
Indonesian's Noise StandardIt
is
difficult
to
specify noise
levelswhich are
generally acceptable toeveryone.
what
is annoying to one person may be unnoticed by another. Standardsmay be based on documented complaint activity in response to documented noise
levels, or based on studies on the
ability of
peopleto
sleep,talk,
orwork
undervarious noise conditions.
All
such studies, however, recognizethat
individual responses vary considerably. Standards usually address the needsofmost ofthe
general population. The Environmental Ministriesof
Indonesia has established guidelines for acceptable noise levels for various land use types.VI.
Tlaffic
Noise
Mitigation
In theory, there are a number of options that can be used to reduce or mitigate
traffic
noise.
Theseinclude
traffic
management,highway
design,and
noise barriers including earthen berms. In reality, noise mitigation is often infeasible dueoutweigh the benefits.
Any
specific mitigation meas're recommended as part of aproject must be feasible and have a reasonable cost in relation to the benefit.
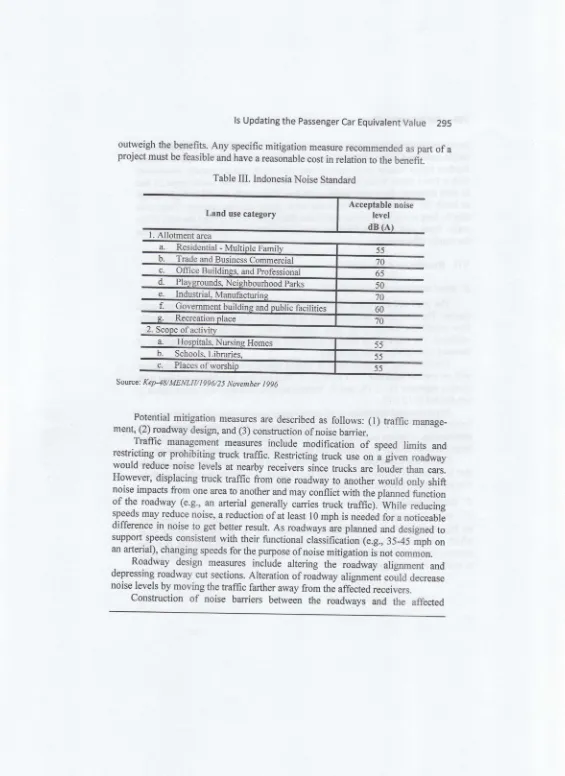
Table
IIL
Indonesia Noise StandardLand use category Acceptable noiselevel dB
Sovce: Kep-48/MENLH/ I 996/2 5 Novenber I 996
Potential
mitigation
measures are described asfollows: (1) traffic
manage-ment, (2) roadway design, and (3) construction of noise barrier.
Traffic
management measuresinclude modification
of
speedlimits
and restrictingor
prohibiting trucktraffic.
Restrictingtruck
use on a given roadwaywould reduce noise levels at nearby receivers since trucks are
loider
than cms. However, displacing trucktraffic
from one roadwayto
anotherwould only
shiftnoise impacts from one axea to another and may
"onfli"t
with the planned functionof
the roadway (e.g., an arterial generally carriestruck traffic).
while
reducingspeeds may reduce noise, a reduction
ofat
least 10 mph is needed for a noticeable differencein
noise to get better result. As roadways are planned and designed to support speeds consistentwith
their functional classification (e.g., 35-45 mph on an arterial), changing speeds for the purpose of noise mitigationiinot
common._
Roadway design measuresinclude altering the ioadway alignment
anddepressing roadway cut sections. Alteration of roadway alignment
"oild
d."r"u."
noise levels by moving the traffic farther away from the affe.-cted receivers.
construction
of
noise
barriers betweenthe
roadwaysand
the
affectedTrade and Business Commercial
55
t9
65 50!e
60 70 Office Buildines. and [image:13.595.15.580.27.803.2]receivers
would
reduce noise levelsby
physically blocking the transmissionof
traffic-generated noise. Barriers can
be
constructed aswalls or
earthen berms.Earthen berms require more right-of-way than walls and are usually constructed
with
a3to-l
slope. using this requirement, a berm 8 feettall
would slope 24 feetin
each direction,for
a totalwidth
of 48 feet. Noise walls should be high enoughto
break the line-of-sight between the noise source and the receiver. They must also be long enough to prevent significant flanking ofnoise around the endsofthe
walls. open
wall,
such asfor
drive ways and wallavays can significantly reduce the barrier effectiveness.VII.
ResultsAnd
Discussion
E.
Road condition and environmentThe road condition
and environmentat
all
locationsin
general are quitesimilar. The three roads are main roads in the city
of
Surakartawith
mixedtraffic
flow
conditions (motorcycle,light
vehicles, heavy vehicles, and un-motorized vehicles). The slopeofthe
road is considered 0%(flatroad)
and the conditionof
the road is asphalt concrete pavement.
The difference is type of road: Jl. Slamet Riyadi is a four lane two-way srreet with no median separator (4
I 2uD),J1.
A.yani
is a four lane two-way streetwith
median separator (4I 2 D),
and Jl. Veteran are two-lane two-way street which isnot divided
Q
l2UD).
Environmental conditions at all school areas have barrier
with
a road madeof
bricks (on the SDN Kleco 2,
sD
Al-Islam Jamsaren,MA
Al
Islam Jamsaren), thecombination of bricks and plant (on
sMp
Muhammadiyah 5 andsLTpN
l2),
and, large trees (on SMKN 6), although the height and density of plants are varying.Fences and plants can absorb the noise so that the sound received by a person
that is across the barrier
will
be lower than the sound heard by people when there was no obstacle between the sound source and the receiver.F.
Existingtrffic
noise levelTraffic
noise level based on direct measurement by usingSLM
is describedon
Fig. 7
-Fig.
12.rt
can be immediately seen thatfor all
location, noise levelwhich
are reached more than55 dB (A),
both near the road side and near the+Existingnoise level (nearwall)
--.-Predictednoise level (nearwall)
;ffJHr:::ffti.H::L
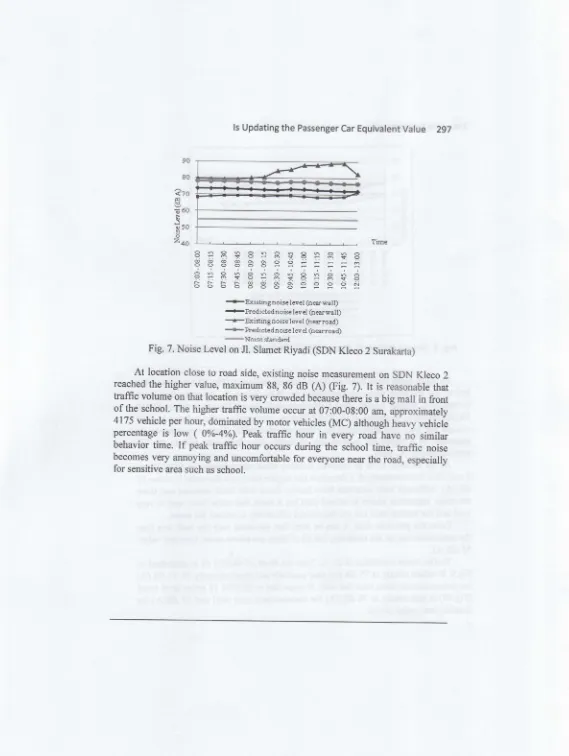
Fig. 7. Noise
reveffi'3I#:ffu"oi
(sDN
Kreco2Surakarra)At
location close to road side, existing noise measurement onsDN
Kleco 2 reached the higher value, maximum 88, 86 dB(A) (Fig.
7).It
is reasonable thattraffic
volume on that location is very crowded because there is a big mall in frontof
the school. The highertraffic
volume occur at 07:00-0g:00 am, approximately 4175 vehicle per hour, dominated by motor vehicles(MC)
although heavy vehicle percentageis low
(
0%-4%). Peaktraffic
how
in
every road haveno
similarbehavior
time.
If
peaktraffic hour
occurs duringthe
schooltime, traffic
noise becomes very annoying and uncomfortable for everyone near the road, especiallyfor sensitive area such as school.
F:FEEifSEiRSF
8388899==:=::
FiSsEFfi+s!3s8
[image:15.595.17.586.21.777.2]80
?zo
660 -l
z
40
EeS$8sR$8s8$8!8
8888899===:=:rr
qh9qlQhaqQno6oho 9-q1 99:nS9-q$oJo
trtrhtr99*qdoooci^iAi6i
* Existingnoise level (nearwall) -..*Predictednoise level (nearwall) -""**Existingnoise level (nearroad)
*s*Predicted noise lev el (narroaQ
^,*.,**" Noise st n.hfd
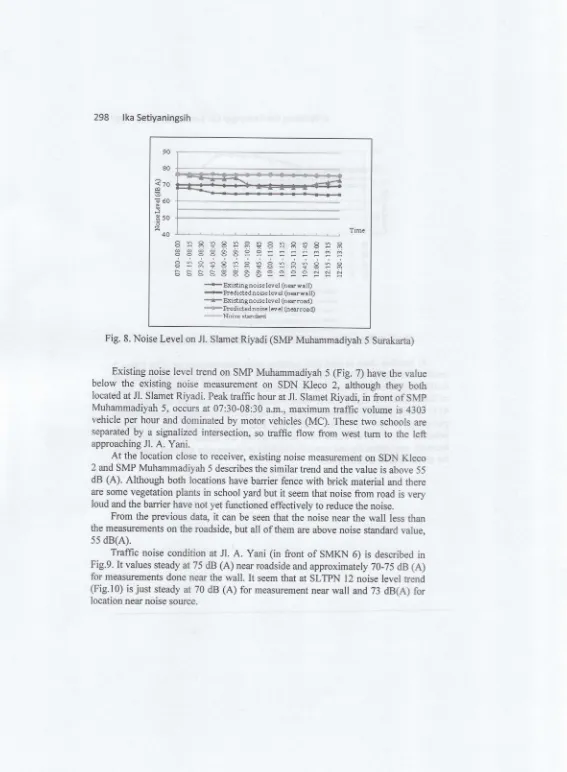
Fig. 8. Noise Level on Jl. slamet Riyadi (SMp Muhammadiyah 5 Surakarta)
Existing noise level trend on SMP Muhammadiyah 5 (Fig. 7) have the value
below the existing
noise measurementon
SDN Kleco
2,
althoughthey
bothlocated at Jl. Slamet Riyadi. Peak traffic hour at Jl. Slamet Riyadi,
in
frontof
SMpMuhammadiyah 5, occurs at 07:30-08:30 a.m., maximum
traffic
volume is 4303vehicle per hour and dominated
by
motor vehicles(MC).
Thesetwo
schools are separatedby
a signalized intersection, sotraffic
flow from
westtum to
theleft
approaching Jl.
A.
Yani.At
the location close to receiver, existing noise measurement onsDN
Kleco 2 and SMP Muhammadiyah 5 describes the similar trend and the value is above 55 dB(A).
Although both locations have barrier fencewith brick
material and thereare some vegetation plants in school yard but
it
seem that noise from road is veryloud and the barrier have not yet functioned effectively to reduce the noise. From the previous data,
it
can be seen that the noise near thewall
less thanthe measurements on the roadside, but all of them are above noise standard value,
55 dB(A).
Traffic
noise condition at Jl.A. Yani (in front of SMKN 6) is
describedin
Fig.9.It
values steadyat75
dB (A) near roadside and approximately 70-75 dB(A)
for measurements done near the
wall. It
seem that atsLTpN
12 noise level trend [image:16.595.15.582.28.800.2]Fig.9. Noise Level
onx. A.
y@
Fig.
lo.
Noise Level onl.@
3,0
Ei
i
T60
,5
3 50 -i*
o:
A
Time40
*Existing
noise lwel (nearwall)ryhedicted
noise lev el (nearwall)***Existingnoise level (nea.road) *s**Predicted noise level (nearroad)
**Noise
standnrd80
pi 70 Too l-l
950
'E
E
-40
iffsEiFrsss
qooMri-ri
hohohoho,^^
::ql:t9:.m;jii+6
P*qoooN6io;.i
EiffSE
qqqqq
EFSSE
58583
*Existing
noise level (near wall) ..',*.Predictednoise level (nearwall)'-**
Existingnoise level (nearroad)*swhedicted noise level (nearroad;
[image:17.595.18.579.21.790.2]Noise condition
that is
being obtained at primary al-Islam andMA
IslamJamsaren shows the similar trends
with
other locations, either near road side andnear receiver more than 55
dB (A) (Fig.
ll
andFig.l2).
The condition atMA
Islam, which has a distance
of
29.5 meters from the highway, the noise value isbetter than those
that
occuredat
sD
Al
Islam,which
havea
distanceof
21.5meters
from
the highway.while
the resultsof
measurements on the sideof
theroad show similar values between the
two
locations, because thesetwo
locationsare not separated by the intersection.
80
d' ;1n
Beo 0
n
0 h {n .o
z
40
.r-
Existing noise level (near wall)*t
-Predictednoise level (nearwall)-rdr
Existing noise level (near road).-****hediciednoise lev el (neamoad)
*'*Noiqe
qt:ndard [image:18.595.4.580.25.795.2]80
<70
E60
F:FpF=sssFEqE:f
333833=9=:::nn:
EsssFiffsc=ss8s3
88588388=esnrrd
t Existing noise level (nmwall)
'..**Predictednoise level (nerwall) ".":t*Existing noise level (nearrcad)
[image:19.595.17.576.30.785.2]*fi*Predicted noise lev el (nearroad)
Fig.L2.Noise
Leve
ry1a1G.
Predicted noise levelNoise
calculation basedon
empirical
equation (pd-T-10-2004-B model) illustrates that noise levelin
near road and nearwall
are above 55dB (A).
Theresult
of
empirical equationis
basedon
some environmentalfactor
andtraffic
condition
which
described the conditionof
location that noiselevel
triedto
be predicted. Predicting noiselevel is a
simpleway
knowing noiselevel
if
direct measurementnot
possibleto
conduct,or
if
datatraffic
and
environment areavailable.
In all location, there is a deviation between direct measurement and empirical
equation. Noise mean bias at Jl.
A. yani
is about0,gl
-2,25
dB(A),
at Jl. slarnetRiyadi is 3'58
-
5,58 dB(A),
and at Jl. veteran is 2,5g-
s,67 dB(A). From Fig. 7-
Fig.
12, there are shownthat
empirical equation produced lower result than existing condition.There are many factors affected
this
condition. There are some importantnotes
to
consider when doing the measurement noise by using the SLM. Firstof
all,
it
is important to checksLM
tool condition before usingit
because this tool isso
sensitiveto
soundso
surveyor mustnot
haveany
conversation during theobservation.
It
must be ensured that the recorded noiseis
noisefrom traffic
asdirected to the sound source
with
the proper height and slope and protected fromdirect sunlight.
All
in all, weather conditions andhumidity
greatly affect the noise recordedby the SLM. Hot
weather conditions can cause the sound recorded ishigher than the real, and low humidify make the sound move more slowly so that
the noise level received by the SLM was lower. Surveyors should add information
in
the form
of
observationabout
the
weatherand
humidity conditions,
if
necessary,
air
temperatureand
air
humidity
as
measuredby
appropriateobservations.
Pd-T-10-2004-B,
which
is
used as
Indonesian standardin
determining predicted noiselevel, still
needsto
be revisited.primarily
it
is
relatedto
somecorrection factors, such as noise correction factor based on road pavement type, vehicle type, and environmental conditions such as air temperature and humidity.
In
almostall
major cities such as surakarta, motorcycles are very dominant.The motorcycle
driver
will
tendto
increase vehicle speed whentraffic
is
not crowded. This resulted in the sound produced by vehicle exhaust becomes higher. Motorcycles are morelikely
to accelerate the speed when the road is not crowdedand this affected sound produced from vehicle exhaust.
H.
Alternative noise mitigation actionNoise mitigation altematives on Jl. slamet Riyadi (both on SDN Kleco 2 and SMP Muhammadiyah 5):
.
Traffic
management: modificationof
speedlimits
and restrictingor
prohi-biting heavy vehicles traffic, especially atsMp
Muhammadiyah 5, becauseit
is
a major routeof
buses and heavy vehicles from East Jawato
Surakarta.However, to apply this, it needs a policy of detailed transportation planning.
o
Vegetationbarrier
can reduce noise.Both
locations havebrick
wall
as abarrier but it
will
be more effective,if
it combines plant and massive barrier.r
For a long term design, tobuild
schoolwall
from glasses materialswill
be needed to reduce noise.Noise mitigation alternatives on Jl.
A. yani
(both onSMKN 5
and SLTpN 12):o
Traffic
management: modificationof
speedlimits
and restrictingor
prohi-biting heavy vehicles traffic.It
would reduce noise levels at nearby receiverssince trucks are louder than cars. However,
this policy
need detailtrans-portation planning and cannot be applied
in
a short periodof
time.As
theroadways are planned and designed
to
support speeds consistentwith
their fi.rnctional classification (e.g., 35-45 mph on an arterial), changing speedsfor
the purpose of noise mitigation is not common
barrier because in both location open space are
still
available.r
For
longterm
design,to build
schoolwall from
combinationof
materials betweenI
/
8to
I
/
4 glass and the rest with the material to reduce massive noise from outside the buildings about26-29 dBwill
be needed.Noise mitigation altematives at Jl. veteran (both on
sD
Al
Islam Jamsaren andMA
Al
Islam Jamsaren):.
Traffic
management:modification
of
speed
limits
and
restricting
orprohibiting
heavy vehiclestraffic.
It
would
reduce noise levelsat
nearby receivers sincetrucks
are louder than cars. However,this policy
needed detail transportation planning and cannotbe
appliedon a
short periodof
time.
.
Noise reduction can be
performed several stages.The
first
stageis
by providing plants that serves as a noisefilter.
The next stage, atsD
Al
IslamJamsaren,
it
needed special classroomwall
planning, precisely those facingthe highway,
with
a combinationll8-ll4
material made of glass and the restwith
massive materialthat
can reduce noiseby
26-29
dB.MA
Al
Islam Jamsarenjust
neededa
decreaseof
12,4
dB
to
achieve comfortable conditions.It
is recommended to change bricks wall with glasses wall.i
1
304
lka Setiyaningsih100 90
3ro
rQ ?o
660 al ." 640 .9 .^ azo
l0
0
I Existing Noise Level (maxl t Pedicted Noise Level (max)
,4 Existing Noise Level (minl r Pr€dict€d Noise Level {min}
s Noise Standard
3 o
Comparison among noise level value in
all
locationIX.
Conclusion
In
general, the valueof
noise intensity obtained, eitherby
meansof
noisemeasuring
and
empirical
equations,
have
exceededthe
standard
levelpermitted,
in
the
amountof
55 dB
(A)
for the
school environment.If
futureresearcher wants
to
do noise measurement,it
should be donedirectly
along thepropagation ofsound between the sound source and receiver, so that
it
can obtainmore precise value.
The use of empirical equation (model Pd-T-10-2004-b) to calculate the value
of
noise at a place could be recommended, butit
should be noted that there is adifference
in
the
results
with
direct
measurements.If
possible other
noise calculation models could be tried to reach a close number to actual value.Three noise mitigation that can be recommended include:
a.
In
SD
andMA
Al-Islam
Jamsaren Surakarta(Jl.
Veteran), alternative treat-mentwith
a given noise barrierwall of
vegetation andto
planwith a
com-bination
of
materials betweenll8-ll4
glass andthe
restwith the
massivematerial to reduce noise from outside the buildings about26-29 dB.
I
ls Updating the Passenger Car Equivalent
Value
305to reduce noise by 20 dB.
c.
In
SDN KlecoII,
treatmentwith
giving the dominant vegetation, andin
SMpMuhammadiyah 5 Surakarta by creating a barrier of vegetation and planning
of
the wall to the election glass material.
X.
Acknowledgment
The author
would like to
express her gratitudeto
Rosma,puji
andEni for
their excellent participation in this study.
XI.
References
Periodicals:
Babisch.
w.
'tloise
and Health", Environmental Health perspectivesvolume
l 13INumberI
IJanuary2005.Bodin. T.,
Albin.
M., Ard6. J. "Road traffic noise and hypertension: results from across-sectional
public
health surveyin
southem Sweden, ErwironmentalHe alth 2009, 8 :3 8 doi : I 0. I 186 I | 47 6-069X-8-3 g,Sept. I 0. 2009. Available:
http ://www. ehj ournal.net/c ontent/ 8 I 1 I 3 8.
Ikron, Djaja.
LM,
wulandari.
R.A,
'?engaruh Kebisingan Lalulintas
Jalan Terhadap Gangguan Kesehatan psikologisAnak
sDN
cipinang
MuaraKecamatan Jatinegara, Kota Jakarta Timur propinsi
DKI
Jakartd,,Makara ,Kesehatan, Volume 11, No. 1, Juni, 2007:32-37.
Books:
w.
Bowlby. (1992). "In-service
Experiencewith
Trffic
Noise Barriers',,Washington, National Academy press.
Technical Reports:
s'v.
Basrur, "Health Effects
of
Noise",
city of
Toronto community
and Neighbourhood Services Torontopublic Health Health promotion
andEnvironment Protection Office. 2000.
Hiscocks, D., Detlor, T., Eberle, M., Hannigan,E., Jang,B., Kainer, S., Noble,
M.,
Pichora-Fuller,K.,
Silverson, R., and Turax,B.
(April,
lg97).
City Noise.Report of the Urban Noise Task Force City of Vancouver.
Jackie,.
w.U.
"Mitigation
Measures againstRoad
rraffic
Noise
in
selectedPlaces," Research
and
Library
ServicesDivision Legislative council
Secretariat,Hongkong, June. 2006.
[online].
Available:
h@://www.Standards:
Highways
Departrnent.(2001)
GuidanceNotes
on
Noise Redrcing
Roadsu{acing.
Available
from:
hup://www.hvd.gov.hkrENG/puBllC/publications/guidance_notes/pdflgn0t lb .pdf
[Accessed I 8 July 2005].
Menteri Negara Lingkungan Hidup, (1996). BakuTingkat Kebisingan, surat Kepu-tusan Menteri Negara Lingkungan Hidup Nomor:
Kep-4g/MENLIrtl996/
2 5 November I 996, Jakarta.
Ministry of
Settlement and Regional Infrastructure.e004).,,prediksi
KebisinganAkibat Lalu Lintas", pd T-10-2004-8, Jakarta.
Ministry
of
Settlement and RegionalInfrasfucture.
(2005).,.Mitigasi
Dampak Kebisingan Akibat Lalu Lintas Jalan',,pd T-16_2005_8, Jakarta.Public
work
Departement.(r999).'?edoman
perencanaanTeknik
BangunanPeredam
Bising",
No.
036/TiBwrggg
Lampiran
No.
14
KeputusanDirektur Jenderal Bina Marga No.
076lKprslDbllggg,20
December 1999, Jakarta.XII.
Biographies
Ika
Setiyaningsih was born
in
Surakarta, Indonesia, onSeptember
29,
1975. She graduated from Universitas Muham_madiyah Surakarta, and reach Master Degree in Transportation
Engineering
from Institut
Teknologi Bandung.Her
employ_ ment experience included the MuhammadiyahUniversity
if