DOI: 10.12928/TELKOMNIKA.v13i3.1772 1006
Adaptive Background Extraction for Video Based
Traffic Counter Application Using Gaussian Mixture
Models Algorithm
Raymond Sutjiadi*1, Endang Setyati2, Resmana Lim3 1
Department of Computer Engineering, Institut Informatika Indonesia,
Jl. Pattimura No. 3, Surabaya 60189, East Java, Indonesia, Ph./Fax: +6231-7346375/7349324
2
Department of Information Technology, Sekolah Tinggi Teknik Surabaya,
Jl. Ngagel Jaya Tengah 73-77, Surabaya 60284, East Java, Indonesia, Ph./Fax: +6231-5027920/5041509
3
Department of Electrical Engineering, Petra Christian University,
Jl. Siwalankerto 121-131, Surabaya 60236, East Java, Indonesia, Ph./Fax: +6231-2983442/8492562
*Corresponding author, e-mail: [email protected], [email protected], [email protected]
Abstract
The big cities in the world always face the traffic jam. This problem is caused by the increasing number of vehicle from time to time and the increase of vehicle is not anticipated with the development of adequate new road section. One important aspect in the traffic management concept is the need of traffic density data of every road section. Therefore, the purpose of this paper is to analyze the possibility of optimization on the use of video file recorded from CCTV camera for visual observation and tool for counting traffic density. The used method in this paper is adaptive background extraction with Gaussian Mixture Models algorithm. It is expected to be the alternative solution to get traffic density data with a quite adequate accuracy as one of aspects for decision making process in the traffic engineering.
Keywords: traffic management system, traffic density counter, adaptive background extraction, gaussian
mixture models
Copyright © 2015 Universitas Ahmad Dahlan. All rights reserved.
1. Introduction
The big cities in the world always face the traffic jam at highway. This problem is caused by the increasing number of vehicle from time to time and the increase of vehicle is not anticipated with the development of adequate new road section. In order to solve the problem, proper traffic management concept is needed to prevent and solve traffic jam problem. There are many developments in the traffic management concept, such as the policy of Transportation Agencies of Surabaya, East Java, Indonesia. Transportation Agencies of Surabaya has implemented the installation of countdown timer on some traffic lights and the installation of Closed Circuit Television (CCTV) at some crossroads that are connected to Surabaya Intelligent Traffic System (SITS) [1].
Another important aspect is the need of traffic density data on every road section. The data are needed for better management on some road sections, such as to manage the duration of traffic light and the appointment of police officers to manage the traffic, especially at rush hours [2].
The data is currently obtained with manual method by appointing the officers directly to the road section with low data accuracy. Moreover, it can be done with electronic devices, such as the sensor with higher data accuracy. This sensor can be the electrical sensor (e.g. by using speed gun sensor), mechanical sensor that planted in the asphalt, or combination of the use of electrical and mechanical sensors. The usage of sensor model was tested by Public Works Agency on Soekarno-Hatta Street, Bandung, West Java, Indonesia and it was named PLATO (Penghitung Lalu Lintas Otomatis/Automatic Traffic Counter) [3].
process will not be accurate. Moreover, not all roads can be applied with that method considering the limitation of width of a road section.
In this paper, the possibility on the usage of CCTV camera will be analyzed for the counter of traffic density. Thus, it can be optimized for manual visual observation by the officers and the automatic statistical data on traffic density. This data can be one of factors to make decision for managing the duration of traffic light or other types of traffic management. Besides, this method will solve problems on some counting method on traffic density like what was explained before, so the achieved data is expected to be more accurate.
The system used adaptive background extraction with Gaussian Mixture Models. This method is the answer to minimize error that caused by changing of background condition in certain time, like gradual illumination changes, addition of shadow object, and other stop moving object [5]. Gaussian Mixture Models is a further development from Running Gaussian Average method that proposed by Wren et. al. [6]. This algorithm has capability to count the average value of pixels and process it as Gaussian models in real time updating from each video frames without consuming more computer resources.
2. Background Extraction
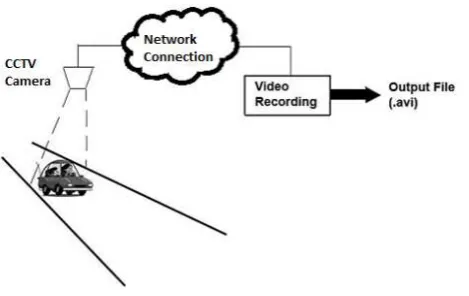
The background extraction is a method to separate or detect the object (as the foreground) and background of input frame of a video [7]. Like what is shown on Figure 1, the video is recorded from CCTV camera installed at certain road section and it is sent to controlling room by using network connection. The video is recorded into AVI file format.
Figure 1. Video Recording Technique
In this case, the term foreground is the object of observation. The background is another object that does not belong to the object of observation. In another word, The background is the static object that does not change frequently and foreground is dynamic object that moves from one point to another in certain sequential frames [8].
The purpose of background extraction process is to detect the existence of foreground object that becomes the target of detection. In this research, the foreground objects are vehicles that move on certain road section and background objects are another objects that belong to road situation, like asphalt, trees, traffic signs, parked cars, and other static objects.
After the foreground object is obtained, the object can be processed based on the application, such as the counting on detected objects, the measurement of object width, and classification of vehicle.
3. Gaussian Mixture Models
With this algorithm, every pixel in a image frame is modelled into K of Gaussian distribution. In this case, K is the number of used Gaussian distribution model from 3 to 5. Every Gaussian model represents the different pixel colour. The scalar value is used on grayscale image, while RGB image uses vector value.
The choosing on number of used model depends on the consideration of image resolution, the performance of computer system, and complexity of model background. More number of model on every pixel can cause more adaptive background extraction process since more colour components can be modelled into every pixel. However, it must be compensated with system resource that will be used, especially when image resolution is big enough.
In other words, this algorithm will model every appearing colour on every pixel at one time t {X1, ..., Xt} on a image frame that is modelled into Gaussian distribution K by using the same initialization parameter. Probability from pixel value based on the previous colours can be formulated as follows [9]:
P X ∑ w, ∗ η X ,μ,,Σ, (1)
Where,
P(Xt) = Probability of colour value at time t.
K = Number of Gaussian distribution on every pixel.
w, = Estimation on weight from i-th Gaussian distribution at time t. µ, = Mean value from i-th Gaussian distribution at time t.
∑, = Covariance matrix from i-th Gaussian at time t.
Ƞ = Function of Gaussian probability density.
With the formula of function of Gaussian probability density as follows [8]:
η X ,μ,Σ π / |Σ| / e μ Σ μ (2)
And the covariance matrix is assumed in forms of [9]:
Σ , σ I (3)
For the next image frame, every pixel is combined with every K of of Gaussian distribution model on the same corresponding pixel, starting from the distribution model with the largest to the smallest probability. A pixel is determined to be suitable with one of Gaussian distribution models when it belongs to the range 2.5 of deviation standard. On the other hand, when a pixel has the value instead of 2.5 of deviation standard, it is stated to be unsuitable with that Gaussian distribution model [9, 10].
μk− 2.5 *σk < Xt< μk + 2.5 *σk (4)
Where, Xt = Pixel colour vector (RGB) at time t.
μk = Vector of mean value of pixel (RGB) from k-th Gaussian.
σk = Value of deviation standard from k-th Gaussian.
If a pixel is suitable with one of Gaussian distribution models, the parameter of Gaussian model will be updated. To update the weight value, the following formula is used [9]:
ωk,t = (1 - α) ωk,t-1 + α (Mk,t) (5)
Where,
ωk,t = Weight from k-th Gaussian at time t.
α = Learning rate.
After updating the weight value, do the normalization to make the total weight from K of Gaussian distribution model = 1.
To update the mean value, the following formula is used [9]:
μt = (1 – ρ) μt-1 + ρXt (6)
Where ρ = αȠ (Xt | μk, σk)
The value of deviation standard needs periodic update when there is pixel value that is suitable with distribution. The following formula is used for the update [9]:
σt 2
= (1 - ρ) σ2t-1 + ρ (Xt – μt) T
(Xt – μt) (7)
If a pixel is not suitable with all Gaussian distribution models on corresponding pixel, the Gaussian model with the smallest probability will be removed and replaced with Gaussian model for the new pixel colour. The new Gaussian model will be initialized with mean value based on the vector value, high variant value, and low weight value.
The next step is to determine the pixel in the background and foreground objects and the selection is done. At the beginning, the selection is done by sorting the existing model based on the value of ω/σ2 (fitness value) where the most optimal distribution as the background is still placed on the top priority, while the distribution that does not reflect the background is placed on the lowest priority. Some highest values from those distribution models are selected until the weight value fulfils the threshold value that is determined before. The selected distribution model is then determined as the candidate of background. The following formula is used to choose B of background distribution [9]:
B arg ∑ ω (8)
Where T is the smallest proportion from the data and it should be counted as the background. When the pixel colour belongs to the category of one candidate of background model, the pixel will be considered as the background (pixel gets value 0/ black colour). Moreover, the pixel that does not belong to the category of background model will be considered as the foreground (pixel gets value 1/white).
The result in form of binary image will be processed furthermore. The advanced process is the forming of boxes of detection, counting, and object classification.
4. System Architecture
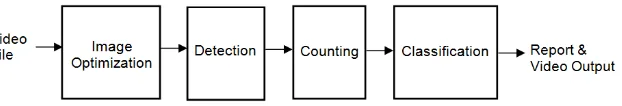
The system consists of sub-processes as explained in Figure 2.
Figure 2. System Block Diagram
a) Input system is in form of video file from the CCTV recording with certain duration and in a format of Audio Video Interleave (AVI).
b) In the image optimization block, the video file will be extracted into its composing frames, where each frame will be processed, as such that the resulting image will be optimized for the next process.
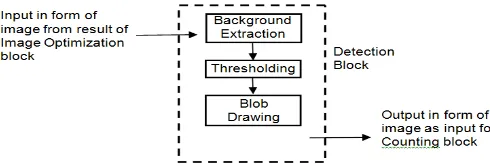
Figure 3. Detail of Detection Block Diagram
(1) Background extraction is a method for separating between background and foreground objects using Gaussian Mixture Models (GMM) algorithm.
(2) Thresholding is a method for changing the image into binary image. Object (a set of pixel) detected as background will be given binary code as 0 (black colour), while the object (a set of pixel) detected as foreground will be given binary code as 1 (white colour).
(3) Blob drawing is a step for drawing of boxes circling the foreground objects that represent the presence of detected objects.
d) In the counting block, the detected foreground objects, which are represented as blob, will be counted.
e) In the classification block, each blob will be classified to obtain the data on the number of vehicles based on group. This classification process is based on the dimension (width and length) of the vehicles.
f) Output from the system are:
(1) Statistic data of total number of vehicles.
(2) Statistic data of total number of vehicles based on group. (3) Data of traffic density per minute.
(4) Detail data of total number of vehicles based on group in certain interval time. (5) Video display which is already mapped with blob, so user can monitor the accuracy
of system.
(6) Export report data into text and CSV file format.
5. System Design and Features
This system was developed using OpenCV software. OpenCV is a C language library which provides several features for computer vision and digital image processing applications [11].
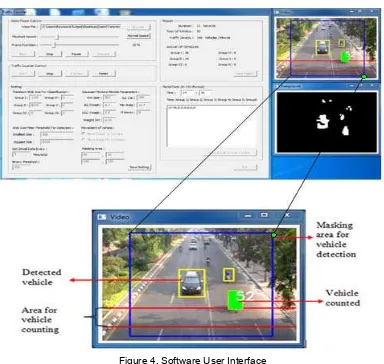
Here are the features available in this application (Figure 4): (1) Video player: for playing AVI video file.
(2) Traffic density counter: for controlling traffic density function.
(3) System setting: for setting the parameters value which are required for running the system. (4) Summary report: for displaying the summary report.
(5) Detail report: for displaying the report in such interval time. (6) Video display.
6. Experimental Result
Experiment for this research is done by using a simulation and sample video. Simulation video is used to simulate an ideal road condition, which is suitable with the needs of software, i.e. object of vehicles recorded perpendicularly from above, video minimized from other objects that may interfere detection, and there is no other noise.
Figure 4. Software User Interface
The reading of software using simulation video is stated as follows, and the result is as Table 1.
The real number of vehicle = 274 vehicles Total vehicle counted by system = 298 vehicles Difference = 298 – 274 = +24 vehicles
The percentage of reading error = (24 / 274) * 100 % = + 8,76 %
Tabel 1. Testing Result Using Simulation Video
Perangkat Lunak
Manual % Error
Group 1 0 0 0
Group 2 14 13 +7,69
Group 3 39 49 -20,41
Group 4 75 81 -7,41
Group 5 69 61 +13,11
Group 6 101 70 +44,29
To count the number of vehicle based on group using simulation video is done by determining the threshold value of dimension of each vehicle group. Group 1 is the smallest dimension of vehicle and group 6 is the biggest.
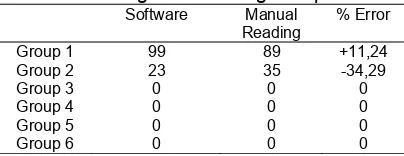
Total vehicle counted by system = 122 vehicles Difference = 124 - 122 = + 2 vehicles.
The percentage of reading error = (2 / 124) * 100 % = +1.61%
Table 2. Testing Result Using Sample Video
Software Manual
The reading on number of vehicle based on its group is determined as follows: group 1 is the small vehicle/common passenger and group 2 is big vehicle/bus/truck. The group of big vehicle can be categorized into more specific groups. However, it is not possible since the condition of the recording of sample video is not in ideal condition.
7. Conclusion
The algorithm of Gaussian Mixture Models is quite reliable to use as one of background extraction methods with several conditions of videos. This algorithm is able to adapt to the existing changes, so the accuracy in detecting foreground object is maintained.
The average results of counting on total vehicle have a quite high accuracy, above 80 percent. The result is various on every condition of video. When the road becomes more crowded, the accuracy is also reduced.
The average result of counting on vehicle based on its group has a relatively low accuracy with various results on the condition of video and different vehicle groups. The condition during the recording of sample video that is not ideal by forming certain elevation angle also causes the error in classification of vehicle group. Due to many vehicles with overlapping look in video frame. The majority of largest percentage of error happens on the smallest and the biggest vehicle groups. The error in the smallest vehicle group (motorcycle) is caused by it position that is near each other, so the system reads many motorcycles as one unit of vehicle with big dimension. Thus, that condition causes the error in classifying the vehicle. Meanwhile, the error in group of biggest vehicle is caused by the taking technique of sample video that is too near with the surface of the road, so the big vehicle is not fully captured in one frame. The taking of sample video that is too near with the road surface also causes the reflection of sunlight on the body surface and the windshield glass of vehicle that is captured by camera that makes the system often adapt its Gaussian pixel value extremely. These two conditions make the big objects unreadable and uncountable.
Although the existence of shadow is minimized by system, the extreme existence of shadow can be one of main factors to cause the error in reading. The existence of shadow makes two vehicles with near position read as one unit of object since it makes two blobs of vehicle connected to each other.
This system is more suitable to use on road section that is passed by motor vehicle with 4 wheels or more (toll road) and avoid the condition of during severe traffic jam (when the vehicle cannot move at all).
The system accuracy is really determined by the condition of video recording, the condition of road section, and the choosing of suitable input parameters value for the algorithm process.
References
[1] Dinas Perhubungan Kota Surabaya. Surabaya Intelligent Transport System (SITS). 2015.
[2] Hongjin Zhu, Honghui Fan, Shuqiang Guo. Moving Vehicle Detection and Tracking in Traffic Images
based on Horizontal Edges. TELKOMNIKA Indonesian Journal of Electrical Engineering. 2013;
[3] Badan Penelitian dan Pengembangan Kementrian Pekerjaan Umum. PLATO: Penghitung Lalu Lintas Otomatis. Kementerian Pekerjaan Umum. 2010.
[4] Lim R, Thiang, Rizal. Pengukuran Kepadatan Arus Lalu Lintas Menggunakan Sensor Kamera.
Seminar Nasional Industrial Electronics 2003 (IES 2003). 2003.
[5] Shisong Zhu, Min Gu, Jing Liu. Moving Vehicle Detection and Tracking Algorithm in Traffic Video.
Telkomnika. 2013; 11(6); 3053-3059.
[6] C Wren, A Azarbayejani, T Darrell, AP Pentland. Pfinder: real time tracking of the humand body. IEEE
Transaction on Pattern Analysis and Machine Intelligence. 1997; 19(7): 780-785.
[7] Aiyan Lu, Luo Zhong, Lin Li, Qingbo Wang. Moving Vehicle Recognition and Feature Extraction from
Tunnel Monitoring Videos. Telkomnika. 2013; 11(10); 6060-6067
[8] Rostianingsih S, Adipranata R, Wibisono FS. Adaptive Background dengan Metode Gaussian Mixture
Models Untuk Real-Time Tracking. Jurnal Teknik Informatika. 2008; 9(1); 68-77.
[9] Stauffer C, Grimson WEL. Adaptive Background Mixture Models for Real-Time Tracking. Massachusetts Institute of Technology. 1999.
[10] Kaew Tra Kul Pong P, Bowden R. An Improved Adaptive Background Mixture Model for Real-Time
Tracking with Shadow Detection. Proc.2nd European Workshop on Advanced Video Based Surveillance Systems. 2001.
[11] Kaehler A, Bradski G. Learning OpenCV: Computer Vision with the OpenCV Library. 2nd edition.