DOI: 10.12928/TELKOMNIKA.v12i4.660 963
Low Energy Adaptive Clustering Hierarchy Routing
Protocol for Wireless Sensor Network
V. Windha Mahyastuty*1, A. Adya Pramudita2
Department of Electrical Engineering, Faculty of Engineering, Atma Jaya Catholic University Jl. Jend Sudirman Kav. 51, Jakarta, 12930, Ph. 021-5708826
*Corresponding author, e-mail: [email protected], [email protected]
Abstract
A Wireless Sensor Network (WSN) is a network composed of many sensor nodes distributed in a region, and is used to monitor and gather information about certain phenomena in the physical environment. A sensor node typically has limited power, which must be taken into consideration in designing the routing protocol of a WSN. One of the routing protocols that can increase the energy efficiency of WSN is Low Energy Adaptive Clustering Hierarchy (LEACH). In this research, the performance of LEACH, namely energy consumption and lifetime is evaluated using NS-2. Simulation results show that the number of nodes and clusters affect the optimum number of clusters and the device lifetime, which in turn will affect the energy consumption level as well as the energy efficiency.
Keywords: wireless sensor network, routing, energy, clustering, the optimum number of clusters
1. Introduction
Wireless Sensor Network (WSN) is widely used to observe and control certain environments, for various purposes such as emergency services, security and weather monitoring [1]. WSN includes single or multiple sensing elements, a data processor, communicating components and a power source with limited energy capacity [2],[3]. The sensing element, such as a sensor node, performs measurements related to its surrounding environment. The measurement data are processed in a processing unit and subsequently forwarded over a wireless channel to a base station, where they can be accessed by a user [3].
One constraint of the use of WSN is the limited power of each sensor node, so energy consumption efficiency becomes an important issue in WSN. Routing is a function in WSN, which consumes a substantial amount of energy. Researches on network layer WSN systems aim to achieve an efficient route setup in terms of power, as well as allowing consistent data communication from sensor nodes to the base station [1]-[4]. Routing protocols developed for data communications network with the aim of achieving high Quality of Service (QoS) is generally not appropriate for WSN [3] due to the limitations of power source, storage capacity and data processing in the sensor nodes. Without specific routing protocols, with low energy consumption, the lifetime and WSN connectivity will be degraded.
In LEACH, several nodes will be selected as a cluster head (CH). The number of CH nodes is proportional to the number of clusters. The node, which is selected as a CH node, will consume more energy than non-CH nodes [5-10]. Nodes that run out of energy will cease operating and the number of nodes in the system will be reduced. The purpose of this study is to evaluate the energy consumption of LEACH routing protocol for WSN systems and to find the optimum number of clusters. In order to obtain the minimum energy consumption, an evaluation was performed to identify the influence of the number of nodes on the optimum number of clusters. The simulation is performed using Network Simulator 2 (NS-2).
2. Research Method
a. Set Up Phase
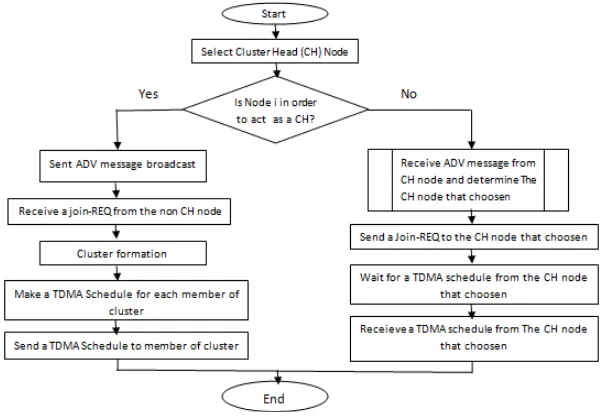
In the setup phase, the process of determining the cluster head (CH) and cluster formation, or often called clustering algorithm, is carried out. In this phase, LEACH selects several sensor nodes in order to act as a CH. Once the CH is formed, the CH node must broadcast an advertisement (ADV) Multiple Access/Collision Avoidance (CSMA/CA). This message contains the ID Node and Header. When the non-CH nodes receive the ADV message, they will send a joint request (JOIN-REQ) message that contains ID Node and ID Header to the CH node that they choose based on the strongest received signal in order to join and form a cluster [5]. When the CH nodes receive a JOIN-REQ message, they will make a TDMA schedule for each member of their cluster. The processes carried out in the set up phase are shown in Figure 1.
Figure 1. The Set Up Phases
The nodes that act as a CH will expend more energy than non-CH nodes. This is because the CH nodesreceive data from all other nodes in the cluster, compress the data, and send the data to the Base Station located farther than the distance between one non-CH node to another [5]. Therefore, in order to keep the energy consumed by each node equitable, each node that acts as a CH will be substituted by other non-CH node at the next round (r+1). Every node has a chance to be a CH. Each node number i thatcontends to be a CH will choose a random number between 0 and 1. If the random number is less than the threshold (Pi) and the number of clusters that have been formed is smaller than the desired number of clusters, then the node number i will be elected as CH. The threshold value can be calculated using (1) [5].
/ ∶
∶ (1)
where k is the number of CH, N is the number of sensor nodes in the network and r is the number of rounds that have been completed. Ci is a function that indicates whether or not the node number iis a CH in the most recent round. If node iis a CH in the most recent round the value of Ci is 0 and Ci is 1if node i is eligible to become a CH. The threshold value for the node that acts as a CH will be set to 0 in the next round. A node that acts as a CH will be re-elected as a CH after N/k rounds because the energy of every node is expected to be the same after N/k rounds. Equation (1) is used if the existing nodes in the network have the same energy. If the energy of each node is different, then the threshold can be determined using (2) [5].
Where Ei is the current energy of node i in Joules,Etotal is the total energy of all nodes in the network in Joules and k is the number of clusters. Thus, the nodes that have more energy will be chosen as a CH more often.
b. Steady State Phase
In the steady state phase, the CH nodes receive all data from each member of the cluster, compress the data and forward the data to the Base Station (BS). The non-CH nodes will send the data to CH nodes according to a TDMA schedule. The steady state phase is shown in Figure 2.
Figure 2. The Steady State Phase
The power used to transmit the message is affected by the distance between the transmitter and receiver. If the distance between the transmitter and receiver is smaller than a crossover distance, the free space propagation model is used in the simulation. Otherwise, if the distance between transmitter and receiver is greater than the crossover distance, the two ray ground propagation model is used in the simulation. Crossover distance can be calculated using (3) [6]:
(3)
where hrand htare the height of the receiver and transmitter antenna in metres, is the wavelength of the carrier signal transmitted from transmitter to receiver in metres and L is the system loss factor. Power used to transmit information/message can be calculated using (4) [7]:
_ . . ,
_ _ . . , (4)
where Pt is the power used for transmission in Watts, d is the distance between the transmitter with the receiver in meters, _ is the energy amplifier in J/bit/m2. _ _ is two ray energy amplifier in J/bit/m4, and BW is bandwidth in bps. The total power used to transmit information can be calculated using (5) with radio electronics energy is in J/bit [7].
. (5)
Thus, the required transmit energy can be calculated using equation (6)
.
where is in Joules, and l is the size of the sent message in bits. The power used to receive a message can be determined using (7)
(7)
Where Pr is the power that is used to receive information in Watts. The energy required to receive such information can be calculated using (8):
.
(8)
Where Er is energy that is used to receive information in Joules.
The simulation is performed using Network Simulator 2 (NS-2) version 2.34 based on Ubuntu. Based on this fact, the optimum number of clusters can be determined. In order to investigate the effect of the number of nodes on the optimum number of clusters, a simulation with a varying number of nodes has been used. The lifetime of the network is also observed in the simulation. The number of nodes variation used is 80, 100 and 120 and the cluster number used is 2, 3, 4, 5, 6, 7 and 8. For the simulation, the nodes are positioned randomly in the network. The energy consumption observed in this simulation is the total energy used by each node in the network to send and receive data. In the simulation, the total energy used by each sensor node was observed every 10 seconds. The simulation parameters are shown in Table 1.
Table 1. Simulation Parameters
Parameter Value
Simulation area 1000 m x 1000m
Simulation time 1000 s
BS position (80,200)
Initial Energy of each node 2 Joule
Efriss-amp 10 pJ/bit/m2
Εtwo-ray-amp 0.0013 pJ/bit/m4
Eelec 50 nJ/bit
3. Results and Analysis
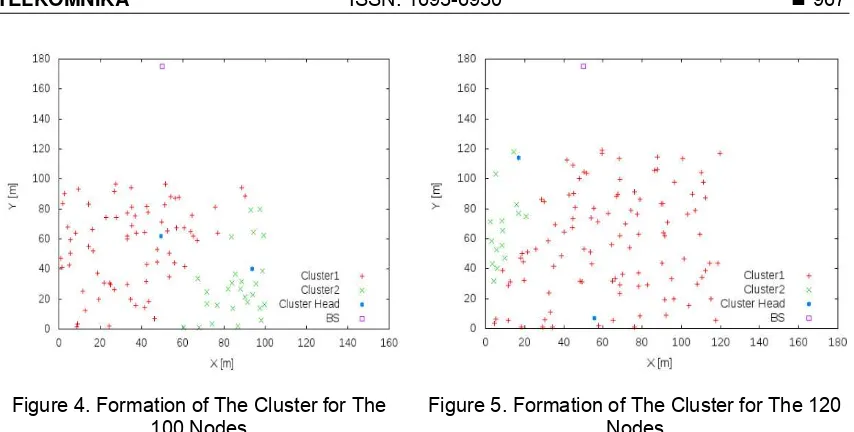
The parameters given in Section 2 are used to simulate the LEACH routing protocol in a Wireless Sensor Network by using Network Simulator 2 (NS-2). In this simulation, the number of nodes were varied between 80, 100 and 120 nodes, and the number of clusters used are 2, 3, 4, 5, 6, 7 and 8. The simulation result for 100 nodes was taken from [9].
The simulation result for 80, 100 and 120 nodes grouped into 2 clusters is given in Figures 3-5.
Figure 4. Formation of The Cluster for The 100 Nodes
Figure 5. Formation of The Cluster for The 120 Nodes
The CH substitution was performed in each round and the number of CH nodes for each round was fixed. In the simulation, one round lasted for 20 seconds.
The result for performance simulation of LEACH routing protocol in the WSN can be seen in Table 2.
Table 2. Energy Consumption for Number of Nodes
Number of Clusters
Energy Consumption for Number of Nodes [Joule]
80 100 120
2 159.81546089028500 199.596713720156 239.69561619855745
3 159.39257323360695 199.775075459310 239.58865358319812
4 158.62683768864082 198.871335214492 239.11712243552884
5 159.15305422827956 197.855650584318 238.90431978939637
6 159.244315259319 198.341705828169 237.52240734469208
7 159.0914748142867 198.197959434680 238.54813190206781
8 158.75934225293005 198.196994774045 237.6764115326155
Table 2 shows that the optimum number of clusters is 5 when the number of sensor nodes used is 100.This result agrees with [6] with the exception that in [6] only 100 nodes were used in the simulation, therefore the impact of the number of nodes on the optimal number of clusters cannot be identified.
It is also shown that the energy consumption is directly proportional to the number of nodes. This is due to the fact that as the number of nodes increases, the more data will be sent to the base station, requiring an increased amount of energy. From Table 2, it is also observed that the number of nodes will affect the optimum number of clusters. The optimum number of clusters when there are 80 nodes in the network is 4, while for a network with 100 and 150 nodes the optimum number of clusters is 5 and 6, respectively. So the optimum number of clusters is 5 percent of the number of sensor nodes used in the simulation.
Table 3. Lifetime for Number of Nodes
Number of Clusters
Lifetime for Number of Nodes [s]
Table 3 shows the relationship between the number of nodes used and the lifetime of a WSN. When the numbers of nodes are 80, 100 and 120, a long lifetime is obtainable when the numbers of clusters are 4, 5 and 6, respectively.Based on the results in Table 2, it is seen that 4, 5 and 6 is the optimum number of clusters for the 80, 100 and 120 nodes. Based on the results shown in Tables 2 and 3, it is observed that when the number of cluster is optimal, the network will have a long lifetime with low energy consumption, making it energy-efficient.
4. Conclusion
Simulation results show that the adaptive clustering hierarchy algorithm that is applied for routing protocols in WSN systems can minimize energy consumption. Without clustering the data transmission process consumes a lot of energy because each node must be able to reach the Base Station. To achieve the minimum energy consumption levels in the implementation of Adaptive Clustering Hierarchy Routing Protocol it is necessary to determine the optimum number of clusters. The number of nodes can affect the optimum number of clusters and lifetime. The simulation results also show that the energy consumption is directly proportional to the number of nodes.
References
[1] Howard SL, Schlegel C, Iniewski K. Error Control Coding in Low-Power Wireless Sensor Networks:
When Is ECC Energy-Efficient. EURASIP Journal on Wireless Communications and Networking.
2006; 2006: 1-14.
[2] Manikandan K. and Purusothaman T. An Efficient Routing Protocol Design for Distributed Wireless Sensor Networks. International Journal of Computer Applications. 2010; 10( 4): 5-10.
[3] Kandris D, Tsioumas P, Tzes A, Nikolakopoulas G, Vergados, Dimitrios D. Power Conservation
through Energy Efficient Routing in Wireless Sensor Networks. Sensors. 2009; 9: 7320-7342.
[4] Majid I K, Wilfried N, Gansterer, Haring G. Congestion Avoidance and Energy Efficient Routing
Protocol for Wireless Sensor Networks with a Mobile Sink. Journal of Networks. 2007; 2(6): 42-49.
[5] Heinzelman, W. B., Chandrakasan, A. P. and Balakrishnan, H. An Application-Specific Protocol
Architecture for Wireless Microsensor Networks. IEEE Transactions on Wireless Communications.
2002; 1(4): 660-670.
[6] Patel R., Pariyani S, Ukani V. Energy and Throughput Analysis of Hierarchical Routing Protocol
(LEACH) for Wireless Sensor Network. International Journal of Computer Applications. 2011; 20(4):
32-36.
[7] Heinzelman WB. Application-Specific Protocol Architectures for Wireless Networks. Doctor Tesis.
Cambridge: Faculty of ElectricalEngineering and Computer Science Massachusetts Institute of Technology. 2000.
[8] Kotta HZ, Rantelobo K, Tena S, Klau G. Wireless Sensor Network for Landslide Monitoring in Nusa
Tenggara Timur. TELKOMNIKA Telecommunication Computing Electronics and Control. 2011; 9(1):
9-18.
[9] Mahyastuty V.W, Pramudita A.A. Energy Consumption Evaluation of Low Energy Adaptive Clustering
Hierarchy Routing Protocol for Wireless Sensor Network. IEEE COMNETSAT. Yogyakarta. 2013:
6-9.
[10] Wang W, Peng Y. LEACH Algorithm Based on Load Balancing. TELKOMNIKA Indonesian Journal of