AN ANALYSIS OF LITTLE TUNA RESOURCES
MANAGEMENT OPTIONS IN THE EAST COAST
OF MINAHASA, NORTH SULAWESI PROVINCE
KUSDIANTORO
POST GRADUATE SCHOOL
BOGOR AGRICULTURAL UNIVERSITY
BOGOR
i
STATEMENT ON THESIS AND SOURCE OF INFORMATION
I herewith declare that this thesis entitled of An Analysis of Little Tuna
Resources Management Options in the East Coast of Minahasa, North Sulawesi
Province is my own work and has not been published in any form and for another
degree. Source of information which is collected or cited from published or unpublished works has acknowledged in this text and put it in the list of references at the end of thesis.
Bogor, September 2006
ii
ABSTRACT
KUSDIANTORO. An Analysis of Little Tuna Resources Management Options in the East Coast of Minahasa, North Sulawesi Province. Under the supervision of KIAGUS ABDUL AZIZ, LUKY ADRIANTO, and RAHMAT KURNIA
Presently, the utilization of little tuna resource in the Minahasa coastal waters is not well managed by the local fisheries authority. In the other word, the local government has not sufficient capacity to protect their local fish resources. The management regime used by the local government is quasi open access regime which no control on fisheries capacity in terms of input and output. In this regards, this study can contribute in giving alternative scenario to manage little tuna resources in study area.
Using Gordon-Schaefer model, it has been revealed that the Maximum Sustainable Yield (MSY) is estimated at the level of 744.27 ton, while Maximum Economic Yield (MEY) 267.73 tons, Optimum Sustainable Yield (OSY) 275.90 tons and Open Access Yield (OAY) 476.02 tons respectively. In terms of effort, theses level would be 9,453 trips; 1,889 trips; 1,954 trips; and 3,778 trips.
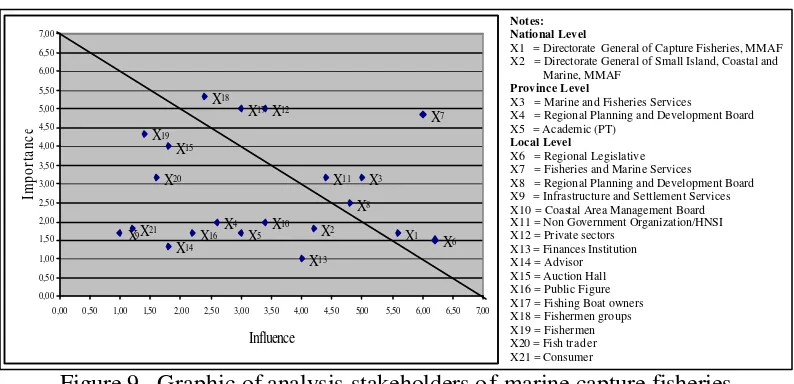
From the stekholders analysis, it can be also obtaiend that directorate general of capture fisheries (national level), marine and fisheries service (regional level), regional legislative, fisheries and marine service, regional planning and development board, non goverment organization, private sectors, fishing boat owner and fishermen group (local level) are the most strategic stakeholders. Based on this identification, therefere, trade-off analysis on management scenarios has been undertaken.
iii
ABSTRAK
KUSDIANTORO. Analisis Opsi Pengelolaan Sumberdaya Ikan Tongkol di Pesisir Timur Minahasa, Propinsi Sulawesi Utara. Dibimbing oleh KIAGUS ABDUL AZIZ, LUKY ADRIANTO, dan RAHMAT KURNIA
Selama ini pemanfaatan sumberdaya ikan tongkol di Minahasa tidak secara baik dikelola oleh pemerintah setempat. Dengan kata lain, pemerintah setempat tidak memiliki kemampuan untuk melindungi sumberdaya ikannya. Selama periode 1986-2004, pemanfaatan sumberdaya ikan tongkol di Minahasa dilakukan melalui pendekatan akses terbuka. Oleh karena itu, kajian ini diharapkan dapat memberikan alternatif pengelolaan ikan tongkol yang lebih memperhatikan prinsip-prinsip keberlanjutan.
Berdasarkan hasil perhitungan menggunakan pendekatan Gordon-Schaefer, titik acuan kunci untuk hasil tangkapan maksimum berkelanjutan, hasil tangkapan maksimum secara ekonomi, hasil tangkapan optimal berkelanjutan dan akses terbuka secara berturut-turut adalah 744,27 ton; 267,73 ton; 275,90 ton dan 476,02 ton, sedangkan tingkat upayanya adalah sebagai berikut 9.453 trip; 1.889 trip; 1.954 trip dan 3.778 trip. Berdasarkan penilaian terhadap pemangku kepentingan, diketahui bahwa pemangku kepentingan yang berada diatas garis linier memiliki posisi yang strategis didalam pengelolaan perikanan tangkap di wilayah ini. Pemangku kepentingan dimaksud antara lain Ditjen Perikanan Tangkap (tingkat nasional), Dinas Perikanan dan Kelautan (tingkat propinsi), Dewan Perwakilan Rakyat Daerah, Dinas Kelautan dan Perikanan, Badan Perencanaan dan Pembangunan Daerah, Lembaga Swadaya Masyarakat, swasta, pemilik kapal dan kelompok nelayan (tingkat lokal). Selanjutnya, berdasarkan analisis trade-off diketahui bahwa skenario terbaik adalah skenario C karena skenario C memiliki nilai total lebih besar dari skenario B dan A.
vi Title : An Analysis of Little Tuna Resources Management
Options in the East Coast of Minahasa, North Sulawesi Province
Name : Kusdiantoro
SRN : C 25 10 40324
Approved by the advisory board,
Ir. Kiagus Abdul Aziz, M.Sc. Supervisor
Dr. Ir. Luky Adrianto, M.Sc. Co-supervisor
Ir. Rahmat Kurnia, M.Si. Co-supervisor
Acknowledged by:
Head of Study Program Dean of Post Graduate School
Prof.Dr.Ir. Rokhmin Dahuri, MS. Dr.Ir. Khairil Anwar Notodiputro, MS.
v
AN ANALYSIS OF LITTLE TUNA RESOURCES
MANAGEMENT OPTIONS IN THE EAST COAST
OF MINAHASA, NORTH SULAWESI PROVINCE
KUSDIANTORO
Thesis
as partial fulfillment for Master Science Degree in Coastal and Marine Resources Management Study Program
POST GRADUATE SCHOOL
BOGOR AGRICULTURAL UNIVERSITY
BOGOR
iv
© Copyright property of Kusdiantoro, 2006 All rights reserved
ix
BIOGRAPHY OF AUTHOR
He finished elementary and junior school in Indramayu District, West Java Province in 1990 and 1993 respectively. After that, he finished high school in Kuningan District of West Java in 1996. In the time, he got the opportunity to pursue his education in Bogor Agriculture University (IPB) by USMI. During 1996 – 2001, he studied on department of Fisheries Resources Utilization, Marine Science and Fisheries Faculty, Bogor Agriculture University.
After graduation from Bogor Agriculture University in 2001, he was approved in Ministry of Marine Affairs and Fisheries, exactly in Public Services and Information Centre (revised become Information and Data Statistic Centre). Beside that, during 2002 – 2006, he got the opportunity to active in the association of Indonesian Fisheries Scholars (ISPIKANI) on department of organization development (vice of chairman).
In July 2004, he passed the exam for Marine and Coastal Resource Management Project (MCRMP) scholarship to pursue he study for Sandwic h Master Degree Program in the coastal and marine resource management. The program was cooperation between Bogor Agricultural University of Indonesia and Århus Universitet of Denmark. During his study in Denmark, he has written scientific writing about Marine Fisheries Management in Tropical Area: Theory and Practice (Minor Thesis).
vii
PREFACE
Hereby I would like to give thankfulness to God who has been giving his blessing to me, so I could be finished my thesis. The study entitled of An Analysis
of Little Tuna Resources Management Options in the East Coast of Minahasa,
North Sulawesi Province has been done in April to June 2006. This thesis is as partial fulfillment for master science degree in Coastal and Marine Resources Management Study Program.
In this moment, I wish to express my earnest thanks and sincere appreciation to parties as follows:
1. Ministry of Marine Affair and Fisheries, and also mana ger of Marine and Coastal Resource Management Project (MCRMP). I am very grateful thanks for financial support by awarding me the scholarship during of my two years Master Degree study which without this support, this degree would not be possible.
2. Dr. Aji Sularso (The Head of Information and Statistic Data Centre, Ministry of Marine Affair and Fisheries/ISDC MMAF) and all of my partners in ISDC. I am very grateful thanks for support and opportunity to pursue study of Master Degree.
3. Ir. Adi Priana H. Pasaribu (Former of the Head of Public Services and Information Centre). I am very grateful thanks for opportunity to pursue study of Master Degree.
4. Ir. Kiagus Abdul Aziz, M.Sc., Dr. Ir. Luky Adrianto, M.Sc. and Ir. Rahmat Kurnia, M.Si., who acted respectively as my supervisor and co-supervisor of advisory board. I am deeply appreciate and respected them for their constant guidance, valuable suggestion; good advice and technical comment during arrange my thesis.
5. Prof.Dr.Ir. Ismudi Muchsin, DEA and Dr.Ir. Mennofatria Boer, DEA who have ready to become examiners and their inputs were very valuable for the improvement of this thesis.
viii University. I am the highest thanks for cooperation and precious knowledge and also understanding about marine and coastal resource management. 7. Prof. JØrgen Bundgaard, Prof. Lars Lund-Hansen, Vibeke Simonsen, Henning
Mogensen, and all of my lecturers in Århus Universitet, Denmark. I am the highest thanks for cooperation and precious knowledge and also understanding about English language problem during my study.
8. The Head of Fisheries and Marine Service and all of fisheries stakeholders in Minahasa, North Minahasa and South Minahasa. Thank you very much for all of their kindness and help during my research.
9. My friends and colleagues, Zaitul, Zaenal, Efrizal, Machmud, Saptoyo, Edo, Coky, Nety, Norma, Yesy and Eirin. Thank you very much for our friendship, our togetherness, help, advice, support and so on, so that we can finish study right on time.
10.My mother, my late father, my father-in-law, my mother-in-law, my brothers (Bambang Suprapto, Heru Rudiyanto, Edi Sukolaksono) and my sister (Dewi Ratnasari). I am very grateful thanks for their support and their prayers any time.
11.My wife and my son. I am deeply appreciate and very grateful thanks for their permission, their full support, their sacrifice, their love, their motivation and their players any time, which made this study possible and led to a successful completion.
12.Many people that I should thank for this task that is not mentioned individually
Moreover, I hope this thesis can give benefits to every one who needs it.
Bogor, September 2006
AN ANALYSIS OF LITTLE TUNA RESOURCES
MANAGEMENT OPTIONS IN THE EAST COAST
OF MINAHASA, NORTH SULAWESI PROVINCE
KUSDIANTORO
POST GRADUATE SCHOOL
BOGOR AGRICULTURAL UNIVERSITY
BOGOR
i
STATEMENT ON THESIS AND SOURCE OF INFORMATION
I herewith declare that this thesis entitled of An Analysis of Little Tuna
Resources Management Options in the East Coast of Minahasa, North Sulawesi
Province is my own work and has not been published in any form and for another
degree. Source of information which is collected or cited from published or unpublished works has acknowledged in this text and put it in the list of references at the end of thesis.
Bogor, September 2006
ii
ABSTRACT
KUSDIANTORO. An Analysis of Little Tuna Resources Management Options in the East Coast of Minahasa, North Sulawesi Province. Under the supervision of KIAGUS ABDUL AZIZ, LUKY ADRIANTO, and RAHMAT KURNIA
Presently, the utilization of little tuna resource in the Minahasa coastal waters is not well managed by the local fisheries authority. In the other word, the local government has not sufficient capacity to protect their local fish resources. The management regime used by the local government is quasi open access regime which no control on fisheries capacity in terms of input and output. In this regards, this study can contribute in giving alternative scenario to manage little tuna resources in study area.
Using Gordon-Schaefer model, it has been revealed that the Maximum Sustainable Yield (MSY) is estimated at the level of 744.27 ton, while Maximum Economic Yield (MEY) 267.73 tons, Optimum Sustainable Yield (OSY) 275.90 tons and Open Access Yield (OAY) 476.02 tons respectively. In terms of effort, theses level would be 9,453 trips; 1,889 trips; 1,954 trips; and 3,778 trips.
From the stekholders analysis, it can be also obtaiend that directorate general of capture fisheries (national level), marine and fisheries service (regional level), regional legislative, fisheries and marine service, regional planning and development board, non goverment organization, private sectors, fishing boat owner and fishermen group (local level) are the most strategic stakeholders. Based on this identification, therefere, trade-off analysis on management scenarios has been undertaken.
iii
ABSTRAK
KUSDIANTORO. Analisis Opsi Pengelolaan Sumberdaya Ikan Tongkol di Pesisir Timur Minahasa, Propinsi Sulawesi Utara. Dibimbing oleh KIAGUS ABDUL AZIZ, LUKY ADRIANTO, dan RAHMAT KURNIA
Selama ini pemanfaatan sumberdaya ikan tongkol di Minahasa tidak secara baik dikelola oleh pemerintah setempat. Dengan kata lain, pemerintah setempat tidak memiliki kemampuan untuk melindungi sumberdaya ikannya. Selama periode 1986-2004, pemanfaatan sumberdaya ikan tongkol di Minahasa dilakukan melalui pendekatan akses terbuka. Oleh karena itu, kajian ini diharapkan dapat memberikan alternatif pengelolaan ikan tongkol yang lebih memperhatikan prinsip-prinsip keberlanjutan.
Berdasarkan hasil perhitungan menggunakan pendekatan Gordon-Schaefer, titik acuan kunci untuk hasil tangkapan maksimum berkelanjutan, hasil tangkapan maksimum secara ekonomi, hasil tangkapan optimal berkelanjutan dan akses terbuka secara berturut-turut adalah 744,27 ton; 267,73 ton; 275,90 ton dan 476,02 ton, sedangkan tingkat upayanya adalah sebagai berikut 9.453 trip; 1.889 trip; 1.954 trip dan 3.778 trip. Berdasarkan penilaian terhadap pemangku kepentingan, diketahui bahwa pemangku kepentingan yang berada diatas garis linier memiliki posisi yang strategis didalam pengelolaan perikanan tangkap di wilayah ini. Pemangku kepentingan dimaksud antara lain Ditjen Perikanan Tangkap (tingkat nasional), Dinas Perikanan dan Kelautan (tingkat propinsi), Dewan Perwakilan Rakyat Daerah, Dinas Kelautan dan Perikanan, Badan Perencanaan dan Pembangunan Daerah, Lembaga Swadaya Masyarakat, swasta, pemilik kapal dan kelompok nelayan (tingkat lokal). Selanjutnya, berdasarkan analisis trade-off diketahui bahwa skenario terbaik adalah skenario C karena skenario C memiliki nilai total lebih besar dari skenario B dan A.
vi Title : An Analysis of Little Tuna Resources Management
Options in the East Coast of Minahasa, North Sulawesi Province
Name : Kusdiantoro
SRN : C 25 10 40324
Approved by the advisory board,
Ir. Kiagus Abdul Aziz, M.Sc. Supervisor
Dr. Ir. Luky Adrianto, M.Sc. Co-supervisor
Ir. Rahmat Kurnia, M.Si. Co-supervisor
Acknowledged by:
Head of Study Program Dean of Post Graduate School
Prof.Dr.Ir. Rokhmin Dahuri, MS. Dr.Ir. Khairil Anwar Notodiputro, MS.
v
AN ANALYSIS OF LITTLE TUNA RESOURCES
MANAGEMENT OPTIONS IN THE EAST COAST
OF MINAHASA, NORTH SULAWESI PROVINCE
KUSDIANTORO
Thesis
as partial fulfillment for Master Science Degree in Coastal and Marine Resources Management Study Program
POST GRADUATE SCHOOL
BOGOR AGRICULTURAL UNIVERSITY
BOGOR
iv
© Copyright property of Kusdiantoro, 2006 All rights reserved
ix
BIOGRAPHY OF AUTHOR
He finished elementary and junior school in Indramayu District, West Java Province in 1990 and 1993 respectively. After that, he finished high school in Kuningan District of West Java in 1996. In the time, he got the opportunity to pursue his education in Bogor Agriculture University (IPB) by USMI. During 1996 – 2001, he studied on department of Fisheries Resources Utilization, Marine Science and Fisheries Faculty, Bogor Agriculture University.
After graduation from Bogor Agriculture University in 2001, he was approved in Ministry of Marine Affairs and Fisheries, exactly in Public Services and Information Centre (revised become Information and Data Statistic Centre). Beside that, during 2002 – 2006, he got the opportunity to active in the association of Indonesian Fisheries Scholars (ISPIKANI) on department of organization development (vice of chairman).
In July 2004, he passed the exam for Marine and Coastal Resource Management Project (MCRMP) scholarship to pursue he study for Sandwic h Master Degree Program in the coastal and marine resource management. The program was cooperation between Bogor Agricultural University of Indonesia and Århus Universitet of Denmark. During his study in Denmark, he has written scientific writing about Marine Fisheries Management in Tropical Area: Theory and Practice (Minor Thesis).
vii
PREFACE
Hereby I would like to give thankfulness to God who has been giving his blessing to me, so I could be finished my thesis. The study entitled of An Analysis
of Little Tuna Resources Management Options in the East Coast of Minahasa,
North Sulawesi Province has been done in April to June 2006. This thesis is as partial fulfillment for master science degree in Coastal and Marine Resources Management Study Program.
In this moment, I wish to express my earnest thanks and sincere appreciation to parties as follows:
1. Ministry of Marine Affair and Fisheries, and also mana ger of Marine and Coastal Resource Management Project (MCRMP). I am very grateful thanks for financial support by awarding me the scholarship during of my two years Master Degree study which without this support, this degree would not be possible.
2. Dr. Aji Sularso (The Head of Information and Statistic Data Centre, Ministry of Marine Affair and Fisheries/ISDC MMAF) and all of my partners in ISDC. I am very grateful thanks for support and opportunity to pursue study of Master Degree.
3. Ir. Adi Priana H. Pasaribu (Former of the Head of Public Services and Information Centre). I am very grateful thanks for opportunity to pursue study of Master Degree.
4. Ir. Kiagus Abdul Aziz, M.Sc., Dr. Ir. Luky Adrianto, M.Sc. and Ir. Rahmat Kurnia, M.Si., who acted respectively as my supervisor and co-supervisor of advisory board. I am deeply appreciate and respected them for their constant guidance, valuable suggestion; good advice and technical comment during arrange my thesis.
5. Prof.Dr.Ir. Ismudi Muchsin, DEA and Dr.Ir. Mennofatria Boer, DEA who have ready to become examiners and their inputs were very valuable for the improvement of this thesis.
viii University. I am the highest thanks for cooperation and precious knowledge and also understanding about marine and coastal resource management. 7. Prof. JØrgen Bundgaard, Prof. Lars Lund-Hansen, Vibeke Simonsen, Henning
Mogensen, and all of my lecturers in Århus Universitet, Denmark. I am the highest thanks for cooperation and precious knowledge and also understanding about English language problem during my study.
8. The Head of Fisheries and Marine Service and all of fisheries stakeholders in Minahasa, North Minahasa and South Minahasa. Thank you very much for all of their kindness and help during my research.
9. My friends and colleagues, Zaitul, Zaenal, Efrizal, Machmud, Saptoyo, Edo, Coky, Nety, Norma, Yesy and Eirin. Thank you very much for our friendship, our togetherness, help, advice, support and so on, so that we can finish study right on time.
10.My mother, my late father, my father-in-law, my mother-in-law, my brothers (Bambang Suprapto, Heru Rudiyanto, Edi Sukolaksono) and my sister (Dewi Ratnasari). I am very grateful thanks for their support and their prayers any time.
11.My wife and my son. I am deeply appreciate and very grateful thanks for their permission, their full support, their sacrifice, their love, their motivation and their players any time, which made this study possible and led to a successful completion.
12.Many people that I should thank for this task that is not mentioned individually
Moreover, I hope this thesis can give benefits to every one who needs it.
Bogor, September 2006
x
TABLE OF CONTENTS
Page
LIST OF TABLES ... xii
LIST OF FIGURES ... xiii
LIST OF APPENDIXS ... xiv
INTRODUCTION Background ... 1
Problem Identification... 3
Advantage and Objectives of Research ... 3
LITERATURE REVIEW Marine and Coastal Resource ... 4
Marine Fish Resource ... 4
Integration of Fisheries into ICM ... 5
Fisheries Management ... 6
Regulation of Marine Fisheries... 7
Input Control... 7
Output Control ... 7
Ecosystem-Based Management ... 8
Description of Little Tuna ... 9
Review of Fisheries Management Study in Indonesia... 10
METHODS Research Method... 12
Approach... 12
Data Collection ... 12
Sampling Method ... 14
Data Analysis ... 14
Biological Model... 14
Economic Model... 16
Bioeconomic Dynamic Model ... 17
xi RESULTS
Calculated and Trend CPUE... 23 Calculated Economic and Biological Parameters ... 24 Calculated MSY, MEY, OSY and OAY ... 25 Stakeholders Analysis ... 26 Scenario Analysis... 27 Determination of Criteria and Impact ... 27 Score Determination ... 28 Compilation of Policy Scenario ... 29 Scenario Assessment... 31
DISCUSSIONS
Overfishing in the East Coast of Minahasa... 33 Key Reference Point to Little Tuna Management ... 34 The Policy Implication for Little Tuna Management ... 35
CONCLUSIONS AND RECOMMENDATIONS
Conclusions ... 39 Recommendations ... 39
REFERENCES ... 40
xii
LIST OF TABLES
Page
1 Review of fisheries management study in Indonesia, 2000-2005 ... 11 2 The framework of fisheries stakeholders perception... 21 3 Matrix of impact sustainability on capture fisheries management
in present and 10 year in the future... 22 4 Determination of score to each criteria ... 22 5 Calculated CPUE for the fishery, 1986 – 2004... 24 6 Economic parameters (c, p, d)... 25 7 Biological parameters (r, q, K)... 26 8 Calculated MSY, MEY, OSY and OAY ... 26 9 Alternative scenarios on capture fisheries management ... 28 10 Matrix of impact sustainability on capture fisheries management
in present and 10 year in the future... 29 11 The effects table with scores and equal weights... 30 12 Mean points among the three options to show how much priority
xiii
LIST OF FIGURES
Page 1 Euthynnus affinis (Cantor, 1849) (Source: www.fao.org) ... 10 2 Auxis thazard (Source: www.fishbase.org) ... 10 3 Framework approach of research study... 14 4 The trade-off analysis process... 20 5 An illustration of stakeholders mapping ... 21 6 Trend CPUE of little tuna, 1986-2004 ... 24 7 Relationship between CPUE with effort ... 25 8 Various critical points of fishing effort... 27 9 Graphic of stakeholders analysis of marine capture fisheries
xiv
LIST OF APPENDIXS
INTRODUCTION
BackgroundMarine and coastal resources potential consist of a few categories namely: renewable resources, non-renewable resources and environmental services (Dahuri, 2004). One of the renewable resources is fish (FAO, 1997; Dahuri, 2003), according to study which is conducted by Ministry of Marine Affairs and Fisheries, and Indonesia Science Institute, the potential fish resource in Indonesian waters are 6.40 million tons per year (DKP dan LIPI, 2001). Hereinafter to fulfill the sustainability of fisheries management, the government should be implemented the principle of precautionary approach by specifying the total allowable catch (TAC) which is about 80% of the potency or about 5.10 million tons per year, which nowadays have been exploited about 4.10 million tons per year (about 64%).
Capture fisheries development is influenced by two strategic environment those are execution of free market (globalization era) and autonomy era (DKP, 2001). Both are become opportunity and challenge on fish resources management. Capture fisheries management also have some fundamental problems (Adisukresno, 1997; DJP, 1998), as follows: traditional, Illegal-Unregulated-Unreported (IUU) fishing, lack of facilities and infrastructure, habitat degradation, and limited of fish processing and handling. Due to that condition, so fisheries management require to be viewed as a system1, and also require to be responsible
and sustainable management as implementation form of governmental commitment to FAO-Code of Conduct for Responsible Fisheries (CCRF) which now is used for global guidance for fisheries resources management.
One of the areas in Indonesia having big potential of fish resources is Minahasa2. The areas consist of two fisheries management area (FMA3), namely:
FMA 6 (its area has been related to the east coast) and FMA 7 (its area has been related to the west coast) (Detailed map of FMA can be seen in appendix 2.). The
1 Charles, A.T (2001), explain that fisheries like as a system which covering some components, such as: the natural system, the human system and the fishery management system.
2 Minahasa area since 2003 was developed become 4 district/municipality, namely Minahasa district (old district), Minahasa Utara district (UU No.33/2003), Minahasa Selatan district (UU No.10/2003) and Tondano municipality (UU No.10/2003).
2 areas have potential fish resources and utilization level respectively 590,620 tons and 197,640 tons per year (is about 33%) for FMA 6, and for FMA 7 is 632,720 tons and 287,110 tons per year (is about 46%). Beside that, trend of production in Minahasa area, during 1986 – 2004, was fluctuated annually. The peak of production was attained in 2004 of 23,791.60 tons. In order to fishing boats4, the
peak of fishing boats was attained in 1999 of 6,974 units and then it was decline in 1997 and 1998 of 5,217 units (BPS Minahasa, 2005; Dinas Perikanan dan Kelautan Propinsi Sulawesi Utara, 2005). While the kind of fishing gears5 was used by the fishermen as follows: payang, beach seine, purse seine, set gill net, drift gill net, troll line, skipjack pole and line, lift net, and other line.
Furthermore, one of species caught by the fishermen in the east coast of Minahasa is little tuna. The little tuna is catches target species beside tunas, skipjack tuna and scads. The production of little tuna was fluctuated. The peak of production in the east coast of Minahasa was occurred in 2004 of 994.60 tons and than decline to 283.00 tons in 1986. The mini purse seine (here is called soma pajeko) operated by 20 persons use for catching the little tuna is equip by lamp and fish aggregating device/FAD (here is called rumpon). During 1985 – 2004, the number of fishing boats increased annually. The peak of fishing boats was attained in 2004 of 133 units.
Unfortunately, the utilization of marine fish resource in the area is not well managed. Means, the local government so far doesn’t have ability to protect fish resources. In the othe r word, the local government needs to implement of open access approach to manage marine capture fisheries resource. Therefore, the study of little tuna in this area is needed furthermore so that sustainable principles on its management can be given by alternative management without neglecting. Ideally, each fish species in this area should be managed in order to obtain the optimum production. However, this study is more focused on little tuna (Euthynnus affinis and Auxis thazard) in the east coast of Minahasa because of limited time and finance.
3 Problem Identification
Marine capture fisheries in the east coast of Minahasa are the major activity of the coastal society due to the lack of alternative sources of subsistence. It characterized by open access where there is crowding of effort in the coastal water. Based on observation in the field, the community of coastal area has some problem, such as: lack of fishery facilities and basic facilities, lack of technology and human resources, fuel supply limited and fuel price increasing, most society culturally experienced poorness and lack of management. Beside that, participation level of fishermen to fisheries development was lower than other stakeholders of fisheries, for example: fishermen weren’t easy getting capital, fishermen weren’t bargaining position to determine of fish price, and fishermen weren’t involved on fisheries development plan.
Furthermore, based on interview by fishermen and others, little tuna in the east coast of Minahasa was estimated overfishing. It can be seen by biological indicated, such as: fishing ground was farer than before, the average of it weight and length which caught was under average, and production every year was stagnant but its effort level was increasing. The study is based on empirical investigation that has provided insight into such question as: (1) Are the present fish harvesting levels in this area sustainable? (2) If fish harvesting level at the level that unsustainable and over capital, what kind alternative of little tuna management could be implemented to ensure sustainability in the long run?
Advantage and Objectives of Research
The present research was undertaken with such objectives as:
(1) To determine the different key reference point like maximum sustainable yield (MSY), maximum economic yield (MEY), optimum sustainable yield (OSY) and open access yield (OAY) and their corresponding effort levels by applying theoretical bioeconomic model.
(2) To study fisheries stakeholders is as actors of capture fisheries management in the east coast of Minahasa.
(3) To design policy alternative of little tuna resources management.
LITERATURE REVIEW
Marine and Coastal ResourcesCoastal area is defined as the interface or transition zone, but the border between land and sea is not fixed (Clark, 1996). In Indonesia, coastal area is defined as interface area between sea and land, which has landward and seaward (Soegiarto, 1976 in Dahuri et al., 2004). Coastal area has characteristics (Scura et al., 1992 in Cicin-Sain and Knceht, 1998) as follows: (1) contain habitat and ecosystems that provide goods (e.g. fish) and services to coastal communities, (2) competition for land and sea resources and space by various stakeholders, (3) serves as the source of national economy of coastal state, and (4) usually is densely populated and is a preferred site for urbanization. Furthermore, marine and coastal resource involve in a few categories, as follows renewable resources, non-renewable resources and environmental services (Dahuri, 2004).
Increased use of the coastal and marine zone was posed considerable challenges to this often dual system on marine and coastal management, and than the concept was developed become integrated coastal management (ICM). According to Cicin-Sain and Knceht (1998), ICM defined as a continuous and dynamic process by which decisions are made for the sustainable use, development, and protection of coastal and marine areas and resources. Therefore, the concept has goals, such as: to create of sustainable development, to reduce vulnerability, and to maintain essential ecological process. Beside, ICM also need three dimensions in their activities as follows: sector, science and ecological linked (Dahuri et al., 2004).
Marine Fish Resource
5 area usually fish resource has multi species characteristics, for example Indonesia has more 2,000 species of marine fish (Bleeker, 1959 in Dahuri, 2003).
Generally, marine fish resource in Indonesia based on taxonomy can be classified into pisces and non-pisces (mollusc, crustacean, holoturaeda, reptilian
and mammalian) (Widodo et al., 1998; DKP dan LIPI, 2001). Based on their habitat, pisces are divided into three groups, such as: (1) pelagic fish, fish live principally in the upper layers of the ocean (near the surface); (2) demersal fish, fish live near bottom; and (3) coral fish, fish live in related with by coral reef ecosystem. Furthermore, according to activities in the location, marine capture fisheries in Indonesia were consists of three groups namely: offshore fisheries, coastal fisheries and inland fisheries (Dahuri et al., 2004).
Fishery resource and their environment mean that each fishery is unique. If the fishery is small-scale, hence will harvest species in nearby water, and if the fishery is large-scale, hence will harvest species in hundreds or even thousand of kilometers. Moreover, fish in the ocean generally has migratory habits. For example, pelagic fish tend always to make a move and do not know administrative regional boundaries, so its management requires to be done by totally through compilation of regional policy with attention on sustainability of resource and common interest.
Integration of Fisheries into ICM
Capture fisheries developments depend on the coastal area because most capture fisheries are based on coastal stock, especially coastal fisheries. Beside, dependency of fisheries on coastal area makes it particularly susceptible to activities which result on coastal environment change, such as pollution, habitat degradation and spatial conflict (FAO, 1996). Means, coastal area has important function to fisheries sector. Therefore, fisheries administrator should be included in an integrated coastal management planning process.
6 consider the development and management of the fisheries sector within the context of coastal area management and development planning.
According to implementation of decentralization period, local government has got the bundles of new authorities concerning marine-fisheries management. As mentioned in this law as far as 12 miles water sea area from shoreline is under provincial government authority and within those 12 miles there are 4 miles under the authority of the local or district government. Meaning, local government has authorities into fisheries management, especially coastal fisheries.
Conflict may arise between fishermen and other activities on the coastal resource management. They are competing for space and resource, and in many more situations. The conflict inter-sectoral is typically more difficult to resolve than intra-sectoral disputes, although the solutions may be similar. Therefore, the common approach in the resolution of inter-sectoral differences involving fisheries, such as: zoning and implementing of institution and legal functions.
Fisheries Management
Fisheries management can be defined as “the integrated process of information gathering, analysis, planning, consultation, decision-making, allocation of resources and formulation and implementation with enforcement as necessary, of regulations or rules which govern fisheries activities in order to ensure the continued productivity of the resources and accomplishment of other fisheries objectives” (FAO, 1997). On the other hand, fisheries management shall promote the maintenance of the quality, diversity and availability of fishery resources in sufficient quantities for present and future generations in the context of food security, poverty alleviation and sustainable development (FAO, 1995a). Fisheries management should more pay attention principles as follows: precautionary6, integrated7, responsibility8, sustainability9, community based and
co-management10.
6 T he precautionary approach is needed if there are threats of serious or irreversible damage to natural resource in their management (Cherles, 2002; FAO, 1995b; 1996; 1997; Garcia, 1994).
7 Fisheries development has been including integrated coastal zone management (ICZM) together other activities on coastal and marine areas (Cicin and Robert, 1998).
8 One of the guidelines focusing on responsible fisheries management was the code of conduct for responsible fisheries (CCRF) (FAO, 1995)
9 Fishery is one of the many activities that can contribute to sustainable development (Garcia et al., 2000).
7 In Indonesia, pursuant to UU 31/2004 about Fisheries (revised version of UU 9/1985), fisheries management can be defined as all effort, including process which integrated of information gathering, analysis, planning, consultancy, decision-making, allocation of resource and implementation and also the straightening of law and regulation in fisheries sector conducted by other authority or government which instructed to reach the continuity of marine natural resource productivity and target which have been agreed on. While target of fisheries management is to improve welfare of fisherman and fish farmer, improving acceptance of state, extension of employment, ready of protein, optimization of fisheries management, and guarantee continuity of resources .
The main objective of fisheries management is the conservation of fish stocks (King, 1995). In modern fisheries management this limited purpose has been extended to address additional economic, social and environmental objectives such as fishers’ welfare, economic efficiency, the allocation of resources and environmental protection. Meaning, fisheries management have primarily been based on a biological approach, which is related with two problems such as fisheries biology, and the models and concepts of fisheries biologists (King, 1995; Nielsen and Degnbol, 2001).
In developing countries, certainly in tropical areas, coastal and marine fisheries are characterized by multi species fisheries caught by commercial, traditional and community fishers (Cholik and Widodo, 1997). Some coastal fisheries are managed through the exercise of traditional fishing rights, but the majority has open access regimes, in which there is little ability to manage individual stocks or stock complexes, or to enforce zoning regulations between the different types of fishery.
Regulation of Marine Fisheries Input Control
8 escape gap (King, 1995) or expressed in a different way limiting entry, limiting the capacity per vessel, limiting the intensity of operation, limiting time fishing and limiting the location of fishing (Charles, 2001).
The greatest problems in using input controls alone to regulate fisheries are associated with problems of determining how much effort is actually represented by each fishing unit. In practice, however, scarcity of data and continual change, often associated with efficiency increases, make such calibrations difficult (Cholik and Widodo, 1997).
Output Control
Output control can be defined as regulation the total harvest of fish stock in the fishery system (Charles, 2001). Output control focuses almost entirely on what is taken from the fish stock, such as size limits, rejection of females or spawning females, catch quotas and enforcement of regulations (King, 1995) or expressed in a different way TAC, individual quotas, community quotas and escapement control (Charles, 2001).
Output control also has problems in its implementation, especially associated with monitoring the outputs. While catch control may protect the resource, in the absence of limited entry and individual quotas, it does not reduce the social and economic distortions brought about by competing fishermen racing to obtain the greatest possible share of the TAC before it is filled.
Ecosystem-Based Management
9 Furthermore, according to King (1995), EBM to marine capture fisheries is an approach to manage human activity within the ecosystem. Beside that, Marine Protected Area (MPA) is a true example of EBM in that there is no focus on individual species, but instead there is an emphasis on limiting human activity throughout a designated area of the ocean or other water body (Charles, 2001). Therefore, EBM to marine fisheries should be supported by indicators of their implementation (Jennings, 2005).
However, EBM should take into account the following four aspects: (1) the interaction of a targeted fish stock with its predators, competitors and prey species; (2) the effects of weather and hydrograph on fish biology and ecosystem; (3) the interaction between fish and their habitats; and (4) the effects of fishing on fish stocks and their habitats (Vivekanandan, 2001).
Description of Little Tuna
As highly migratory species, little tuna can be group into big pelagic (DKP dan LIPI, 2001). Indonesia has two species of little tuna (Directorate General of Fisheries, 1979), namely Euthynnus affinis and Auxis thazard. In eastern Indonesia waters, Euthynnus affinis is the biggest. Furthermore, the taxonomy of little tunacan be classified as (Saanin, 1968):
Phylum : Chordata
Sub-phylum : Vetebrata Class : Pisces
Sub-Class : Teleostei Ordo : Percomorphi
Sub-Ordo : Scombroidea Family : Scombridae
Genus : Euthynnus, Auxis Species: - Euthynnus affinis
- Auxis thazard
10 by 8-10 extra fins. Their bodies without scales except on the corselet and flank. The tile has single strong bone which the position surrounded by two small bone. Maximum fork length this species is about 100 cm, but common to 50 - 60 cm. A picture of Euthynnus affinis can be seen in Figure 1.
Figure 1. Euthynnus affinis (Cantor, 1849) (Source: www.fao.org)
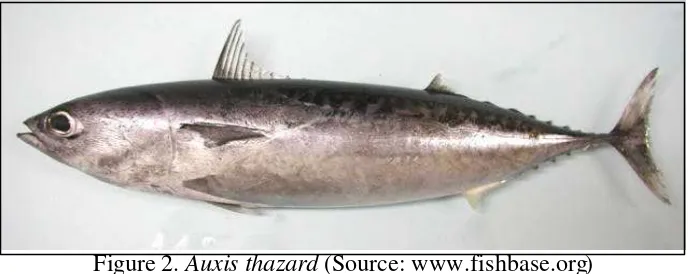
While Auxis thazard has characteristics of morphology as follows: torpedo-shaped body built, rigid and circle like cheroot. The fish has two dorsal fins, namely: the first of dorsal fin consist of 10 hard spine and the second consist of 11 soft spines. It was followed by 8-10 extra fins. Their bodies without scales except on the corselet which complete arise and become small on the backside. Maximum fork length this species is about 50 cm, but common to 25 - 40 cm (Figure 2).
Figure 2. Auxis thazard (Source: www.fishbase.org)
[image:35.596.140.484.471.608.2]11 Furthermore, potency of little tuna in Indonesia was achieved is about 204,652 tons per years with utilization level is about 111,510 tons per years in 1997 (54%).
Review of Fisheries Management Study in Indonesia
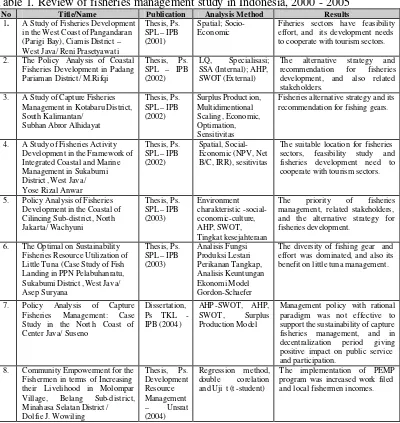
[image:36.596.118.518.241.664.2]As means to get “red yarn” about research of policy analysis and fisheries management study, hence author executing a review about research results and also method approach which used along period of 2000 until 2005. Review of fisheries management study in Indonesia can be seen in Table 1.
Table 1. Review of fisheries management study in Indonesia, 2000 - 2005
No Title/Name Publication Analysis Method Results
1. A Study of Fisheries Development
in the West Coast of Pangandaran (Parigi Bay), Ciamis District – West Java/ Reni Prasetyawati
Thesis, Ps. SPL – IPB (2001)
Spatial;
Socio-Economic Fiheries sectors have feasibility effort, and its development needs to cooperate with tourism sectors. 2. The Policy Analy sis of Coastal
Fisheries Development in Padang Pariaman District / M.Rifqi
Thesis, Ps. SPL – IPB (2002)
LQ, Specialisasi; SSA (Internal); AHP, SWOT (External)
The alternative strategy and recommendation for fisheries development, and also related stakeholders.
3. A Study of Capture Fisheries Management in Kotabaru District, South Kalimantan/
Subhan Abror Alhidayat
Thesis, Ps. SPL – IPB (2002)
Surplus Product ion, Multidimentional Scaling, Economic, Optimation, Sensitivitas
Fisheries alternative strategy and its recommendation for fishing gears.
4. A Study of Fisheries Activity Development in the Framework of Integrated Coastal and Marine Management in Sukabumi District , West Java/ Yose Rizal Anwar
Thesis, Ps. SPL – IPB (2002)
Spatial, Social-Economic (NPV, Net B/C, IRR), sesitivitas
The suitable location for fisheries sectors, feasibility study and fisheries development need to cooperate with tourism sectors.
5. Policy Analysis of Fisheries Development in the Coastal of Cilincing Sub-district, North Jakarta/ Wachyuni
Thesis, Ps. SPL – IPB (2003) Environment charakteristic -social- economic-culture, AHP, SWOT, Tingkat kesejahteraan
The priority of fisheries management, related stakeholders, and the alternative strategy for fisheries development.
6. The Optimal on Sustainability Fisheries Resource Utilization of Little Tuna (Case Study of Fish Landing in PPN Pelabuhanratu, Sukabumi District , West Java/ Asep Suryana
Thesis, Ps. SPL – IPB (2003) Analisis Fungsi Produksi Lestari Perikanan Tangkap, Analisis Keuntungan Ekonomi Model Gordon-Schaefer
The diversity of fishing gear and effort was dominated, and also its benefit on little tuna management.
7. Policy Analy sis of Capture Fisheries Management: Case Study in the Nort h Coast of Center Java/ Suseno
Dissertation, Ps TKL - IPB (2004)
AHP -SWOT, AHP, SWOT, Surplus Production Model
Management policy with rational paradigm was not effective to support the sustainability of capture fisheries management, and in decentralization period giving positive impact on public service and participation.
8. Community Empowerment for the Fishermen in terms of Increasing their Livelihood in Molompar Village, Belang Sub-district, Minahasa Selatan District / Dolfie J. Wowiling
Thesis, Ps. Development Resource Management – Unsrat (2004) Regression method, double corelation and Uji t (t -student)
12
9. Policy Analysis of Capture Fisheries Development in terms of Economic Empowerment in the Southern Coast of Gorontalo/ Nurdin Jusuf
Dissertation, Ps. SPL – IPB (2005)
Input-output analysis, goal programming, product-moment, investment visibility and hierarchy process
METHODS
Research MethodResearch method used in this study is the case study method using secondary data. This method aimed to analysis data to obtain something that has benefit (Singarimbun dan Effendi, 2000). Gathering data and grouping from various source is analyzed later to use descriptive method.
Approach
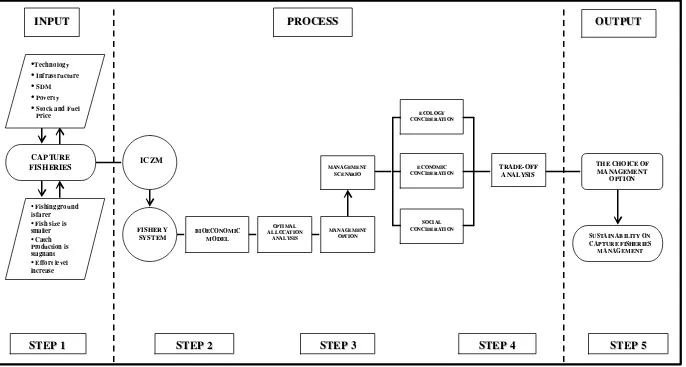
The framework approach of the study is conducted as guidance in executing research which starts with input to output, drawn in five step of network. This research is aimed at dominant species stud y of little tuna that caught by fisherman in the coast of Minahasa and also have high economic value. A complete framework approach of study provide in Figure 3.
The first step, researcher begins to identify any problem in this area. Then, how to place capture fisheries become a part of integrated coastal zone management and put them as one fishery system. To determine of optimal allocation of fish resource using some model approach, such as MSY, MEY, OAY, OSY and actual condition.
Furthermore, I compose management scenario based on combination between optimum sustainable yield and actual condition. In the last, choice of management option is executed by trade-off analysis with some consideration, namely ecology, economic and social. Sustainability on capture fisheries management is obtained through choice of management option is the best.
Data Collection
14
Figure 3. Framework approach of research study
O
OUUTTPPUUTT I
INNPPUUTT
S
STTEEPP11 SSTTEEPP22 SSTTEEPP33 SSTTEEPP44 SSTTEEPP55
P
PRROOCCEESSSS
M
MAANNAAGGEEMMEENNTT
S
SCCEENNAARRIIOO
M
MAANNAAGGEEMMEENNTT
O
OPPTTIIOONN
B
BIIOOEECCOONNOOMMIICC
M
MOODDEELL
O
OPPTTIIMMAALL
A
ALLLLOOCCAATTIIOONN
A
ANNAALLYYSSIISS
E
ECCOOLLOOGGYY
C
COONNCCIIDDEERRAATTIIOONN
E
ECCOONNOOMMIICC
C
COONNCCIIDDEERRAATTIIOONN
S
SOOCCIIAALL
C
COONNCCIIDDEERRAATTIIOONN
C CAAPPTTUURREE F
FIISSHHEERRIIEESS
•Technology
• Infrastructure
• SDM
• Poverty
• Stock and Fuel Price
• Fishing gro und is farer
• Fish size is smaller
• Catch Production is stagnant
• Effort level increase
I ICCZZMM
F FIISSHHEERRYY
S SYYSSTTEEMM
T
TRRAADDEE--OOFFFF A ANNAALLYYSSIISS
S
SUUSSTTAAIINNAABBIILLIITTYYOONN
C
CAAPPTTUURREEFFIISSHHEERRIIEESS
M
MAANNAAGGEEMMEENNTT
T
THHEECCHHOOIICCEEOOFF M
15 and development board; MMAF; and Ministry of Trading. The secondary data collected contents such as the number of fishing boat by type of fishing gear, the number of fishing gear by type, the number of production by species, the number of fisherman, value and volume of marine fisheries production, Minahasa data by number, and SUSENAS report in North Sulawesi province.
Sampling Method
The respondent is chosen in order to support primary data collecting by survey method. Critical points in sampling technique in order to catch ideal respondent are as follows: (1) yielding picture are able to be trusted from all population; (2) determining accuracy of research result by way of finding standard deviation of obtained valuations; (3) simple to be conducted; and (4) lower cost (Daniel, 2002 in Adrianto, 2004). Based on above that description and also research characteristic, so the sampling method in this research is using stratified random sampling. This method must be fulfilled in two step i.e.: (1) stratification of stakeholders using analysis approach of stakeholders; (2) continued with sampling of respondent answer by proportiona l so that obtained to the number of respondent and stakeholders which able to deputize of capture fisheries management according to the research location (Gomez and Gomez, 1976; Fauzi, 2005). Hereinafter the perception of chosen respondent could be evaluated by an interview, questioner and mini workshop.
Data Analysis
Data analysis was conducted after data collecting as a mean to answer of some question and problem of research. In this network research, data being analyzed are as follows:
Biological Model
16 )
(
/dt f x
dx =
(1 )
K x
xr −
= .…... (1)
Where : x is the stock size (biomass); k is the carrying capacity; r is the intrinsic growth of fish; f(x) is the natural growth; and dx/dt= the growth rate of
biomass. If the population level is equal to carrying capacity (K) so the stock size of maximum sustainable yield is achieved at one-half of the condition of carrying capacity (1/2 K).
Furthermore, the effect of fishing on population dynamics can be written as:
h x
f dt
dx/ = ( ) − ………... ….. (2)
Finally, Schaefer expressed catch in terms of effort by simple relation:
qEx
h = ……….. (3)
Where: h is the catch measured in term of the biomass; q is a constant called the catchability coefficient; and E is the fishing effort. Furthermore, the growth rate of biomass in the equilibrium model is set equal to zero
(
dx/dt = 0)
, populationhence:
0 )
(
/dt = f x − h =
dx
Based on equation (1) and equation (3) so the biomass at the equilibrium, x, is solved to be:
− = r qE K
x 1 ……….………. (4)
Inserting equation (4) into equation (3) gives rise to:
− = E r q qKE
h 1 or
2 2 E r K q qKE
h = − ...…….………... (5)
If qK = a is intercept and b
r K q
=
2
is regression coefficient so the
equation can be expressed as:
2 bE aE
17 To determinatio n of catch per unit of effort (CPUE) is calculated of catch and effort. While a and b can be estimated from CPUE and effort data through linear regression and it can be expressed by:
bE a
E
h = −
..……… (7)
Furthermore, the effort at MSY can be obtained from equation (6) by taking partial derivative of h with respect to E and setting it equal to zero
(
dh/dE = 0)
as:b a
E MSY
2
=
− ……….. (8)
Inserting equation (8) into equation (6) gives rise to:
b a MSY
4
2
= ………..….... (9)
Economic Model
Economic model of fisheries are underlined by biological models. This model is developed by Gordon so that familiar is called Gordon-Schafer model. The model has objective to get optimum value of each appliance catch type in order to catch dominant species so that obtained by maximum benefit utilize to overcome the problem of resources limitation. Gordon-Schaefer model mathematically the equation expressed as:
) ( )
( )
(E = TR E − TC E
π ……… (10)
cE ph −
= …..…...………... (11)
Where p is benefit of resource utilization; TR (E) is total revenue; TC (E) is total cost; p is the average price per ton of little tuna; and c is the average unit cost of effort (includes the opportunity cost of labor andcapital).
In the open access point, total fishing costs are equal to total revenues from the fishery since vessel homogenous is assumed. Then the open access effort is
obtained by equationTC(E) = TR(E) or ph = cE. Inserting equation (5)
into equation (11), the equation of OAY condition, gives rise to:
b p c a E OAY ) ( − =
18 OAY
OAY
OAY aE bE
h− = − − 2− ……….. (13)
Inserting equation (3) into equation (11) gives rise to:
) (pq
c
x−OAY = ……… (14)
Furthermore, maximum economic return is realized at a lower fishing effort since positive economic rent only is obtained at efforts lower thanE−OAY. The
condition of MEY is attained at the profit maximizing level of effort
(πl(E) = 0 or dπ(E)/dE = 0). Inserting equation (5) into equation
(11), the equation of MEY condition, gives rise to:
2 OAY MEY
E
E− = − ...……… (15)
2
MEY MEY
MEY aE bE
h− = − − − ……….. (16)
Inserting equation (3) into equation (11) gives rise to:
2 ) ( ) 2 ( ) ( OAY MEY x k pq c pqk
x− = + = + − ……… (17)
Where: x−OAY is the biomass at OAY; h−OAY is the catch measured in term of the
biomass at OAY; E−OAY is the fishing effort at OAY; x−MEY is the biomass at
MEY; h−MEY is the catch measured in term of the biomass at MEY; and E−MEY is
the fishing effort at MEY.
Bioeconomic Dynamic Model
Bioeconomic dynamic model is bioeconomic model more complex and dynamic than bioeconomic static model which develop by Gordon-Schaefer. This model is developed by Clark and Munro (1975) in Fauzi and Anna (2005), mathematically the equation expressed as:
) (x f qx c p − =
π , when h = f(x) ……… (18)
The present value of flow of net revenues in a time interval (0, œ) will be:
dt x
PV δt
π = ∫∞0 π( )l− or
dt E c pqx
PV = ∫0∞ l−∂t ( − )
19 Maximization of the present value (19), one yields:
dx d qx c p π δ =
− .………... (20)
Inserting (18) into (20) yields = δ
− + qx c p x f qx c x f ) ( ) ( 2 '
Differentiating equation (20) leads to a quadratic function where the optimal stock level, x’, is a positive root and depends on the parameters c, p, q, r, k and d according to the following relationship:
+ + − + + − = pqKr c r pqK c r pqK c K
x 1 δ 1 δ 8δ
4
2
* …..…….. (21)
Optimum biomass ( *
x ) decreases as discount rate (d) increases, and consequently
will approach the biomass at bionomic equilibrium (open access). The production of OSY condition and the optimal effort level
(
E−OSY)
for a given price of time dare then obtained by:
− = − K x rx h OSY *
* 1 ……… (22)
* qx h E OSY OSY −
− = ……… (23)
Trade -Off Analysis (TOA)
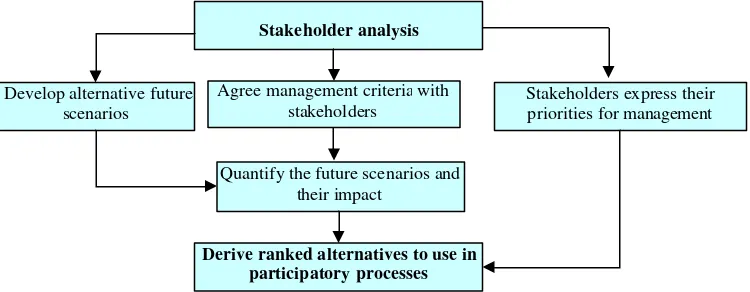
20 This analysis begins with a stakeholder analysis to identify stakeholders, and a conflict assessment to determine stakeholders’ interests and potential use conflicts. Information from the analysis can be used to generate future development scenarios. The stakeholders who have been identified as important to the process are then engaged to agree upon a set of likely impacts of the alternative future scenarios (these impacts are referred to as the management criteria) for the resource under investigation in this case the coastal zone. This information forms the basis for the multi-criteria analysis. Information is collected to determine the impacts of the alternative future scenarios on each of the management criteria (Brown et al., 2001). Figure 4 shows of TOA process.
Figure 4. The trade-off analysis process
This analysis provide framework that trying to develop between existing problems with a purpose to management of period to come, so that this study will be try to use stakeholder approach, which all decision of capture fisheries management to be delivered to all stakeholder. Hence, according to above matter the step needed to this analysis are:
(1) Stakeholder Analysis
Stakeholder analysis is a system for collecting information about groups or individual who effecting decision, categorizing that information, and explaining the possible conflicts that may exist between important group, and area where trade-off may be possible. To execute stakeholder analysis, hence needed steps. The first, identifying stakeholders, the method for identifying stakeholders is to use a continuum of stakeholders from the macro to the micro level. For example, stakeholder in this location is involved in national, regional and local stakeholder.
Stakeholder analysis
Develop alternative future scenarios
Agree management criteria with
stakeholders Stakeholders express their priorities for management
Quantify the future scenarios and their impact
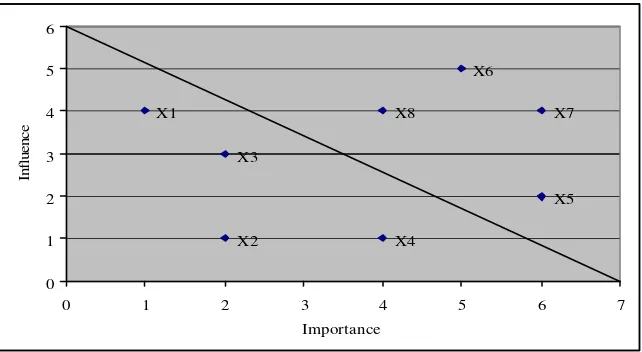
21 Second, categorizing stakeholders into priority groups, stakeholders involvement based on importance level and their influence. The framework of fisheries stakeholders’ perception can be seen in Table 2.
Table 2.The framework of fisheries stakeholders’ perception
Continuum
level Stakeholders groups
Importance Level*)
Influence Level**)
National
Regional
Local
Notes:
*) Very important = 7, important =5, moderate important = 3, less important = 1 , and 2, 4 and 6 = average value (Saaty, 1991) **) Very influence = 7, influence = 5, moderate influence = 3, less influence = 1 and 2, 4 and 6 = average value (Saaty, 1991)
Further, the result of stakeholder analysis will be depleted as graphic to show level of important and influence of all stakeholders. The perspective of the graphic in presented in Figure 5.
X7 X6
X8
X5
X4 X3
X2 X1
0 1 2 3 4 5 6
0 1 2 3 4 5 6 7
Importance
Influence
Figure 5. An illustration of stakeholders mapping
(2) Scenario Analysis
22 (3) Determination of Criteria and Impact
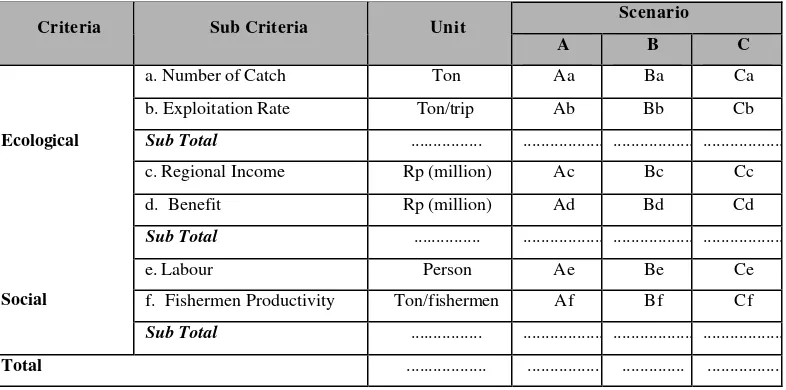
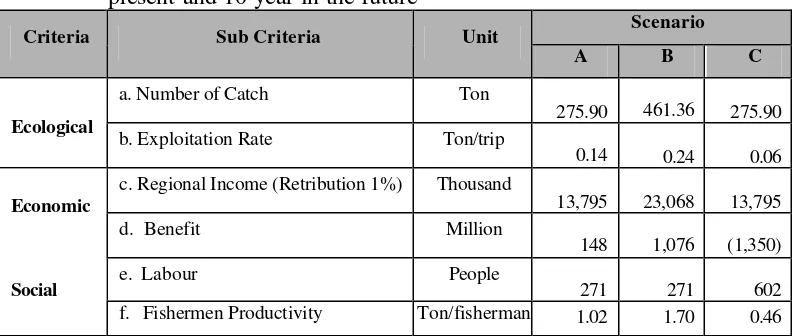
[image:47.596.118.511.293.488.2]Pursuant to scenario above hereinafter compiled by various alternative of capture fisheries management to support arrangement of capture fisheries policy supported by all stakeholders. Impact estimation on capture fisheries management about 10 years in the future shall be seen from condition of economics, ecology and social which have been weighted and included into development scenarios which have been agreed. In detail impact estimation to scenario can be seen in Table 3.
Table 3. Matrix of impact sustainability on capture fisheries management in present and 10 year in the future
Scenario
Criteria Sub Criteria Unit
A B C
a. Number of Catch Ton Aa Ba Ca
b. Exploitation Rate Ton/trip Ab Bb Cb
Sub Total ... ... ... ...
c. Regional Income Rp (million) Ac Bc Cc
d. Benefit Rp (million) Ad Bd Cd
Ecological
Sub Total ... ... ... ...
e. Labour Person Ae Be Ce
f. Fishermen Productivity Ton/fishermen Af Bf Cf
Social
Sub Total ... ... ... ...
Total ... ... ... ...
(4) Score Determination
Pursuant to total score from every scenario will show alternative of capture fisheries management which have given high priority with condition of economics, ecological and social in the future most be wanted. Determination of score to each criterion can be seen in Tables 4.
Table 4. Determination of score to each criteria
Criteria Scoring Formula
Ecological 100
min x X X X X X imum maksimum maksimum S − − =
Economic 100
min min x X X X X X imum maksimum imum S − − =
Social 100
min min x X X X X X imum maksimum imum S − − =
Source : Adopted from Brown et al. (2001)
23 (5) Compilation of Scenario Policy
If a choice from group of stakeholder different among them in identifying and analyzing, hence result a priority taken to change position of ranking in previous scenario. The choice of stakeholder to differentiate management priority can be conducted in various. Information collected result a different kind of data, like nominal data, ordinal, or ratio shall be turned into ranking from each scenario.
(6) Identifying Weight of Ranking Scenario
Identifying weight of ranking scenario will be in the following two phases, namely the aspect weight and indicator weight. Weight of aspect shows management priority, while weight of indicator shows importance level of indicator in aspect group. Coefficient of priority management of ranking with score exist in each criterion if summed will yield in weighted of scenario. The result from policy evaluation with this regime method in ranking scenario so that can be selected by scenario that most wanted.
(7) Scenario Assessment
RESULTS
Calculated and Trend CPUEThe estimated catch per unit effort (CPUE) of little tuna by mini purse seine was found based on production and its effort every year. The average CPUE during 1986 until 2004 is about 0.12 tons per trip (Table 5).
Table 5. Calculated CPUE for the fishery, 1986 – 2004
Year Production (ton) Effort (trip) (ton/trip) CPUE Year Production (ton) Effort (trip) (ton/trip) CPUE
1986 283.00 2,205 0.13 1996 352.30 3,950 0.09 1987 320.70 2,601 0.12 1997 444.50 4,615 0.10 1988 321.60 2,776 0.12 1998 594.60 3,529 0.17 1989 378.70 2,554 0.15 1999 493.70 3,372 0.15 1990 363.00 2,626 0.14 2000 395.50 2,842 0.14 1991 318.70 1,729 0.18 2001 514.10 6,517 0.08 1992 318.50 1,903 0.17 2002 719.40 5,310 0.14 1993 345.30 3,802 0.09 2003 751.20 11,215 0.07 1994 324.60 4,848 0.07 2004 994.60 12,104 0.08 1995 531.90 3,805 0.14 Average 461.40 4,332 0.12
Source: Processing data by BPS of Minahasa (2005); Marine and Fisheries Services of North Sulawesi Province (2005)
Figure 6 shows that CPUE remained fairly stable during 1986 until 1992, while it started fluctuating and declining in 1993, 1994, 1996 1997, 2001, 2003 and 2004 under the average CPUE.
The peak of CPUE was attained in 1991, while decline of CPUE was obtained in 1994 and 2003 (Figure 6). CPUE dropping may indicate economic loss of fishermen. This condition can be explained by increasing of effort and reducing of production.
0.00 0.02 0.04 0.06 0.08 0.10 0.12 0.14 0.16 0.18 0.20
1986 1987 1988 1989 1990 1991 1992 1993 1994 1995 1996 1997 1998 1999 2000 2001 2002 2003 2004
Year
ton per trip
25 Furthermore, Figure 7 shows that CPUE has relationship with effort. Increasing the number of effort give impact to CPUE. The peak of CPUE was attained effort between 2,000 until 4,000. Generally, CPUE in this location was located effort level between 2,000 until 8,000. CPUE is smaller in 2003 and 2004 because the effort is bigger. This condition can explain that increasing of effort will reduce of CPUE.
0.00 0.02 0.04 0.06 0.08 0.10 0.12 0.14 0.16 0.18 0.20
0 2,000 4,000 6,000 8,000 10,000 12,000 14,000
Effort (trip)
CPUE (ton per trip)
Figure 7. Relationship between CPUE with effort
Calculated Economic and Biological Parameters
By inserting effort (E) to catch per unit effort (CPUE) into equation (7), catch parameters a (intercept) and b (regression coefficient) that provided best and
unbiased linier regression were estimated by performing regression analysis. The value a and b are 0.16 and 8.33 x 10⁻⁶ respectively with R2 adjusted is 0.42.
The present study used little tuna price by interviewing of fishermen in the research location (5,000,000 per tons) as a constant price over the years. Furthermore, the unit cost per effort of little tuna was calculated by interviewing of fishermen (630,000 per trip) over the years. While discount rate was calculated by interest rate of BRI in Minahasa in 2006 is about 19 % per year (Table 6). Table 6. Economic parameters (c, p, d)
Parameters Definition Amount
c The average unit cost of effort 630,000
p The average of fish price 5,000,000
d Discount rate 0.17
26 production and optimal effort level (Appendix 5). Intrinsic growth in tropical stock was considered between 1 and 2 (Berachi, 2003), hence OSY and its effort level were found to be in the vicinity of 275.90 tons and 1,954 trips. Biological parameters value of little tuna can be seen in Table 7.
Table 7. Biological parameters (r, q, K)
Parameters Definition Amount
r Intrinsic growth 1.49
q Constant catch ability 8 x 10⁻⁵
K (ton) Carrying capacity 2,000
Calculated MSY, MEY, OSY and OAY
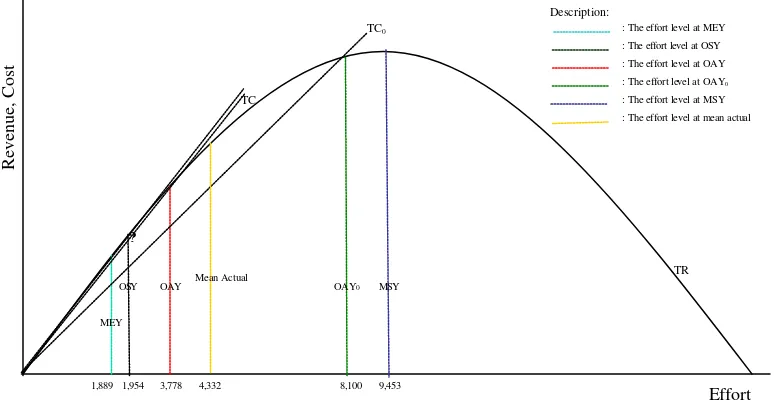
Based on the calculation using Gordon-Schaefer model, hence obtained of MSY, MEY, OAY and its effort level of little tuna were 744.27 tons (effort is 9,453 trips); 267.73 tons (effort is 1,889 trips); and 476.02 tons (effort is 3,778 trips) respectively. While OSY and its effort level obtained, optimal stock level (optimal biomass) was very sensitive and had almost the same percentage change in response to a change in K, 275.90 tons and 1,954 trips. In order to catch and effort in the actual condition were found by catch and effort average during 1986 until 2004. Detail information of MSY, MEY, OSY, OAY and actual condition of little tuna can be seen in Table 8.
Table 8. Calculated biomass, effort, catch, cost, revenues and profits of little tuna management in the east coast of Minahasa based on empirical model
Harvest Condition
Model Variable
MSY MEY OSY OAY Actual (mean)
Biomass (ton) 1,000.00 1,800.18 1,793.29 1,600.36 1,541.77
Effort (trip) 9,453 1,889 1,954 3,778 4,332
Catch (ton) 744.27 267.73 275.90 476.02 461.36
Cost (billion) 5,955 1,190 1,231 2,380 2,728 Revenue (billion) 3,721 1,338 1,379 2,380 2,306 Schaefer
Profit (thousand)