CARBON AND NITROGEN STOCKS OF DIFFERENT DEAD WOOD
DECAY STAGES IN NATURAL AND CONVERTED TROPICAL
LOWLAND FORESTS (JAMBI, INDONESIA)
SELIS MERIEM
GRADUATE SCHOOL
BOGOR AGRICULTURAL UNIVERSITY BOGOR
STATEMENT OF THE THESIS,
SOURCE OF INFORMATION AND COPYRIGHT
DEVOLUTION*
I hereby declare that this thesis entitled Carbon and Nitrogen Stocks of Different Dead Wood Decay Stages in Natural and Converted Tropical Lowland Forests (Jambi, Indonesia) is the result of my own work through the guidance from my academic supervisors and has not been submitted in any form for another degree at any other university. Sources of information derived from published and unpublished works of other authors is mentioned in the text and listed in the list of references at the end of this thesis.
I hereby assign the copyright of my thesis to Bogor Agricultural University.
RINGKASAN
SELIS MERIEM. Stok Karbon dan Nitrogen pada Tingkat Pelapukan Kayu Mati yang Berbeda di Hutan Alam dan Hutan Konversi Dataran Rendah Tropis (Jambi, Indonesia).Dibimbing oleh TRIADIATI dan SOEKISMAN TJITROSOEDIRJO.
Kayu mati berperan signifikan sebagai bagian yang terintegrasi dari suatu hutan, menyediakan sumber nutrien dalam jumlah besar dan habitat bagi dekomposer dan biota hutan lainnya. Transformasi hutan alam menjadi berbagai sistem pemanfaatan lahan di dataran rendah, Sumatra, Indonesia, menurunkan total biomasa permukaan atas tanah dan berdampak negatif terhadap siklus nutrien. Sebagian besar hutan hujan tropis di provinsi Jambi telah dikonversi menjadi sistem agroforestri karet atau hutan karet. Transformasi ini dapat mengubah komponen dan fungsi hutan alam. Dampak perubahan konversi ini terhadap stok C dan N kayu mati masih kurang dipahami.
Penelitian ini bertujuan untuk menguji perbedaan massa, stok C, N dan lignin kayu mati antara sistem hutan alam dan hutan karet, dan menguji perbedaan konsentrasi kandungan kimia dan kelimpahan stok nutrien tersebut pada tiga tahap pelapukan kayu mati. Penelitian ini bertujuan menganalisis kontribusi kayu mati pada berbagai tingkat pelapukan terhadap total stok C dan N di hutan hujan tropis Indonesia.
Penelitian dilakukan di hutan alam dan hutan karet dataran rendah tropis Propinsi Jambi, Sumatra. Pengambilan sampel kayu mati dilakukan dengan metode non-destructive dalam plot permanen berukuran 2500 m2 (50 m x 50 m) dengan total plot sebanyak enam belas (delapan replikasi setiap penggunaan lahan: empat plot di lokasi daerah Harapan, kabupaten Muara Bulian, dan empat plot di lokasi Taman Nasional Bukit Duabelas (TNBD), kabupaten Sarolangun). Tegakan kayu mati yang dijadikan sampel memiliki diameter pohon setinggi dada (dbh) ≥ 10 cm dan tinggi ≥ 1.5 m, sedangkan untuk kayu mati tumbang memiliki diameter tengah ≥ 10 cm dan panjang ≥ 1 m.
Pelapukan kayu mati secara visual diidentifikasi berdasarkan indikator fisik yang merefleksikan kerusakan kayu dan diklasifikasikan ke dalam tiga tingkat pelapukan. Massa kayu mati diestimasi menggunakan persamaan alometrik. Untuk setiap tingkat pelapukan, sebanyak 48 sampel diseleksi secara acak untuk analisis kandungan kimianya. Konsentrasi C organik, N total dan lignin berturut-turut diukur menggunakan metode Walkley and Black, Kjeldahl dan Van Soet. Pengaruh sistem pemanfaatan lahan terhadap variabel yang diuji (massa, volume dan stok C, N dan lignin dalam kayu mati), juga pengaruh sistem di setiap tingkat pelapukan dibandingkan menggunakan Independent Sample t-test. Analisis varians (ANOVA), One-Way dengan post-hoc Tukey HSD test digunakan untuk menguji pengaruh tingkat pelapukan terhadap variabel stok dan konsentrasi nutrien. Analisis komponen utama (PCA) terhadap variabel yang diuji pada tiga
tingkat pelapukan di lokasi penelitian dilakukan menggunakan paket CANOCO, versi 4.5.
juga lebih tinggi dibandingkan di hutan karet. Nilai biomassa di atas permukaan tanah (AGBliving) dan produktivitas primer bersih (NPPwood) yang tinggi di hutan
alam dapat menjadi alasan penyebab tingginya massa kayu mati, hal ini berkaitan dengan kapasitas kayu mati untuk menyimpan C dan N. Nutrien dalam jumlah besar yang tersimpan dalam kayu mati di lantai hutan alam menyediakan pengembalian sumber nutrien besar ke tanah.
Konsentrasi rasio C/N menurun dan konsentrasi N meningkat seiring dengan peningkatan pelapukan kayu, sedangkan konsentrasi C dan lignin bervariasi antar tahap pelapukan. Kelimpahan massa kayu mati, stok C dan lignin lebih banyak ditemukan pada tingkat pelapukan awal dibandingkan pelapukan lanjut. Hal ini mengindikasikan bahwa pelapukan kayu mati berlangsung lambat. Stok lignin yang tinggi di hutan alam menyediakan sumber stok C diharapkan memberikan kontribusi sebagai penyimpan nutrien jangka panjang bagi regenerasi pepohonan. Input kayu mati yang tinggi di hutan alam mengindikasikan pentingnya fungsi pelapukan kayu mati di hutan alam dibandingkan di hutan karet.
Faktor penting yang membedakan tingkat pelapukan kayu mati di hutan karet adalah konsentrasi C dan N dalam kayu mati, rasio C/N dan berat jenis kayu. Sedangkan stok C, N dan lignin dalam kayu mati di hutan alam merupakan faktor penting yang mempengaruhi tingkat pelapukan kayu mati.
Penelitian ini menunjukkan bahwa mengganti hutan alam dengan hutan karet mereduksi total stok C dan N yang memberikan dampak negatif terhadap pengembalian dan siklus nutrien dalam ekosistem. Massa kayu mati yang rendah di hutan karet mengakibatkan perubahan keberlanjutan simpanan C dan N jangka panjang.
SUMMARY
SELIS MERIEM. Carbon and Nitrogen Stocks of Different Dead Wood Decay Stages in Natural and Converted Tropical Lowland Forests (Jambi, Indonesia). Supervised by TRIADIATI and SOEKISMAN TJITROSOEDIRJO.
Dead wood plays a significant role as an integrity of forests, serves large nutrient source and habitat for decomposers and other forest biota. Rapid transformation of natural forests into other land-use systems in the lowlands of Sumatra, Indonesia, strongly reduces total aboveground biomass and negatively affects nutrient cycling. Most natural rainforests in Jambi province have often been converted into rubber agroforestry systems called 'jungle rubber'. This transformation is likely to change natural forest structure and its function. The consequences of this conversion for C and N stocks of dead wood contribution remains poorly understood.
This study aimed to examine differences in mass, stocks of C, N and lignin stored in dead wood between systems, and concentrations of these chemical contents and stocks of three decay stages of dead wood. This reseach aimed to analyzed the contribution of dead wood in each decay stages to total C and N stocks in Indonesia tropical rainforests.
The research was conducted in natural forest and jungle rubber in the tropical lowlands of Jambi province, Sumatra. Dead wood inventory was carried out in a non-destructive way within permanent plots of 2500 m2 (50 m x 50 m) in a total sixteen plots (eight replicates per land-use system: four were located within Harapan region, Muara Bulian regency, and four were located in the Bukit Duabelas National Park (TNBD), Sarolangun regency). Standing dead wood which recorded had diameter at breast height (dbh) ≥ 10 cm and height ≥ 1.5 m, while fallen dead wood which had diameters ≥ 10 cm at the midpoint.
Decay wood was visually identified based on physical indicators reflecting wood breakage and classified into three decay stages. Mass of dead wood was estimated using allometric equation. For each decay stage, 48 representative samples were selected randomly to analyse their chemical properties. Organic C, total N and lignin were measured using methods of Walkley and Black, Kjeldahl and Van Soet, respectively. The effect of land-use system on tested variables (mass, volume and stocks of C, N and lignin in dead wood), as well as in each decay stage, were compared using Independent Sample t-test. Analyses of variance (ANOVA), One-Way with post-hoc Tukey HSD test were used to determine the influence of decay stages on tested variables. A principal component analyses (PCA) of tested variables of the three different decay stages in study sites was conducted with the package CANOCO, version 4.5.
wood mass, bearing its capacity to store C and N. Large nutrient stored in dead wood on the forest floor provide large nutrient turnover to the soil.
Concentrations of C/N ratio were found to decrease and N concentrations to increase with advancing wood decay, while concentrations of C and lignin varied among decay stages of wood. The abundance of dead wood mass and stocks of C and lignin were found to be higher in the early decay than those in the advanced decay stage. This indicated that dead wood was slowly decayed. High lignin stocks in natural forests served as C stock source expected to contribute as a long-term nutrient storage for regenerating trees. Higher input of dead wood in natural forest indicated a higher importance of dead wood decay in natural forests than in jungle rubber systems.
The crucial factors separating the three dead wood decay stages in jungle rubber plots were concentrations of C, N, and C/N ratio as well as live wood density. Whereas stocks of C, N and lignin in natural forest were important factors affecting decay stages of dead wood.
The current study implies that replacing natural forest with jungle rubber strongly reduces total C and N stocks which have a marked negative effect on the ecosystems' nutrient turnover and cyle. Reduced dead wood mass in jungle rubber impacts changes of long-term C and N sustainability.
© All Rights Reserved IPB, the Year 2016
Copyright
Reserved
Quote some or all of this paper is prohibited without including or citing the sources. Quoting is only for educational purposes, research, scientific writing, report writing, criticsm writing, or review of an issue; and citations are not detrimental on behalf to IPB
Thesis
as one of the requirements to obtain degree Master of Science
at
Department of Plant Biology
CARBON AND NITROGEN STOCKS OF DIFFERENT DEAD WOOD
DECAY STAGES IN NATURAL AND CONVERTED TROPICAL
LOWLAND FORESTS (JAMBI, INDONESIA)
GRADUATE SCHOOL
BOGOR AGRICULTURE UNIVERSITY BOGOR
2016
FOREWORD
Praise and gratitude to Allah subhanahu wa ta’ala for all of His gifts so this thesis has been completed. Theme of this research was Dead Wood entitled Carbon and Nitrogen Stocks of Different Dead Wood Decay Stages in Natural and Converted Tropical Lowland Forests (Jambi, Indonesia).
I would like to say great thanks to Dr Dra Triadiati, MSi and Soekisman Tjitrosoedirdjo, PhD as supervisor commission in this thesis research for advice, time and idea during research and thesis writing. Big thanks also to Dr Ir Sulistijorini, MSi as examiner beyond commission on the examination. This research was fully funded by Deutsche Forschungsgemeinschaft (DFG) in the framework of the collaborative German - Indonesian research project CRC990 on behalf of Dr Dra Triadiati, MSi and academic scholarship from Directorate of Higher Education of Indonesia on Interior Graduate Education Scholarship (BPPDN) Candidate Lecturer 2013. I also thank to Dr rer nat Martyna M Kotowska and Dr Dietrich Hertel from University of Göttingen, Germany, as counterparts in this research for advice in writing. I thank to village leaders, local plot owners, PT REKI, Bukit Duabelas National Park as well as counterparts.
During college and research, I gratefully thanks to Budirman, Sitti Khomariyah, my brothers and big family for pray and supports. I also thank to Plant Biology Study Program, students batch 2013 especially for Plant Physiology division who have support during the research.
I wished this research can be beneficial for the knowledge development in the future.
TABLE OF CONTENTS
LIST OF TABLES iv
LIST OF FIGURES iv
LIST OF APPENDIX iv
1 INTRODUCTION 1
Background 1
Research Goals 2
2 LITERATURES 2
Dead Wood 2
Decay of Dead Wood 4
Carbon, Nitrogen and Lignin in Dead Wood 4
Forest Land-use Change into Jungle Rubber 6
Effects of Forest Conversion to Dead Wood Contribution 6
3 METHODS 7
Study Sites 7
Dead Wood Inventory 9 Estimation of Dead Wood Mass 10 Analyses of Organic Carbon, Total Nitrogen and Lignin 11 Statistical Analyses 11 4 RESULTS AND DISCUSSION 12
Results 12
Discussions 17
5 CONCLUSIONS AND SUGGESTIONS 20
Conclusions 20
Suggestions 20
REFERENCES 20 APPENDIXES 25
LIST OF TABLES
1 Allometric equations of aboveground biomass 3
2 The main difference between organic and anorganic compounds 5 3 Sampling location and geographic sites of study sites 8
4 Classification of dead wood decay stages 10
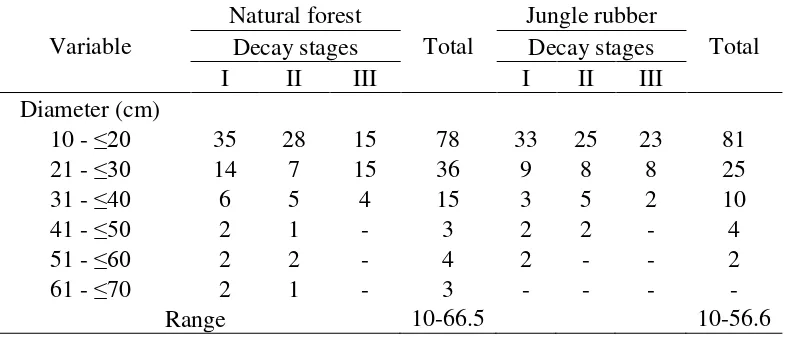
5 Distribution of diameter of dead wood pieces in each wood decay stage
in natural forest and jungle rubber 12
6 Distribution of height/length of dead wood pieces in each wood decay
stage in natural forest and jungle rubber 13
7 Comparison of mass, volume, stocks of C, N and lignin of dead wood for each decay stage between natural forest and jungle rubber 14 8 Results from Principal component analysis (PCA) of C, N and lignin
concentration as well as the C, N, and lignin stocks, and the ratio of C stock in dead wood to total of the three decay stages in the two land-use
systems 17
LIST OF FIGURES
1 Profiles of natural forests and jungle rubber in lowland regions of Jambi
Province 7
2 Map of study sites in Harapan Forest of two ecosystems from jungle
rubber and natural forests 8
3 Map of study sites in Bukit Dua Belas National Park of two ecosystems
from forests and jungle rubber 9
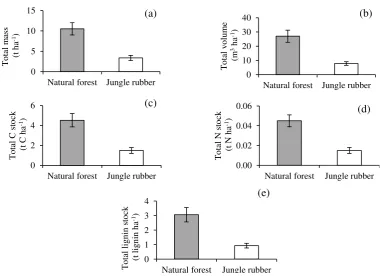
4 Permanent plot of experimental area 10
5 Effect of land-use systems on total total mass, volume, carbon stock, nitrogen stock, and lignin stock of dead wood 13 6 Effect of wood decay stages on concentrations of nitrogen and C/N
ratio in dead wood for each decay stage 14
7 Effect of wood decay stages on concentrations of carbon and lignin in
dead wood for each decay stage 15
8 Effect of wood decay stages on mass, volume, carbon stock, nitrogen
stock, and lignin stock of dead wood 15
9 PCA of C, N, and lignin concentration as well as the C, N, and lignin stocks, and the ratio of C stock in dead wood to total of the three decay
stages in the two land-use systems 16
LIST OF APPENDIXES
1 Data of total mass, volume, stocks of C, N and lignin, and chemical
concentrations of C, N, C:N and lignin 26
1
1
INTRODUCTION
Background
Dead wood has been recognized to have an important ecological function as a resource for the ecosystem and structural components of forests (Harmon et al. 1986). A high abundance of dead wood on the forest floor maintains a high biodiversity of species such as saproxylic beetles (Floren et al. 2014) and fungi community which composition depends on the stage of decay of the dead wood (Kebli et al. 2012; Blaser et al. 2013). Enhancing dead wood amounts was expected to increase the habitat for forest biota. Dead wood also contributes a significant proportion to the total C stocks of aboveground wood mass (Pfeifer et al. 2015). This input serves as an important source to the nutrient flux to soil and consequentially affects the forest nutrient cycle. Carbon sequestered in dead wood biomass effluxes through decomposition processes, thus dead wood plays a crucial role in global C cycling as well (Chambers et al. 2000). Dead wood not only stores C retention as a fraction of total above-ground carbon pool, but also contributes to soil C sequestration (Pan et al. 2011).
Vegetation in forests without fertilizer inputs depend on available nutrients released from decomposition of dead organic matter including litter and woody debris. Dead wood not only composes active soil organic matter serving nutrient reservoirs for plant, but C and N stored in dead wood are also rapidly utilized by soil decomposer as main energy source for growth (Boddy & Watkinson 1995; Lambers et al. 2008). Dead wood sequesters a large amount not only of C but also of nutrients, but decomposes at a lower rate than fine litter (Harmon & Hua 1991) and has been reported to slowly release N to soil (Hafner & Groffman 2005). Despite the low rate of decomposition, dead wood can be assumed to persist as C and N long-term storage form which makes it an important contribution to C and N cycles (Laiho & Prescott 1999). The C stock source in dead wood is predominantly derived from lignin compounds (Austin & Ballaré 2010). The lignin in dead wood consists of recalcitrant complex polymers considered as the inhibition factor for microorganism to decompose; thus causing the low decay rate and remaining long-term on the forest floor (Vanholme et al. 2010). Based on the crucial role of lignin in controlling C release, further studies on lignin stock in dead wood are highly required.
2
nutrients, neglecting to measure dead wood mass makes the estimate of nutrients returned to the soil remain inadequate.
The ecological functions of dead wood have been studied extensively in temperate as well as in tropical forests (Aakala 2010; Palviainen et al. 2010; Yang et al. 2010). The mean stocks of dead wood C across tropical forests accounted for 17.5 t C ha-1 (Pregitzer & Euskirchen 2004). Dead wood contributes 16.6 t ha-1 and 11% carbon stock of the world‘s forests (FAO 2010). In contrast with large C storages, there was a decrease of the C stocks of dead wood since 1990-2010 as reported by FAO (2010) which was mainly driven by a reduced forest area. Deforestation of tropical forests in Indonesia occurs at a higher rate than natural forest cover loss in other tropical areas (Margono et al. 2014). Particularly lowland tropical rainforests in Jambi, Sumatra, have lost 78 % of forest cover by land-use changes since 1985–2008 which turns them into critically endangered ecosystems (WWF 2010). Many native tree species in the natural forests of Jambi (Indonesia) have been logged and replaced with rubber trees, since rubber latex is of high economic value for the communities (Gouyon et al. 1993). Natural forest transformed into other land-use forms is likely to change forest structure and its function. These changes probably alter dead wood contribution in the ecosystem. While recently most rubber land-use systems represent intensively managed monocultures, in earlier times natural rainforests have often been converted into rubber agroforestry systems containing a tree cover of natural tree species called 'jungle rubber'. Nevertheless, the effects of transformation of natural forest to jungle rubber on C and N stocks of dead wood are not investigated yet.
Research Goals
Based on the crucial role of dead wood contribution to nutrient cycle, this study aims (1) to compare the total mass, stocks of C and N in dead wood between natural forest and jungle rubber, (2) to assess the nutrient concentrations in each decay stage of wood, and (3) to investigate the effect of decay stages on mass, volume, and nutrient stocks in dead wood mass. Our overarching goal is to obtain a basic and new idea of dead wood contribution to total C and N stocks in Indonesia tropical lowland rainforests.
2
LITERATURES
Dead Wood
3 soil i.e., dead roots with large diameter ≥ 10 cm. Based on these definitions, dead wood can be classified as structural components of above- and below ground.
Input source of dead wood in terrestrial land is driven by natural mortalitiy and human disturbance. Naturally, input of dead wood is caused by extrinsic factors (wind, fire, insects, disease and competition) and intrinsic factors (Harmon et al. 1986). Wind can knock down single or small clusters of trees to be fragmented parts. Extreme fires burn stems, crowns and even root systems. Basal wounds of trees allow penetration of microorganisms to weaken the wood structure. Although there are some survivals, but weaken structure of wood causes those trees to be more susceptible to windthrow. Insect is another factor contributing input of standing dead trees by attacking nutrient flows which rich in phloem. Logging residues left on the forest floor is an input source of dead wood (Köhl et al. 2008). Further, forest management determines its abundance.
Dead wood contribute to total aboveground biomass estimations since it composes a structural component in ecosystem. Mass estimation of dead wood is crucial especially to observe the impact of changes in forest functions. Generally, mass of dead wood can be estimated using destructive or non-destructive methods (Vashum & Jayakumar 2012). The destructive method, harvesting, were rarely used because this consume inventory time and expensive, need rehabilitation process and is not recommended for degraded forest with rare or protected species and small area. The non-destructive method is more adapted and aplicable because it just takes a little part as a sample to calculate its dry mass. The non-destructive method uses allometric equations to estimate biomass.
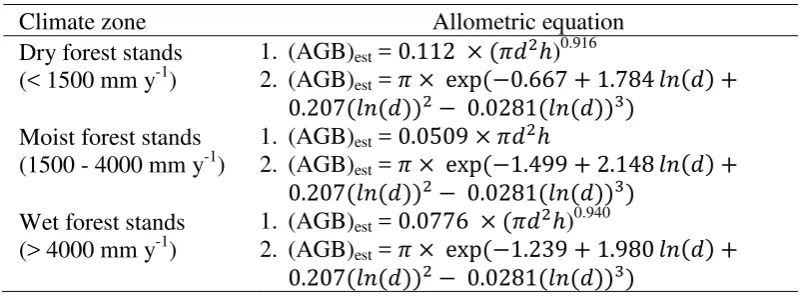
The importance parameter predictors to estimate biomass are diameter, wood density, lenght or height and forest type. Chave et al. (2005) provided reliable prediction of aboveground biomass allometric equation (AGBest) based on climate zone (dry, moist and wet) for lowland tropical forests (Table 1). Mass of dead wood was estimated by using live tree allometric equations (Kauffman & Donato 2012). The difference is substracting with 2.5% of leave estimation for early decay and 10-20% of both leave and branches estimation for intermediate decay. As decay proceed results in high breakage, it is difficult to substract from live tree biomass. Thus, advanced decay of wood was estimated by approaching cylinder volume multiplied with wood density (Hairiah et al. 2011).
Table 1 Allometric equations of aboveground biomass (AGB) (Chave et al. 2005)
4 microbe immobilizes N from environment to meet their N demand (Lambers et al. 2008). Decay status of wood depends on (1) biotic factors such as wood quality (structure and chemical properties), tree species, wood dimensions (diameter, length or height), wood density and decomposer activities (driver of transformation process), and (2) abiotic factors or environmental factors such as air temperature and moisture. Other factors of leaching, fragmentation, content of dead wood with the ground also influence on decay process (Harmon et al. 1986). Wood structure is distinguised into hard wood layer located near to pith and soft wood layer near to bark. In live tree starch deposit in soft wood may be reconverted to glucose for plant growth, but when the tree is dead wood-storage starch is retained as permanent deposit in wood cells (Bamber 1987). Not only starch, other soluble materials of sugars, amino acids, and proteins in sapwood are highly invaded by most fungi and bacteria attacks that are able to degrade. Hard wood provides component of structural support containing polymers-cellulose, hemicelluloses and lignin. These compounds can be degraded only by decomposers that able to decompose these structurally complicated high-polymeric materials. Other secondary metabolite products also deposited in hard wood such as polyphenol, terpenes, alkaloids that toxic for decomposers (Kirk & Cowling 1984).
Low decay of dead wood would take over a long term studies. Tus, physical characteristics of dead wood is the most common approach to assess decay status. Visual assessment indicators to determine decay stage are (1) bark, (2) branches and twigs, (3) bole shape, (4) structural integrity, (5) color of wood, (6) portion of log on ground, (7) root invation and (8) vegetation growing (mosses, shrubs, seedlings) (Yan et al. 2006). Tobin et al. (2007) used five stage to determine decay status but there were no significant difference in mean densities between stages 2 and 3 and between stages 4 and 5, thus combining two similar value was possible to decrease numbers of decay stages. According to those, in this study three decay stage classification (no decay, moderate decay and advanced decay) is convenient to adapt.
Carbon, Nitrogen and Lignin in Dead Wood
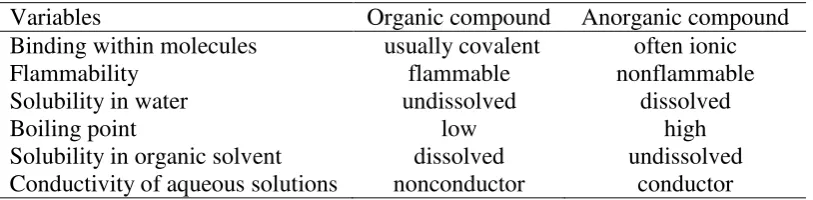
5 Inorganic compounds is defined as compounds without C–H bound. The difference between organic and anorganic compounds are showed in Table 2 (Neuman 1999).
Table 2 The main difference between organic and anorganic compounds
Variables Organic compound Anorganic compound
Binding within molecules usually covalent often ionic
Flammability flammable nonflammable
Solubility in water undissolved dissolved
Boiling point low high
Solubility in organic solvent dissolved undissolved Conductivity of aqueous solutions nonconductor conductor
Dead wood acts as storage of C and N since it able to store them in wood compartments. Carbon accounts 45% in dry matter and is stored as component of most compounds due to its binding with dissolved water compounds such as cellulose, hemicellulose and with undissolved compounds such as lignin and other secondary metabolites. Woody plants contain 0.03–0.10% of N and stored in wood compartments as (1) protein in the cell cytoplasm, (2) Peptide, amino acid, lypoprotein that most accumulate near pith or sapwood, (3) compounds containing N: secondary metabolite accumulate in the heartwood, and (4) structural N as components of primary cell wall: hydroxyprolin-rich protein, proline-rich protein and glycine-rich protein, arabinogalactan protein, (5) structural N as components of secondary cell wall: structural N bounded to lignin (Taiz & Zeiger 2010).
Lignin is a secondary growth of dicotyledonae plants and composed of cell secondary xilem that form wood (Campbell & Sederoff 1996). Lignin is phenol polymer consisted of one or more than monolignols such as coniferyl, coumaryl and sinapyl alkohol (Taiz & Zeiger 2010). Those lignol monomers bind each other to constitute phenylpropanoid. Lignin compositions between Angiosperms (dominant of syringyl) and Gymnosperms (dominant of guaiacyl) are differ due to biosynthesis pathway Binds of branching C-C and C-O-C on structure of phenylpropanoid cause the complex lignin compounds are resistant to degradations (Campbell & Sederoff 1996).
Dead wood acts as a function of organic fertilizer in nutrient cycle and contribute to soil organic matter. Soluble compound of dead wood is mineralized into anorganic ions. This compound is dissolved matter in water such as cellulose, starch and protein, and susceptible to decomposer attacks. Whereas complex compound of dead wood composes the humus components by humification process. This compound is undissolved matter in water and resistant to micobial attack such as lignin, resin, oil and fatty acid (Coleman et al. 2004).
6
of C thereby decrease C/N ratio. Toward decay process, organic storage in dead wood mass is lessen.
Forest Land-use Change into Jungle Rubber
Primary forests are defined as forest composed of native species with no indication of past or recent human activities (FAO 2010). Natural forests in this study are defined as primary forest, the remaining human activities. Land-use refers to change land cover due to human intervention. Converted or deforestated forest is removing forest cover with direct human activities into other land use forms without regenerating purpose (IPCC 2000). Forest covers were reduced by
other land-use forms in the world since 1990. Asia lost more than 2.2 million ha
of forest cover per year. This change was high in the tropical forest. Indonesia accounted for 94 million ha forest in 2010 and increased in loss remaining 91 million ha forest in 2015 from the large forest area among ten countries i.e., Russian Federation, Brazil, Canada, United States of America, China, Democratic Republic of the Congo, Australia, Sudan, and India (FAO 2010, FAO 2015). However, Indonesia was the second large net loss of forest amounted to 684 thousand ha in the world after Brazil in the period of 2010-2015 (FAO 2015).
Asia largely had a decreased primary forest which 20% of total forest area replaced by planted forests. Rubber plantation is planted mainly in Southest Asia of which Indonesia had more than 10 million ha of that. These land-use greatly
increased in the period of 1990–2010 (FAO 2010). Rubber seeds had been
introduced to Indonesia from Malaysia in the early 1910s. This plant is intentionally planted in the forest fallows ―jungle rubber‖ since it promise of high incomes and can grow on the low soil fertility (Gouyon et al. 1993). In case, characteristics of forest according to FAO (2010) jungle rubber is categorized as a deforestated with planted forest.
The effect of converting natural forest into planted forest i.e., jungle rubber will change structure and function of forest. Forest mainly acts a source and sink of C. Such changes induced unbalanced C cycle due to removal forest component affecting C stock. Even conversion of natural forests to planted forests with fast-growing species rapid C fixing, this changes do not decrease the accumulation of CO2 in the atmosphere but reduce C storage (Harmon et al. 1990).
Effects of Forest Conversion to Dead Wood Contribution
7 The importance of measuring dead wood is emphazised by other studies since it can store C. Carbon in dead wood is a significant C reservoir since it contributes to estimating C pool (IPCC 2000). FAO (2010) reported that dead wood in South and Southest Asia contributed 20.3 t ha-1 in biomass and 3.6 t C ha-1. These were decreased in the period of 1990–2010 which mainly driven by decrease C stock as a result of decrease forest area. However, data of dead wood estimate were less reported from other countries (Köhl et al. 2015). Thus, C stock of dead wood is important to be measured. The logging residue remaining in forest floor is a source of dead wood. However, when dead woods are removed from the forest, it will reduce total C stock.
The conversion of natural forests into other land-use forms reducing C stock of dead wood, subsequently reduces nutrient reservoirs in ecosystem. Furthermore, it affects the sustainability and cycles of nutrient (Harmon & Hua 1991) and changes wood-associated species diversity (Jonsson et al. 2005).
3 METHODS
Study Sites
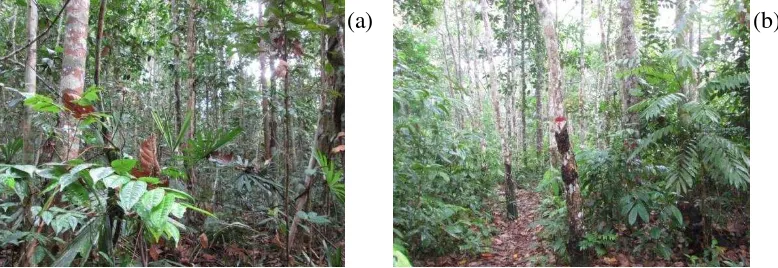
The research was conducted in natural forest (Figure 1a) and jungle rubber land-use systems (Figure 1b) in the tropical lowlands (51–95 m above sea level) of Jambi province, Sumatra (Table 3). We investigated eight 50 m x 50 m plots of which four were located within Harapan region, Muara Bulian regency (Figure 2) and four were located in the Bukit Duabelas National Park (TNBD), Sarolangun regency (Figure 3).
Figure 1 Profiles of natural forest (a) and jungle rubber (b) in lowland regions of Jambi Province
The climate is tropical humid (2374 mm yr-1) with a mean annual air temperature of 26.9°C and mean relative humidity of 86% (climate data from Jambi climate station (Stasiun Klimatologi Jambi: N 1°62.1‘, E 103°53.1‘). The natural forest was degraded primary forest with selective logging in the past. The jungle rubber system was a rubber agroforest with natural tree cover where forest trees were logged and rubber trees planted in the gaps between 1973 and 2006. Canopy cover and total basal area in the natural forest were 92.1 ± 0.5% and 30.1
8
± 0.9 m2 ha-1, respectively, whereas in the jungle rubber the numbers were 87.6 ± 0.8% and 18.3 ± 1.1 m2 ha-1, respectively (Kotowska et al. 2015).
Concentrations of C and N were analyzed in SEAMEO BIOTROP, and lignin concentration was analyzed in Feed Science and Technology laboratory, Nutrition and Feed Technology Department, IPB.
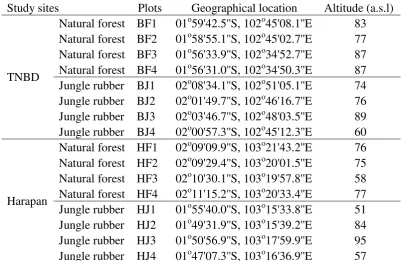
Tabel 3 Sampling location of study sites. In TNBD site, 'BF' refers to natural forest and 'BJ' refers to jungle rubber. In Harapan site, 'HF' refers to natural forest and 'HJ' refers to jungle rubber.
Study sites Plots Geographical location Altitude (a.s.l)
TNBD
Natural forest BF1 01o59'42.5''S, 102o45'08.1''E 83 Natural forest BF2 01o58'55.1''S, 102o45'02.7''E 77 Natural forest BF3 01o56'33.9''S, 102o34'52.7''E 87 Natural forest BF4 01o56'31.0''S, 102o34'50.3''E 87 Jungle rubber BJ1 02o08'34.1''S, 102o51'05.1''E 74 Jungle rubber BJ2 02o01'49.7''S, 102o46'16.7''E 76 Jungle rubber BJ3 02o03'46.7''S, 102o48'03.5''E 89 Jungle rubber BJ4 02o00'57.3''S, 102o45'12.3''E 60
Harapan
Natural forest HF1 02o09'09.9''S, 103o21'43.2''E 76 Natural forest HF2 02o09'29.4''S, 103o20'01.5''E 75 Natural forest HF3 02o10'30.1''S, 103o19'57.8''E 58 Natural forest HF4 02o11'15.2''S, 103o20'33.4''E 77 Jungle rubber HJ1 01o55'40.0''S, 103o15'33.8''E 51 Jungle rubber HJ2 01o49'31.9''S, 103o15'39.2''E 84 Jungle rubber HJ3 01o50'56.9''S, 103o17'59.9''E 95 Jungle rubber HJ4 01o47'07.3''S, 103o16'36.9''E 57
9
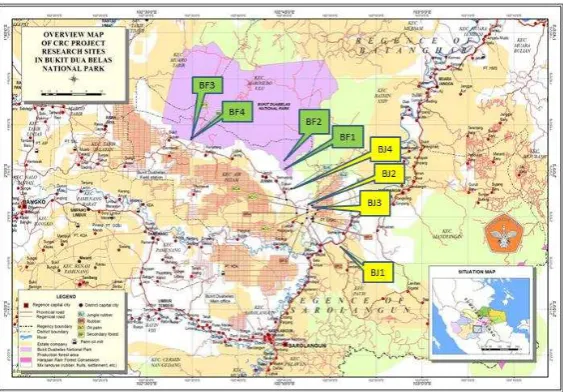
Figure 3 Map of study sites in Bukit Dua Belas National Park (TNBD) of two ecosystems from forests; BF1, BF2, BF3, BF4 (green, at top) and jungle rubber; BJ1, BJ2, BJ3, BJ4 (yellow, at base) (CRC990 EFForTS 2014)
Dead Wood Inventory
The sampling method was carried out in a non-destructive way. Dead wood i.e. standing and fallen dead wood pieces were monitored within permanent plots of 2500 m2 (50 m x 50 m) (Figure 4) in a total of sixteen plots (eight replicates per land-use system). The size standing dead wood (dbh ≥ 10 cm, height ≥ 1.5 m) and fallen dead wood (diameters ≥ 10 cm at the midpoint, length ≥ 1 m) were measured. Dead wood diameter was measured using a dendrometer tape (UMS, Munchen, Germany), height of standing dead wood measured using a Vertex III height meter (Haglof, Langsele, Sweden), and length of fallen dead wood measured using a meter tape. Wood density (ρ) was measured using Pilodyn 6J wood tester (PROCEQ SA, Zürich, Switzerland). The penetration depth (h) of the pin was converted using a calibration equation derived by Kotowska et al. (2015) (Equation 1), based on 204 trees which wood core samples were analyzed.
10
Figure 4 Permanent plot of experimental area (50 m x 50 m). Letters of the alphabet and Roman numerals indicate the boundary points between sub-plots AA23-BC01-BC23) and the edge of the plot (AA01-JJ01, JJ01-JJ10, JJ10-AA10, AA10-AA01). This boundary markers facilitate the sampling direction and ensured that are not repeated of recorded samples in the same subplot.
Decay wood was qualitatively identified based on physical indicators according to Grove (2001) and classified into one of three stages: (I) early decay, (II) intermediate decay, and (III) advanced decay (Table 4). Sampling point on the fallen dead wood referred to Pyle and Brown (1999) method which had one of the dominant decay stage criteria i.e. more than 50% while sample of standing dead wood was taken at dbh 1.5 m.
Table 4 Classification of dead wood decay stages (Grove 2001) Decay stages of wood Indicators
I (early decay) Intact bark, loss of leaves, retaining wood integrity II (intermediate decay) Less intact bark, slight rot wood structure but still
supporting mechanically, partially invaded root III (advanced decay) Loose bark, no longer retains original shape, largely
disintegrated, spreading invaded root
Estimation of Dead Wood Mass
11 and multiplied by wood density (Equation 5) (Hairiah et al. 2011). The value of the mass measurements (kg) were converted in tonnes per hectare. Volume of dead wood was measured by dividing wood mass with its density (Equation 6). The parameters which were used in the formula were wood density (ρ, g cm-3), diameter (d, cm) and height or length (h, m).
Analyses of Organic Carbon, Total Nitrogen and Lignin
In total, 261 pieces of dead wood were extracted and cut into smaller pieces; cleaned from roots, soil, mosses, fungi, and insects; samples were then dried at 80°C to a constant weight then ground. For each decay stage, 48 representative samples were selected randomly to analyse their chemical properties.
Organic C was measured using Walkley and Black method following boiled of 0.1 g (dried weight) sampel at 90°C for 2 h in 10 ml of K2Cr2O7 2 N and 7.5 ml of H2SO4 p.a., diluted with aquadest up to 100 ml, pipetted 10 ml and added with 3 drops of ferroin, and titrated with 0.2 N FeSO4.
Total N was measured using the Kjeldahl method following destruction of 0.1 g sample by heated at 340°C for 45 m in 5 ml H2SO4 and 0.2 selenium then diluted with 50 ml aquadest, destilation with NaOH 40% for 3½ m and fixation of vapour NH3 in solution of 3 drops conway and 10 ml boric acid, and titration with 0.02 N HCl. The C/N ratio was determined by dividing total C by total N.
Lignin content was measured using Van Soet method after analyzed ADF (Acid Detergent Fiber) content which represented undissolved cell wall compartment in CTAB soulution (Cetyl Trimethyl Ammonium Bromide). One g sample was extracted for 1 h in 100 ml ADS solution (Acid Detergent Solution) which made by dissolved 20 g CTAB and 27.5 ml H2SO4 1 N in 1 L aquadest, filtrated through sintered glass plate, rinsed residue with hot water and acetone, and dried at 105°C for ± 4 h. The residue was burned at ± 600°C for lignin content.
Stocks of C, N, and lignin were calculated by multiplying the mass (t ha-1) of each compartment by its respective mean chemical concentration (%) for each decay stage.
Statistical Analyses
12
hardwood remained after recent conversion from natural forest. The excluded forest plot showed a small number and biomass of dead wood which indicated distinct differences compared to all other forest sites. In case, data analyses were tested using square root transformation value of (x + 1)1/2.
The effect of land-use system on parameters (mass, volume and stocks of C, N and lignin in dead wood), as well as in each decay stage, were compared using Independent Sample t-test. Analyses of variance (ANOVA), One-Way with post-hoc Tukey HSD test were used to determine the influence of decay stages on these parameters and on the nutrient concentrations of C, N, C/N ratio and lignin. All analyses were conducted using SPSS version 19 with statistical significance established at α = 5% level. A principal component analyses (PCA) of chemical, anatomical dead wood properties and chemical stand stocks in of the three different decay stages in the two different land-use systems was conducted with the package CANOCO, version 4.5 (Biometris, Wageningen, The Netherlands).
4
RESULTS AND DISCUSSION
Results
Dead wood in natural forest had larger total diameter and lenght of wood than those in jungle rubber (Table 5 and Table 6). In natural forest there was dead wood piece with maximum diameter of 66.5 cm and length of 46 m. While there was no dead wood with diameter more than 57 cm and height more than 28 m in jungle rubber. The early decay of dead wood were found more abundant than other stages in natural forest and jungle rubber. In advanced wood decay stage, there were no large dead wood with diameter more than 40 cm in both systems. Table 5 Distribution of diameter of dead wood pieces in each wood decay stage in
13 Table 6 Distribution of height/length of dead wood pieces in each wood decay
stage in natural forest and jungle rubber
14
Each decay stage of dead wood had different mass, volume, and stocks of C, N, and lignin that differed as well as between natural forest and jungle rubber (Table 7). These variables were significantly higher for decay stage I in the natural forest compared to the jungle rubber (p < 0.05) as well as for decay stage III (p < 0.05), while there was no significant difference between the two systems for decay stage II (p > 0.05) (Table 7).
Table 7 Comparison of mass, volume, stocks of C, N and lignin of dead wood for each decay stage between natural forest and jungle rubber
Variables Decay stages concentration and C/N ratio in dead wood (p < 0.05). Figure 6a shows that the N concentration in decay stage III was significantly the highest among the decay stages (p < 0.05), whereas the C/N ratio in the decay stage III was significantly the lowest among the decay stages (p < 0.05) (Figure 6b). However, there were no significant effects of dead wood decay stages on C and lignin concentrations (p > 0.05) (Figure 7a and 7b).
Figure 6 Effect of wood decay stages on concentrations of nitrogen (a) and C/N ratio in dead wood for each decay stage. Bars represent mean ± SE.
15
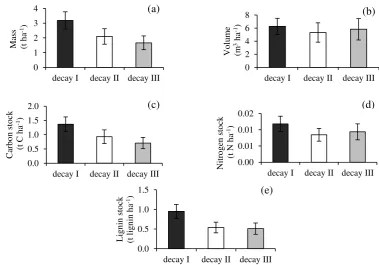
Figure 7 Effect of wood decay stages on concentrations of carbon (a) and lignin (b) in dead wood for each decay stage. Bars represent mean ± SE. Nutrient stocks of dead wood in each decay stage represented the value from both systems. Dead wood mass and stocks of C, and lignin were significantly influenced by the decay stage of wood (p < 0.05) (Figure 8), while no significant effects were found in volume of dead wood and N stock (p > 0.05) (Figure 8) The mass and stocks of C and lignin of dead wood were significantly higher in the decay stage I than the decay stage III (Figure 8). These variables decreased with advancing wood decay stages.
Figure 8 Effect of wood decay stages on mass (a), volume (b), carbon stock (c), nitrogen stock (d) and lignin stock (c) of dead wood. Bars represent mean ± SE.
16
chemical dead wood properties (but not lignin content), and live stem wood density (Figure 9, Table 8). Therefore, dead wood C and N content, and C/N ratio as well as live wood density are the crucial factors separating the three dead wood decay stages in jungle rubber plots, but not in natural forest plots (Figure 10). C, N and lignin stocks are partly associated with axis #1 as well, but were even more strongly correlated with axis #2. Lignin content was closest associated with the axis #3 and was explanatory for the separation of the three decay stages in the natural forest plots.
Figure 9 Principal component analysis (PCA) of C, N, and lignin concentration as well as the C, N, and lignin stocks, and the ratio of C stock in dead wood to total (live and dead above-ground C stock) of the three decay stages in the two land-use systems. 'NF' refers to the natural forest plots, 'JR' refers to the jungle rubber plots. 'd1' (decay I), 'd2' (decay II), 'd3' (decay III) specifies the three different dead wood decay stages.
17 Table 8 Results from PCA of C, N and lignin concentration as well as the C, N, and lignin stocks, and the ratio of C stock in dead wood to total (live and dead above-ground C stock) of the three decay stages in the two land-use systems. Given are the loadings of the selected variables along the four explanatory axes. Numbers below the axes indicate the eigenvalues of the axes. Numbers in brackets behind the loadings indicate the cumulative percentage of variance explained by the loadings. Numbers in bold mark the variables with closest correlation to the respective axis.
Variables Axis 1 Axis 2 Axis 3 Axis 4
18
processes from human disturbance effects. In the intermediate decay stage, large residues of recent logging could be the possible cause of dead wood accumulation in the jungle rubber, therefore accounting for similar results in both systems. In the jungle rubber system human influence is much more pronounced, therefore tree mortality might increasingly occur due to the anthropogenic damage or tree logging. The abundance of fast-growing species such as Macaranga sp. in the jungle rubber system may also cause a high input source of dead wood (Rembolt et al. unpublished data). Despite this, the dead wood stocks of C and N were still higher in the natural forest.
Dead wood in the natural forest retained long-term C as well as N storage (Olajuyigbe et al. 2011), these stocks provide a large potential for chemical element transfer to the soil. We assumed that high lignin stocks in the natural forest served as the C stock source are expected to retain a long-term storage in this system supporting the longevity of dead wood on the forest floor. A dense canopy cover and high basal area in the natural forest are clear reasons for lower air temperature and higher air humidity than in the jungle rubber system (Kotowska et al. 2015). These microclimate properties in the natural forest plots represent favourable conditions for microorganism degrading dead wood (Zhou et al. 2007). Conversion of natural forest into jungle rubber systems may not only impact the microclimate conditions, but may likely alter also other environmental factors such as soil organic matter composition, which therefore alter the microbial and fungal community as well which in turn will influence the dead wood degradation. These findings are strongly supported by Guillaume et al. (2015) who reported loss of soil organic C and soil organic N in the top soil of jungle rubber at the same study sites. The reduced soil organic matters give evidence that decreased stocks of dead wood in the jungle rubber may be one of the factors leading to reduced C and N input to the soil. Therefore, high stocks of C and N from dead wood in the natural forest indirectly indicate a better soil fertility.
Dead wood mass in our study accounted for 2.7% and 2.3% of total AGB in natural forest and in jungle rubber, respectively. Comparing with similar studies from other tropical rainforests, this current finding was lower than in Peru in which dead wood accounted for 7.5–9.3% of total AGB (Baker et al. 2007). Pregitzer & Euskirchen (2004) reported that the mean C pool of woody debris across tropical forests amounted to 10% of the total carbon stocks. Dead wood contributed 2.3% of total aboveground C stocks in the natural forest and 1.9% of that in the jungle rubber (Kotowska et al. 2015). These values were five times lower compared to 33% of the C stock in Costa Rican natural forests (Clark et al. 2002).
19 N translocation from immobilized soil nutrient mediated by microorganisms i.e., fungi (Philpott et al. 2014), (2) increased activity of asymbiotic N-fixing bacteria (Brunner & Kimmins 2003) and (3) increased N structural binding with lignin, aromatic and phenolic compounds which were resistant to be degraded (Hishinuma et al. 2015). In our study, neither lignin nor C concentrations differed maredly among wood decay stages (Figure 7a and 7b), as also found by Harmon et al. (2013). Lignin has a complex structure of phenylpropanoid polymers that is rich in C-C bond and ether. Therefore, C is the largest constituent of lignin (63-72%) (Harmon et al. 2013). During decaying processes, soluble C in active organic C of dead wood is consumed for microorganism demand (Anderson & Dousch 1989), while passive C fraction is slowly decomposing because of its accumulation in persistent organic matter of lignin (Bonanomi et al. 2013). Similar to finding of Hishinuma et al. (2015), increased lignin-C content and decreased polysaccharide-C were found in advanced decay of wood in this study.
The abundance of dead wood mass and stocks of C, N and lignin were dominated by early decayed wood which might reflect a low decay process intensity of the woody debris in our plots.The influence of wood decay stages to these parameters might be affected by factors of wood mass and changes of its respective chemical concentrations. High mass in early decay stage led to high stocks of C and lignin, but not N stock (Figure 8). These were primarily related to the high dead wood mass toward high mean concentration of C and lignin. As well as in advanced decay stage, low mass of dead caused low stocks of C and lignin. The variability of N stocks among decay stages was mostly due to the high dead wood mass with low N concentration in the early decay of wood and in contrast to advanced stage, as also found by Guo et al. (2014). Diameter and length of dead wood were variable among decay stages, and thus influencing the volume value (Figure 8). Given that wood density determined the decay advances, mass estimated by measuring wood density more appropriately reflected the stage of wood decay than volume. Large amounts of nutrient retained on the forest floor in early decay stage are expected to contribute as a nutrient source for regenerating trees and decomposer biomass. Low dead wood abundance in advanced decay stage might be due to the losses of its mass and nutrients caused by degrading process by decomposers. Essentially, this indicates that nutrient stocks in dead wood are transferred to the environment.
20
in mass and lignin of dead wood were strongly main factors in separating wood decay in natural forests.
5
CONCLUSIONS AND SUGGESTIONS
Conclusions
The findings of this study showed that (1) total mass, C and N stocks of dead wood in natural forest were higher than those in jungle rubber, as well as found in the early and advanced wood decay stages. Transformation of natural forest into jungle rubber resulted in losses of C and N stocks, thus reduced dead wood contribution which is regarded as an important component of the ecosystem, (2) N concentrations were found to increase with advancing wood decay contrary to the C/N ratio, while C and lignin concentrations remained variable among decay stages of wood, and (3) the abundance of biomass, stocks of C and lignin of dead wood were higher in the early stage than the advanced stage of wood decay. Consequently, the current study implies that converting natural forest to jungle rubber systems not only reduces total mass of dead wood, but also decreases C and N stocks both in total and in the different stages of wood decay. As a consequence, this will affect long-term sustainability of soil nutrients. Nutrient stocks in jungle rubber will decrease in the future and this reduction will continue to increase if remaining forest vegetation is replaced with young rubber stands. We suggest allowing a proportion of dead wood amount to decay by natural process as an indirect approach to maintain soil fertility.
Suggestions
Given a basic research of dead wood in Indonesia forests, it is important to assess soil C and N concentration below fallen dead wood in different decay stages to determine the contribution of dead wood to nutrient soil. For further research, it is also crucial to determine the species identification for appropriate nutrient content affecting decay stages.
REFERENCES
Aakala T. 2010. Coarse woody debris in late-successional Picea abies forests in northern Europe: Variability in quantities and models of decay class dynamics. For Ecol Manage. 260:770-779.
Anderson T, Dousch KH. 1989. Ratios of microbial biomass carbon to total organic carbon in arable soils. Soil Biol Biochem. 21:471–479.
21 Baker TR, Eurídice N, Coronado H, Phillips OL, Martin J, van der Heijden GMF, Garcia M, Espejo JS. 2007. Low stocks of coarse woody debris in a southwest Amazonian forest. Oecologia. 152:495–504.
Blaser S, Prati D, Senn-Irlet B, Fischer M. 2013. Effects of forest management on the diversity of deadwood-inhabiting fungi in Central European forests. For Ecol Manage. 304:42–48.
Bamber RK. 1987. Heartwood and Softwood. Australia (AU): Forestry Commission of New South Wales.
Boddy L, Watkinson SC. 1995. Wood decomposition, higher fungi, and their role in nutrient redistribution. Can J Bot. 73: 1377–1383.doi:10.1139/b95-400. Bonanomi G, Incerti G, Giannino F, Mingo A, Lanzotti V, Mazzoleni S. 2013.
Litter quality assessed by solid state 13C NMR spectroscopy predicts decay rate better than C/N and Lignin/N ratios. Soil Biol Biochem. 56:40–48. Brunner A, Kimmins JP. 2003. Nitrogen fixation in coarse woody debris of Thuja
plicata and Tsuga heterophylla forests on northern Vancouver Island. Can J For Res. 33:1670–1682.
Campbell MM, Sederoff RR. 1996. Variation in lignin content and composition: mechanisms of control and implications for the genetic improvement of plants. Plant Physiol. 110:3-13.
Chambers JQ, Higuchi N, Schimel JP, Ferreira L V, Melack JM. 2000. Decomposition and carbon cycling of dead trees in tropical forests of the central Amazon. Oecologia. 122:380–388.
Chave J, Andalo C, Brown S, Cairns MA, Chambers JQ, Eamus D, Folster H, Fromard F, Higuchi N, Kira T, Lescure JP, Nelson BW, Ogawa H, Puig H, Riéra B, Yamakura T. 2005. Tree allometry and improved estimation of carbon stocks and balance in tropical forest. Oecologia. 145(1):87-99. Clark DB, Clark DA, Brown S, Oberbauer SF, Veldkamp E. 2002. Stocks and
flows of coarse woody debris across a tropical rain forest nutrient and topography gradient. For Ecol Manage. 164:237–248.
Coleman DC, Crossley DA, Hendrix JPF. 2004. Fundamentals of Soil Ecology. Oxford (UK): Elsevier.
[FAO] Food and Agriculture Organization. 2010. Global Forest Resources Assessment – Main Report. In: FAO Forestry Paper No. 163. Rome (IT):
Food and Agriculture Organization of the United Nations.
[FAO] Food and Agriculture Organization. 2015. Global Forest Resources Assessment – How are the World’s Forests Changing? Rome (IT): Food
and Agriculture Organization of the United Nations.
Floren A, Müller T, Dittrich M, Weiss M, Linsenmair KE. 2014. The influence of tree species, stratum and forest management on beetle assemblages responding to deadwood enrichment. For Ecol Manage: 323:57–64. Gouyon A, Deforesta H, Levang P. 1993. Does ‗jungle rubber‘ deserve its name?
An analysis of rubber agroforestry systems in southeast Sumatra. Agrofor Syst. 22(3):181-206.
22
Guillaume T, Damris M, Kuzyakov Y. 2015. Losses of soil carbon by converting tropical forest to plantations: erosion and decomposition estimated by δ13C. Glob Change Biol. 21:3548-3560.
Guo J, Chen G, Xie J. 2014. Patterns of mass, carbon and nitrogen in coarse woody debris in five natural forests in southern China. Ann For Sci. 71:585–594.
Gurdak DJ, Aragão LEOC, Rozas-Dávila A, Huasco WH, Cabrera KG, Doughty CE, Farfan-Rios W, Silva-Espejo JE, Metcalfe DB, Silman MR, Malhi Y. 2013. Assessing above-ground woody debris dynamics along a gradient of elevation in Amazonian cloud forests in Peru: balancing above-ground inputs and respiration outputs. Plant Ecol Divers. 7:143–160.
Hafner SD, Groffman PM. 2005. Soil nitrogen cycling under litter and coarse woody debris in a mixed forest in New York State. Soil Biol Biochem. 37(11):2159–2162.doi:10.1016/j.soilbio.2005.03.006.
Hairiah K, Ekadinata A, Sari RR, Rahayu S. 2011. Pengukuran Cadangan Carbon dari Tingkat Lahan ke Bentang Lahan. 2th Ed. Bogor (ID): World Agroforestry Centre.
Harmon ME, Fasth B, Woodall CW, Sexton J. 2013. Carbon concentration of standing and downed woody detritus: Effects of tree taxa, decay class, position, and tissue type. For Ecol Manage. 291:259–267.
Harmon ME, Ferrell WK, Franklin JF. 1990. Effects on carbon storage of conversion of old-growth forest to young forest. Science. 247:699-701. Harmon M, Franklin J, Swanson F, Sollins P, Gregory S, Lattin J, Anderson N,
Cline S, Aumen N, Sedell J, Lienkaemper GW, Cromack K, Cummins KW. 1986. Ecology of coarse woody debris in temperate ecosystems. Adv Ecol Res. 15:133–302.
Harmon ME, Hua C. 1991. Coarse woody debris dynamics in two old-growth ecosystems in Oregon. Bioscience. 41:604‐610.
Hishinuma T, Osono T, Fukasawa Y, Azuma JI, Takeda H. 2015. Application of 13C NMR spectroscopy to characterize organic chemical components of decomposing coarse woody debris from different climatic regions. Ann For Res. 58(1): 3-13.
[IPCC] Intergovernmental Panel on Climate Change. 2000. Land Use, Land-Use Change, and Forestry. (UK): Cambridge University Press.
Jonsson BG, Kruys N, Ranius T. 2005. Ecology of species living on dead wood – Lessons for dead wood management. Silva Fenn. 39(2): 289–309.
Kauffman JB, Donato DC. 2012. Protocols for The Measurement, Monitoring and Reporting of Structure, Biomass and Carbon Stocks in Mangrove Forests. Bogor (ID): CIFOR.
Kebli H, Brais S, Kernaghan G, Drouin P. 2012. Impact of harvesting intensity on wood-inhabiting fungi in boreal aspen forests of Eastern Canada. For Ecol Manage. 279:45–54.
Kirk TK, Cowling EB. 1984. Biological Decomposition of Solid Wood. In: Rowel M. (Ed.). The Chemistry of Woild wood. Washington DC (US): American Chemical Society.
23 results from the 2015 UN FAO Global Forest Resource Assessment. For Ecol Manage. 352:21–34.
Köhl M, Stümer W, Kenter B, Riedel T. 2008. Effect of the estimation of forest management and decay of dead woody material on the reliability of carbon stock and carbon stock changes—A simulation study. For Ecol Manage. 256:229–236.
Kotowska MM, Leuschner C, Triadiati T, Meriem S, Hertel D. 2015. Quantifying above- and belowground biomass carbon loss with forest conversion in tropical lowlands of Sumatra (Indonesia). Glob Change Biol. 21(10):3620–3634.
Laiho R, Prescott CE. 1999. The contribution of coarse woody debris to carbon, nitrogen, and phosphorus cycles in three Rocky Mountain coniferous forests. Can J For Res. 29(10):1592–1603.
Lambers H, Chapin III FS, Pons TL. 2008. Role in Ecosystmes and Global Processes. In: Springer (eds). Plant Physiological Ecology, Second Edition. New York (US): Springer.
Liu W, Schaefer D, Qiao L, Liu X. 2013. What controls the variability of wood-decay rates? For Ecol Manage. 310:623–631.
Lombardi F, Cherubini P, Tognetti R, Cocozza C, Lasserre B, Marchetti M. 2013. Investigating biochemical processes to assess deadwood decay of beech and silver fir in Mediterranean mountain forests. Ann For Sci. 70: 101– 111.
Mackensen J, Bauhus J. 2003. Density loss and respiration rates in coarse woody debris of Pinus radiata, Eucalyptus regnans and Eucalyptus maculata. Soil Biol Biochem. 35: 177–186.
Malhi Y, Baldocchi DD, Jarvis PG. 1999. The carbon balance of tropical, temperate and boreal forests. Plant, Cell Environ. 22:715–740.
Margono BA, Potapov P V, Turubanova S, Stolle F, Hansen MC. 2014. Primary forest cover loss in Indonesia over 2000–2012. Nat Clim Chang. 4:730– 735.doi:10.1038/nclimate2277.
Merganičová K, Merganič J, Svoboda M, Bače R, Šebeň V. 2012. Deadwood in Forest Ecosystems, Forest Ecosystems - More than Just Trees. Dr Juan A. Blanco (Ed.). Sanghai (CN): InTech.
Neuman RC. 1999. Organic Molecules and Chemical Bonding. Organic Chemistry. California (US): University of California.
Olajuyigbe SO, Tobin B, Gardiner P, Nieuwenhuis M. 2011. Stocks and decay dynamics of above- and belowground coarse woody debris in managed Sitka spruce forests in Ireland. For Ecol Manage. 262(6):1109–1118. Palviainen M, Finér L, Laiho R, Shorohova E, Kapitsa E, Vanha-Majamaa I.
2010. Carbon and nitrogen release from decomposing Scots pine, Norway spruce and silver birch stumps. For Ecol Manage. 259:390–398. Pan Y, Birdsey RA, Fang J, Houghton R, Kauppi PE, Kurz WA, Phillips OL,
Shvidenko A, Lewis SL, Canadell JG, Ciais P, Jackson RB, Pacala SW, McGuire AD, Piao S, Rautiainen A, Sitch S, Hayes D.2011. A large and persistent carbon sink in the world‘s forests. Science. 333:988–993.
24
Philpott TJ, Prescott CE, Chapman WK, Grayston SJ. 2014. Nitrogen translocation and accumulation by a cord-forming fungus (Hypholoma fasciculare) into simulated woody debris. For Ecol Manage. 315:121–128. Pregitzer KS, Euskirchen ES. 2004. Carbon cycling and storage in world forests:
biome patterns related to forest age. Glob Change Biol. 10: 2052-2077. Pyle C, Brown MM. 1999. Heterogeneity of wood decay classes within hardwood
logs. For Ecol Manage. 114:253–259.
Rajala T, Peltoniemi M, Pennanen T. 2012. Fungal community dynamics in relation to substrate quality of decaying Norway spruce (Picea abies [L.] Karst.) logs in boreal forests. Microbiol Ecol. 81:494–505.
Strukelj M, Brais S, Quideau SA, Angers VA, Kebli H, Drapeau P, Oh S. 2013. Chemical transformations in downed logs and snags of mixed boreal species during decomposition. Can J For Res. 798:785–798.
Sutaryo D. 2009. Penghitungan Biomassa – Sebuah Pengantar untuk Studi Karbon dan Perdagangan Karbon. Bogor (ID): Wetland International Indonesia Programme.
Taiz L, Zeiger E. 2010. Plant Physiology. Third Edition. Sunderland (UK): Sinauer Associates.
Tobin B, Black K, Mcgurdy L, Nieuwenhuis M. 2007. Estimates of decay rates of components of coarse woody debris in thinned Sitka spruce forests. Forestry. Vol.80:455-469.
Vanholme R, Demedts B, Morreel K, Ralph J, Boerjan W. 2010. Lignin biosynthesis and structure. Plant Physiol. 153(7):895–905.
Vashum KT, Jayakuma S. 2012. Methods to estimate above-ground biomass and carbon stock in natural forests - a review. J Ecosyst Ecogr. 2(4):1-7. [WWF] World Wildlife Fund. 2010. Sumatra’s forests, their wildlife and the
climate windows in time: 1985, 1990, 2000 and 2009. Jakarta (ID): WWF Report.
Yan E, Wang X, Huang J. 2006. Concept and classification of coarse woody debris in forest ecosystems. Front Biol China. 1:76–84.
Yang FF, Li YL, Zhou GY, Wenigmann KO, Zhang DQ, Wenigmann M, Liu SZ, Zhang QM. 2010. Dynamics of coarse woody debris and decomposition rates in an old-growth forest in lower tropical China. For Ecol Manage. 259:1666–1672.
25
26
26
Appendix 1 Data of total mass, volume, stocks of C, N and lignin, and chemical concentrations of C, N, C:N and lignin in dead wood
Ecosystem N Mass
(t ha-1)
Volume (m3 ha-1)
Stock C (t ha-1)
Stock N (t ha-1)
Stock lignin (t ha-1)
C (%)
N (%)
C:N ratio Lignin (%)
Natural forest HF1 11.858 34.328 5.228 0.040 1.159 43.657 0.360 130.545 9.946
HF2 12.084 21.225 5.185 0.045 2.433 42.043 0.439 131.881 26.014
HF3 9.832 29.311 4.265 0.048 3.847 43.593 0.468 108.307 38.640
HF4 15.982 41.048 6.785 0.066 4.625 42.499 0.418 111.563 29.002
BF1 5.329 13.745 2.124 0.022 2.271 41.350 0.415 99.748 42.578
BF2 4.065 9.875 1.529 0.022 1.531 39.818 0.582 73.459 31.173
BF3 15.165 42.678 6.656 0.062 4.911 43.405 0.435 110.000 36.477
BF4 9.814 24.012 4.407 0.054 3.690 45.065 0.644 77.888 38.266
Jungle rubber HJ1 3.051 5.228 1.368 0.012 1.055 44.097 0.392 112.754 32.765
HJ2 1.702 4.425 0.752 0.007 0.774 43.938 0.439 114.415 44.510
HJ3 4.333 8.972 1.927 0.016 0.914 43.912 0.385 126.313 20.432
HJ4 5.890 13.887 2.718 0.029 1.839 45.957 0.521 112.329 32.304
BJ1 1.417 4.327 0.627 0.007 0.336 44.304 0.468 130.551 23.767
BJ2 1.823 5.483 0.746 0.010 0.559 42.237 0.504 91.361 31.374
BJ3 5.750 11.379 2.466 0.019 1.219 43.243 0.427 126.197 19.911
BJ4 3.058 8.706 1.298 0.014 0.780 42.620 0.584 90.648 30.391
27
27
Appendix 2 Data of mass, volume, stocks of C, N and lignin, and chemical concentrations of C, N, C:N and lignin for every wood decay stages
Ecosystem Decay stages of wood
N Mass (t ha-1)
Volume (m3 ha-1)
Stock C (t ha-1)
Stock N (t ha-1)
Stock lignin (t ha-1)
C (%)
N (%)
C:N ratio Lignin (%)
Natural forest Early decay HF1 5.097 11.445 2.294 0.013 0.236 45.017 0.260 173.792 4.637
HF2 8.771 16.630 3.760 0.033 1.528 42.873 0.377 120.409 17.427 HF3 3.243 8.035 1.426 0.010 1.170 43.963 0.303 152.774 36.060 HF4 6.358 10.361 2.746 0.019 1.852 43.180 0.307 142.748 29.120 BF1 3.880 8.678 1.477 0.016 1.656 38.070 0.420 90.643 42.670 BF2 2.855 5.855 1.019 0.014 1.266 35.690 0.497 72.024 44.357 BF3 3.262 6.360 1.360 0.012 1.404 41.692 0.380 114.688 43.038 BF4 5.523 13.818 2.426 0.030 2.488 43.933 0.540 84.035 45.053 Intermediate
decay HF1 1.118 3.201 0.473 0.005 0.123 42.353 0.427 99.556 11.037 HF2 2.600 2.093 1.145 0.008 0.650 44.043 0.303 201.970 25.007 HF3 2.328 6.332 1.036 0.010 0.873 44.513 0.447 106.984 37.500 HF4 4.350 12.243 1.916 0.016 1.316 44.043 0.367 120.434 30.263
BF1 0.000 0.000 0.000 0.000 0.000 0.000 0.000 0.000 0.000
28 28
29
29
30
BIOGRAPHY
The author was born on Merauke 02th October 1990. The author is the 1st daughter of three siblings from Budirman and Sitti Khomariyah. The author was graduated from SMA Negeri 05 Unggulan Parepare, South Sulawesi, in 2008. In the same year, the author was accepted as undergraduated student of Biology Education Major, Faculty of Mathematics and Natural Sciences, Makassar State University then graduated in 2012. In 2013, the author was accepted as a graduate student of Plant Biology Major, Faculty of Mathematics and Natural Sciences, Bogor Agricultural University and grantee academic scholarsip from Directorate of Higher Education of Indonesia for 2013-2015.