FERTILITY OF OXISOLS
PHIMMASONE SISOUVANH
GRADUATE SCHOOL
BOGOR AGRICULTURAL UNIVERSITY
BOGOR
titled “
Fertilizers for Tomato Yield and Fertility of Oxisols” was entirely completed by myself with resourceful help from the Department of Soil Science and Land Resource, Bogor Agricultural University. Information and quotes which were sourced from journals and books have been acknowledged and mentioned where in the thesis they appear. All complete references are given at the end of the paper.
Bogor, January 2011
Phimmasone Sisouvanh
Anorganik dan Organik pada Produksi Tomat dan Kesuburan Tanah Oxisols Dibimbing oleh SYAIFUL ANWAR, KOMARUDDIN IDRIS, ATANG SUTANDI
Produktivitas tanah Oxisols dapat ditingkatkan dengan penambahan pupuk organik dan anorganik. Belakangan ini, penggunaan pupuk organik semakin meningkat, didukung dengan sistem manajemen pemupukan yang ramah lingkungan untuk jangka panjang. Tujuan penelitian ini menitikberatkan pada penentuan kombinasi yang sesuai dalam menggunakan pupuk anorganik dan organik pada hasil panen tomat serta peningkatan efisiensi penyerapan dan pemanfaatan nutrisi dari dalam tanah, dan menentukan efek kombinasi pupuk anorganik dengan organik terhadap sifat kimia tanah. Penelitian ini dilakukan di Institut Pertanian Bogor (IPB) dimulai pada bulan November 2009 sampai Juli 2010. Perlakuan yang diberikan didesain menggunakan rancangan Faktorial dalam Rancangan Acak Kelompok Lengkap dengan tiga kali pengulangan. Perlakuan terdiri atas dua faktor yaitu dosis pupuk anorganik [(0-0-0), (2,53 urea- 1,68 SP- 3 KCl), (4,68 urea- 3,12 SP- 6,52 KCl) dan (7,2 urea- 4,8 SP- 10 KCl) (g/pot)], dan pupuk organik [0, 200, dan 400 (g/pot), (Kompos kotoran sapi, sekam dan jerami padi dalam perbandingan rasio 1:1:2 dengan volume) atau (Kompos kotoran sapi, sekam dan gambut dalam perbandingan rasio 1:1:2 dengan volume)]. Ulangan ditetapkan sebagai kelompok. Data dianalisis dengan program Microsoft Excel, ANOVA dengan General Linear Model (GLM) yang merupakan pilihan perangkat lunak dari Minitab. Hasil penelitian menunjukkan bahwa kombinasi penggunaan pupuk anorganik dan organik mempunyai efek yang positif pada hasil panen tomat dan efisiensi hara. Kombinasi terbaik terdapat pada pupuk organik taraf 200 atau 400 g/pot dengan pupuk anorganik yang mempunyai taraf paling rendah. Kombinasi pupuk anorganik pada taraf (2.53 urea-1.68 SP-3 KCl, g/pot) dengan jerami padi atau kompos gambut pada taraf 400 g/pot menghasilkan produksi tomat tertinggi daripada kombinasi yang lain. Kombinasi pupuk anorganik pada taraf (2.53 urea-1.68 SP-3 KCl, g/pot) dengan kompos jerami padi pada taraf 400 g/pot atau kompos gambut pada taraf 200 dan 400 g/pot menghasilkan efisiensi hara tertinggi. Sifat kimia tanah setelah panen pada perlakuan pupuk organik maupun anorganik mampu meningkatkan kesuburan tanah daripada tanah sebelum ditanami atau diberikan pupuk dan peningkatan penggunaan pupuk juga meningkatkan kesuburan tanah.
Organic Fertilizers for Tomato Yield and Fertility of Oxisols. Under direction of SYAIFUL ANWAR, KOMARUDDIN IDRIS, ATANG SUTANDI
Productivity of Oxisols could be improved by addition of organic and inorganic fertilizer. Recently, the use of organic fertilizer is increasing for long term friendly fertility management. The objectives of this research were to determine the appropriate combination of inorganic and organic fertilizer application on tomato yield and to increase nutrient utilization efficiency in the soil, and to determine the effect of combination of inorganic with organic fertilizers on soil chemical properties. The experiment was conducted at Bogor Agricultural University from November, 2009 to July, 2010. The treatments were designed using Factorial experiment in Randomized Complete Block Design (RCBD) with three replications. The treatment consisted of two factors which were rates of inorganic fertilizer [(0-0-0), (2.53 urea- 1.68 SP- 3 KCl), (4.68 urea- 3.12 SP- 6.52 KCl) and (7.2 urea- 4.8 SP- 10 KCl) (g/pot)], and organic fertilizer [0, 200, and 400 (g/pot), (Compost of cow dung, husk and straw in the ratio 1:1:2 by volume) or (Compost of cow dung, husk and peat in the ratio 1:1:2 by volume)]. Replication was treated as block. Data were analyzed using Microsoft Excel, ANOVA using the General Linear Model (GLM) option of Minitab software. The result of the research indicated that combined use of inorganic and organic fertilizers had positive effects on tomato yield and plant nutrient efficiency. The best combination of inorganic fertilizer occurred at lowest doses with organic fertilizer at 200 or 400 g/pot. Combination of inorganic fertilizer at (2.53 urea- 1.68 SP- 3 KCl, g/pot) with straw or peat compost at 400 g/pot resulted in the highest tomato yield than other combinations. Combination of inorganic fertilizer at (2.53 urea - 1.68 SP - 3 KCl, g/pot) with straw compost at 400 g/pot or peat compost at 200 and 400 g/pot resulted in the highest nutrient efficiency. Soil chemical characteristic after harvesting in both organic and inorganic fertilizer treatments had a sound of soil fertility than the soil before planting or fertilizing and increased the use of fertilizers also increased on the soil fertility.
Organic Fertilizers for Tomato Yield and Fertility of Oxisols. Under direction of SYAIFUL ANWAR, KOMARUDDIN IDRIS, ATANG SUTANDI
Tomato is the most popular vegetable in gardens; It requires enough quantities of N, P and K containing fertilizers, enough organic matter, and some more other minerals for the growth, fruit set, fruit growth, and development. Oxisols have low quantities of essential nutrient elements, often rich in Fe and Al oxide mineral, high P retention by oxide minerals, low in CEC, and low in total quantities of Ca, Mg and K. To enhance the productivity of Oxisols is recommended to have a sound fertility management. Apply lime to raise soil pH, supply organic fertilizers to improve soil structure, provide micronutrients, and improve the efficiency of nutrient uptake, and supply inorganic fertilizers to provide major nutrients to plants in a form that is quickly available. The advantages of organic and inorganic fertilizer need to be integrated in order to achieve optimum performance by each type of fertilizer, and to realize balanced nutrient management for maintaining long term productivity. The objectives of this research were (1) to determine the appropriate combination of inorganic and organic fertilizer application on tomato yield and to increase nutrient utilization efficiency in the soil, and (2) to determine the effect of combination of inorganic with organic fertilizers on soil chemical properties.
The research was done at Bogor Agricultural University green house. The soil, and plant were analyzed in soil analysis Laboratory, Department of Soil Science, and Land Resource, Bogor Agricultural University from November, 2009 to July, 2010. The treatments were designed using Factorial experiment in Randomized Complete Block Design (RCBD) with three replications. The treatment consisted of two factors which were rates of inorganic fertilizer [(0-0-0), (2.53 Urea- 1.68 SP- 3 KCl), (4.68 Urea- 3.12 SP- 6.52 KCl), and (7.2 Urea- 4.8 SP- 10 KCl) (g/pot)], and organic fertilizer [0, 200, and 400 (g/pot), (Compost of cow dung, husk, and straw in the ratio 1:1:2 by volume) or (Compost of cow dung, husk, and peat in the ratio 1:1:2 by volume)]. Replication was treated as block. Data were analyzed using Microsoft Excel, ANOVA using the General Linear Model (GLM) option of Minitab software.
The result of the research indicated that combined use of inorganic and organic fertilizers had positive effects on tomato yield and plant nutrient efficiency. The best combination of inorganic fertilizer occurred at lowest doses with organic fertilizer at 200 or 400 g/pot. Combination of inorganic fertilizer at (2.53 urea- 1.68 SP- 3 KCl, g/pot) with straw or peat compost at 400 g/pot resulted in the highest tomato yield than other combinations. Combination of inorganic fertilizer at (2.53 urea - 1.68 SP - 3 KCl, g/pot) with straw compost at 400 g/pot or peat compost at 200 and 400 g/pot resulted in the highest nutrient efficiency. Soil chemical characteristic after harvesting in both organic and inorganic fertilizer treatments had a sound of soil fertility than the soil before planting or fertilizing and increased the use of fertilizers also increased on the soil fertility.
© Copyright of IPB, year 2011 Copyright reserved
1. Forbidden to quote part or all of these writings without including or mentioning the source.
a. Be cited only for educational purposes, research, writing papers, drafting reports, writing criticism or review an issue;
b. Quotation must not harm the affairs of IPB.
FERTILITY OF OXISOLS
PHIMMASONE SISOUVANH
Thesis
As Partial fulfillment of the requirement to obtain Master of Science Degree in Soil Science
GRADUATE SCHOOL
BOGOR AGRICULTURAL UNIVERSITY
BOGOR
Registration Number : A151088091
Approved: Advisory Committee
Dr. Ir. Syaiful Anwar, MSc (Chairman)
Dr. Ir. Komaruddin Idris, MS Ir. Atang Sutandi, MSi, PhD
(Member) (Member)
Agreed:
Coordinator of Major Dean of Graduate School
Ir. Atang Sutandi, MSi, PhD Prof. Dr.Ir. Khairil Anwar Notodiputro, MS
Sincere thank you to Dr. Ir. Syaiful Anwar, MSc, Dr. Ir. Komaruddin Idris, MS, and Ir. Atang Sutandi, MSi, PhD supervisory committee for the research work in which invaluable guidance and direction was given for the whole research period at IPB
Special thank you to the Department of Soil Science and Land Resource for the full support given to enable the successful completion of this research
Thank you also to all the invaluable lecturing staff members as well as lab and technical staff of Soil Science and Land Resource Department who have imparted knowledge that I acknowledge with gratitude
Extended thank you to all fellow students of Soil Science and Land Resource Department and the family of KNB Scholarship group, special mention my close friends Mamihery Ravoniarijaona, Marty Linda Hasu, Sanou Faye, Chea Sinath, Bruce Ochieng Obura, Pauliasy Tokasaya, Adeel ABD Alkarim Fadhl, Andrew Mulwanyi, Elle Frishel, Christopher Hamadi, Thato Tseuoa, Andi Tiara Eka Suardi, and Rafeah Matusin thank you all for your support, assistance and providing a helping hand during the course of Masters Degree studies in Bogor Agricultural University
Further, heartfelt gratitude and thank you to parents, sisters (Phannapeng, Phannaphone, Phonekeo and phiengphone), and brother Hairkham for all you who always inspire, encourage and endless support me for higher education
Finally, thanks a lot to my sponsor KNB (Kemitraan Negara Berkembang) who provided for my scholarship throughout my masters course
My study would have not reached this end without the support from all of you.
Wish you all have a successful and prosperity in your life and may this study be beneficial for us.
Bogor, January 2011
municipality to Mr Fay Sisouvanh and Mrs Kirst Sisouvanh from Laos. The writer is the third born of six children
In 1998, the writer finished Completed Senior High School from Saysettha High School and continued with Bachelors Degree studies in agronomy and graduated in June 2004, from the National University of Laos. After Bachelors level, in 2004 to 2007 the writer had worked for Department of Crop Science, Faculty of Agriculture, National University of Laos as lecturer assistant.
LIST OF TABLES
Page
1 Nutritional Composition in Tomato... 4
2 Lime Requirements of Various Soil Types... 13
3 Selected Chemical Composition of Raw Plant Materials for Compost... 15
4 Selected Chemical Composition of Animal Dung for Compost... 15
5 Selected Chemical Composition of Compost Derived from Different Materials... 16
6 List of Major Microorganisms Present in Compost... 16
7 The combination of inorganic and organic fertilizers provided following treatments... 21
8 Soil Parameters... 23
9 Inorganic Fertilizer Parameters... 23
10 Organic Fertilizer Parameters... 24
11 Plant Parameters... 24
12 Effect of using inorganic fertilizer, straw and peat compost on soil pH, organic C, and CEC in the soil... 26
13 Effect of using inorganic fertilizer, straw and peat compost on total N, available P, and exchangeable K in the soil... 27
14 Effect of using inorganic fertilizer, straw and peat compost on exchangeable Ca, Mg, and Na in the soil... 28
15 Effect of using straw compost and inorganic fertilizer on tomato height... 34
16 Effect of using peat compost and inorganic fertilizer on tomato height... 35
17 Effect of using inorganic fertilizer, straw and peat compost on tomato yield... 36
18 Effect of using inorganic fertilizer, straw and peat compost on plant nutrient uptake... 38
LIST OF FIGURES
Page
1 Relationships Between the Various Components of the Dynamic
Soil System... 8
2 The Nitrogen Cycle... 9
3 Schematic Representation of the P Cycle in the Soil... 10
4 K Equilibria and Cyling in Soil... 11
5 Response of combined use of inorganic fertilizer with straw (a) or Peat (b) compost on soil pH... 29
6 Response of combined use of inorganic fertilizer with straw (a) or peat (b) compost on C-organic in the soil... 36
7 Response of combined use of inorganic fertilizer with straw (a) or peat (b) compost on CEC in the soil... 30
8 Response of combined use of inorganic fertilizer with straw (a) or peat (b) compost on total N in the soil... 31
9 Response of combined use of inorganic fertilizer with straw (a) or peat (b) compost on available P in the soil... 31
10 Response of combined use of inorganic fertilizer with straw (a) or peat (b) compost on exchangeable K in the soil... 32
11 Response of combined use of inorganic fertilizer with straw (a) or peat (b) compost on exchangeable Ca in the soil... 32
12 Response of combined use of inorganic fertilizer with straw (a) or peat (b) compost on exchangeable Mg in the soil... 33
13 Response of combined use of inorganic fertilizer with straw (a) or peat (b) compost on exchangeable Na in the soil... 33
14 Response of combined use of inorganic fertilizer with straw (a) or peat (b) compost on tomato height... 35
15 Response of combined use of inorganic fertilizer with straw (a) or peat (b) compost on fresh weight of fruit per plant... 37
16 Response of combined use of inorganic fertilizer with straw (a) or peat (b) compost on plant N uptake... 38
17 Respose ofcombined use of inorganic fertilizer with straw (a) or peat (b) compost on plant P uptake... 39
peat (b) compost on plant N efficiency... 40 20 Response of combined use of inorganic fertilizer with straw (a) or
peat (b) compost on plant P efficiency... 41 21 Response of combined use of inorganic fertilizer with straw (a) or
LIST OF APPENDICES
Page
1 Soil sample chemical characteristics... 51 2 Soil chemical characteristic after harvesting... 52 3 Soil chemical characteristic after harvesting... 53 4 Effect of combined use of inorganic with organic fertilizer on plant
height... 54 5 Effect of combined use of straw or peat compost with inorganic fertilizer on tomato yield... 55 6 Effect of combined use of inorganic with organic fertilizer on plant
(N, P, and K) uptake and efficiency... 56 7 Assessment Criterion of Soil Chemical Property (Staf Pusat Penelitian
Tanah, 1983)... 57 8 Compost chemical characteristics... 57 9 Analysis of Variance (inorganic fertilizer with straw compost) of
chemical characteristics after harvesting... 57 10 Analysis of Variance (inorganic fertilizer with peat compost) of chemical characteristics after harvesting... 59 11 Analysis of Variance (inorganic fertilizer with straw compost) of tomato growth... 60 12 Analysis of Variance (inorganic fertilizer with peat compost) of tomato
growth... 62 13 Analysis of Variance (inorganic fertilizer with straw compost) of tomato yield... 63 14 Analysis of Variance (inorganic fertilizer with peat compost) of tomato
yield... 64 15 Analysis of Variance (inorganic fertilizer with straw compost) of plant nutrient uptake... 64 16 Analysis of Variance (inorganic fertilizer with peat compost) of plant
nutrient uptake... 65 17 Analysis of Variance (inorganic fertilizer with straw compost) of plant
nutrient efficiency... 65 18 Analysis of Variance (inorganic fertilizer with peat compost) of plant
INTRODUCTION
Background
With 6.5 billion people worldwide, the pressure of producing quality, low-cost food is becoming more apparent, and often more challenging. The world population has doubled since 1950, requiring additional space and more food. These factors challenge the agricultural industry to be more efficient and produce higher yields on less land. To harvest these yields, food producers are required to utilize technological and scientific advancements, while at the same time remaining profitable. One of the major advancements to stimulate crop yield is the increase in the use of fertilizers. In fact, estimates indicate that at least one-third of a crop‟s yield can be attributed solely to fertilizer. Interestingly, as fertilizer helps growers produce more crops (Hoyum, 2006), the hope of producing enough to feed the population cannotbe obtained.
Sustainability of agriculture has become a major global concern since 1980s. Soil organic matter (SOM) is very important in the functions of soil in as much as it is a good indicator of soil quality because it mediates many chemical, physical, and biological processes controlling the ability of soil to perform successfully. A comparison of cultivated and uncultivated soils has demonstrated a reduction in SOM with cultivation (Mann, 1986). SOM properties have been proposed as diagnostic criteria for soil health quality and performance. However, the importance of organic matter (OM) to crop production has received less emphasis, and its proper use in soil management is sometimes neglected or even forgotten. Moreover, understanding nutrient supply or agricultural systems is essential for maintaining long term productivity and yields of crops grown both in organic and conventional production systems (Drinkwater et al., 1995; Stamatoados et al., 1999). In addition, agriculture or agro-industries produce high quantities of organic wastes that are typically rich in nutrients, which can well be used in agriculture to conserve nutrients as well as to reduce waste discharge and the use of chemical fertilizers.
mineral nutrients. Air pour, root zone, and water available to a plant depend largely on the soil structure. This is closely related to the OM in the soil and a suitable distribution of mineral particles of different sizes to keep the soil free-able and porous, permit excess water to drain, and good aeration. The plant absorbs mineral elements and water from the soil and carbon dioxide gas from the air. The elements most frequently deficient include those normally present in commercial fertilizers nitrogen (N), phosphorus (P), and potassium (K). Other important nutrient elements calcium (Ca) and magnesium (Mg) are added in commercial fertilizers and more particularly in agricultural lime that also serves as a neutralizing agent (Hillock, 1990).
To improve the productivity of Oxisols, it is recommended to have a sound fertility management. For example, application of lime to raise soil pH, and fertilization of nitrogen (N), phosphor (P), and potassium (K) fertilizers to supply the nutrient requirements of the plants. Chemical fertilizers alone, however, cannot sustain crop yields over time due to their negative residual effects and availability. Combination of organic and inorganic fertilizers is recommended. Organic fertilizers improve soil structure, provide micronutrients, and improve the efficiency of nutrient uptake in the soil. Inorganic fertilizers provide major nutrients to plants in a form that is quickly available.
Problem Statement
Oxisols have low quantities of essential nutrient elements, they are often rich in Fe and Al oxide minerals, high phosphorus retention by oxide minerals, low in cation exchange capacity (CEC) (McDaniel, 2009), and low in total quantities of Ca, Mg, and K (Buol and Eswaran, 2000). Despite their low fertility, Oxisols can be quite productive with inputs of lime and fertilizers (McDaniel, 2009). If the lime rate was increased or to high, however, it will decrease concentrations of manganese (Mn), iron (Fe), boron (B), copper (Cu), and zinc (Zn) (Martin and Liebhardt, 1994).
Objectives
1. To determine the appropriate combination of inorganic and organic fertilizer application on tomato yield and to increase nutrient utilization efficiency in the soil.
2. To determine the effect of combination of inorganic with organic fertilizers on soil chemical properties.
Hypothesis
1. The combination of inorganic and organic fertilization will increase nutrient utilization efficiency in the soil.
2. The combination of inorganic and organic fertilization will increase soil fertility
Scope of Study
LITERATURE REVIEW
Tomato
The tomato (Lycopersicon esculentum) is a member of the nightshade family Solanaceae (Dekker, 1999). Tomato is native to the mountains of South America; it was taken to Europe where it was a popular vegetable by the 1500s. The tomato did not gain wide acceptance in the United States until the mid 1800s. Today it is the most popular vegetable in gardens (Splittstoesser, 1990).
Tomato has substance composition quite completely and good. It has enough prominent composition of vitamin A, B, C, and other nutrition. The substance composition is presented in Table 1.
Table 1 Nutritional Composition in Tomato
Nutritional composition per 100g foodstuff.
Protein 1 g
Lipids 4 g
Sugar 0.2 g
Vitamin A 1,700 IU
Vitamin B (Thiamine) 0.1 g
Vitamin B2 (Riboflavin) 0.02 g
Niacin 0.6 g
Vitamin C (ascorbic acid) 2.1 mg
Calcium 13 mg
Phosphorus 27 mg
Iron 0.5 mg
Sodium 3 mg
Potassium 244 mg
Energy 23 calories
Source: Dekker (1999)
import in Indonesia to fulfill the demand increased from 8,743,981 kg in 2007 and to 12,011,183 kg in 2008 (Statistic Data of Agriculture, 2009).
The Tomato’s Requirements
Growing tomato requires siliceous-clay loose, deep, well drained soils that are rich in organic matter. The best pH value is between 6 and 7. It requires a lot of calcium, potassium, and magnesium (Dekker, 1999).
Tomato requires enough nutrition for the growth, development of plants, fruit set, fruit growth, and development. For growing tomato, the crop requires enough quantities of nitrogen (N), phosphorus (P), and potassium (K) containing fertilizers, enough organic manure, and some other minerals. How much fertilizers and manure are required for growing tomato is dependent on several factors. Principally, it depends on the nutrients available in the soils. Secondly, how much nutrients the crop deplete from the soils (Anonymous, 2009).
Tomato is a hungry crop, requiring high levels of K, optimum growing temperature about 25-30oC in the daytime and about 15-20oC at night (Davies and Lennartsson, 2005). Tomato plants which yield about 40 ton of the fruits from 1 hectare of land take about 93 kg of N, 20 kg of P, and 126 kg of P from the soils. The rate can be 40-60 kg N, 60-80 kg P, and 100-120 kg P per hectare. Another fertilization recommendation includes 100 kg N, 80 kg P, 50 kg K, and 25 ton of farmyard manure per hectare (Anonymous, 2009).
Harvesting
To obtain the best flavor, tomato fruits should be harvested when they are fully ripe and firm. When the tomato becomes soft before the color has fully developed, the fruits should be picked every other day when the fruits have turned pink and ripened (Splittstoesser, 1990).
Oxisols
Oxisols are very highly weathered soils that found primarily in the inter-tropical regions of the world. These soils have low quantities of essential nutrient elements, content less than 10% of weather-able minerals, and often rich in Fe and Al oxide minerals (McDaniel, 2009).
Most of these soils are characterized by extremely low native fertility, resulting from very low nutrient reserves, high phosphorus retention by oxide minerals, and low cation exchange capacity (CEC) (McDaniel, 2009). Oxisols have low total quantities of Ca, Mg, and K. Most Oxisols have low total quantities of P, most of which are quite insoluble, and unavailable for plant uptake (Buol and Eswaran, 2000). Most nutrients in Oxisols ecosystems are contained in the standing vegetation, and decomposing plant material. Despite low fertility, Oxisols can be quite productive with inputs of lime and fertilizers (McDaniel, 2009).
Sources of Nutrients
only), compound fertilizers (containing two or more nutrients usually combined in a homogeneous mixture by chemical interaction), and fertilizer blends (formed by physically blending mineral fertilizers to obtain desired nutrient ratios) (Tine and Verlinden, 2003).
Soil - Plant Relationships
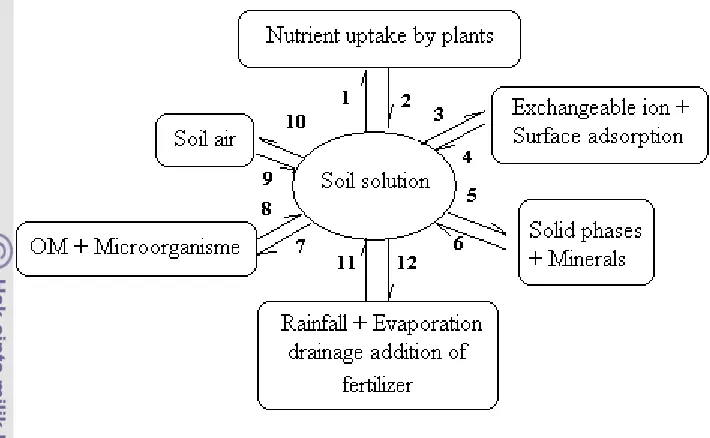
Nutrient supply to plant root is a very dynamic process. Plants absorb nutrients (cations and anions) from the soil solution and release small quantities of ions such as H+, OH-, and HCO3- (Figure 1, interaction 1 and 2). Changes in ion concentrations in soil solution are “buffered” by ions adsorbed on the surfaces of soil minerals (Figure 1, interactions 3 and 4). Ion removal from solution causes partial desorption of the same ions from these surfaces. Soils contain mineral that can dissolve to resupply soil solution with many ions (Figure 1, interactions 5 and 6). Likewise, increasing in ion concentration in soil solution resulting from fertilization or other inputs can cause some minerals to precipitate (Havlin et al., 1999).
Soil microorganisms remove ions from soil solution and incorporate them into microbial tissues (Figure 1, interaction 7). When microbes or other organisms die, they release nutrients to the soil solution (Figure 1, interaction 8). Microbial activity produces and decomposes organic matter or humus in soil. These dynamic processes are very dependent on adequate energy supply from organic carbon, C (i.e., crop residues), inorganic ion availability, and numerous environmental conditions. Plant roots and soil organisms utilize O2 and respired CO2 through metabolic activity (Figure 1, interactions 9 and 10). As a result CO2 concentration in soil air is greater than in the atmosphere. Diffusion of gases in soil decreases dramatically with increasing soil water content (Havlin et al., 1999).
Figure 1 Relationship between the Various Components of the Dynamic Soil System (Lindsay, 1979).
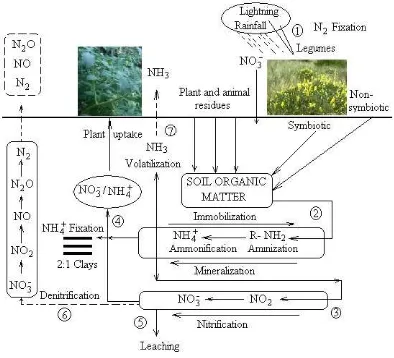
The Nitrogen (N) Cycle
Figure 2The Nitrogen Cycle (Havlin et al., 1999).
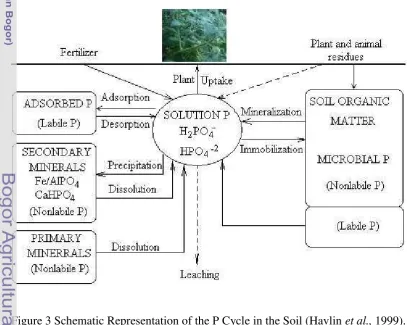
The Phosphorus (P) Cycle
Figure 3 illustrates the interrelationships between the various forms of P in soils. The decrease in soil solution P concentration with absorption by plant roots is buffered by both inorganic and organic P fraction in soils. Primary and secondary P minerals dissolve to resupply H2PO4-/ HPO42- (labile inorganic P) to buffer decreases in solution P. Numerous soil microorganisms digest plant residues containing P and produce many organic P compounds in soil that are mineralized through microbial activity to supply solution P.
microbes immobilize solution P as microbial P, eventually producing readily mineralize-able P compounds (labile organic P) and organic P compounds more resistant to microbial degradation. Maintenance of solution P concentration (intensity) for adequate P nutrition in the plant depends on the ability of labile P (quantity) to replace soil solution P taken up by the plant. The ratio of quantity to intensity factor is called the buffer capacity, which expresses the relative ability of the soil to buffer changes in soil solution P. The larger the buffer capacity, the greater the ability to buffer solution P
The P cycle can be simplified to the following relationship: Soil solution ↔ labile P ↔ nonlabile P,
where labile and nonlabile P represent both inorganic and organic fractions (Figure 3). Labile P is the readily available portion of the quantity faction that exhibits a high dissociation rate and rapidly replenishes solution P. Depletion of labile P cause some nonlabile P to become labile, but at a slow rate. Thus, the quantity factor comprises both labile and nonlabile P fractions.
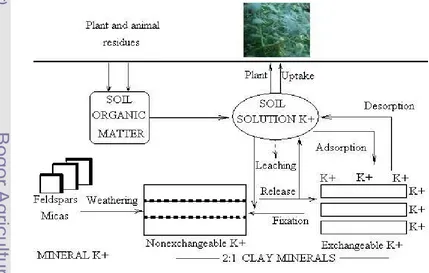
The Potassium (K) Cycle
Listed in increasing order of plant availability, soil K exists in four forms: Mineral (5 000 to 25 000 ppm), nonexchangeable (50 to 750 ppm), exchangeable (40 to 600 ppm) and solution (1 to 10 ppm). The unavailable form accounts for 90 to 98% of total soil K; the slowly available form, 1 to 10%; and the readily available form, 0.1 to 2%. The relationships and transformations among the various forms of K in soils are depicted in Figure 4. K cycle or transformations among the K forms in soils are dynamic. Because of the continuous removal of K by crop uptake and leaching, there is a continuous but slow transfer of K in the primary minerals to the exchangeable and slowly available forms. Under some soil conditions, including applications of large amounts of fertilizer K, some reversion to the slowly available form will occur.
Exchangeable and solution K equilibrate rapidly, whereas fixed K equilibrates very slowly with the exchangeable and solution forms. Transfer of K from the mineral fraction to any of the other three forms is extremely slow in most soils, and this K is considered essentially unavailable to crops during a single growing season.
Soil Fertility and Sources of Plant Nutrients
Nitrogen is needed for the development of dark, green color in plants. It is essential for rapid and continuous vegetative growth. Phosphorus aids plants in getting off to a rapid, vigorous start, promotes early root formation, stimulates blooming, seed production, and hastens maturity. Potassium or potash is needed for plant health anddisease resistance. It is important in ripening of fruit, helpsto develop full and plump seeds.
Where needed and applied in required amounts, commercialfertilizers do not injure the soil. They do not poison vegetables or other plant growth. They do not destroy animal life, earthworms or bacteria in the soil. On the contrary, the addition of fertilizer provides both plant and animal life in the soil with nutrients essential to their welfare (Hillock, 1990).
Fertile soils are capable of storing nutrients that are added to them and releasing the nutrients again whenever they are necessary for plant growth. Plants can uptake these nutrients from the soil through their roots out of two different sources: mineral components (mainly clay) and organic matter.
Clay particles can carry positive or negative electrical charge. When negatively charged the clay particles bond with cation (positive charged) in the soil and when positively charged they bond with anions (negatively charged) in the soil. The soils ability to store the positively charged cations is called Cation Exchange Capacity (CEC), while Anion Storage Capacity (ASC) is a measure of the soil ability to hold on to the negatively charged anions. Soil cation and anion exchange capacity reduce leaching by holding and storing nutrients (Leer, 2006).
The other source that plants can extract nutrients from is organic matter, often used by plants when present in the form of humus. Humus has similar work as clay, concerning CEC, with the difference that clay releases nutrient when the plants require them while organic matter releases nutrients whenever the situation allows mineralization to take place, independent of plant needs (Leer, 2006).
Nutrient Availability
adequate amounts of nutrients will be released before plants need them. When a deficiency does occur, it is not easy to get quick corrective action from organic sources. Soil moisture, temperature, and pH all affect nutrient availability. Very wet, dry, or cool soil can prevent nutrient release. Phosphate availability is limited in soils with pH values below 6.0 (Leer, 2006).
Influences of Soil pH
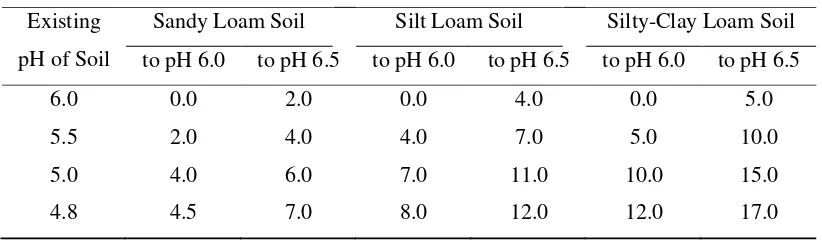
It is important to manage the pH of the soil since it can affect the plant‟s ability to take up nutrients and the microbial activity in the soil that affects the processes needed for plant nutrition. When adjusting the pH, it is important to know the crop‟s pH requirement since different crops grow best at different pH levels. For most crops, optimum pH levels are between 6.0 and 7.0 (Leer, 2006) and lime requirements of various soil type is show in Table 2.
Table 2 Lime requirements of various soil types (Hillock, 1990)
Pounds of agricultural Limestone Needed per 100 sq. ft. to Raise: Existing
pH of Soil
Sandy Loam Soil Silt Loam Soil Silty-Clay Loam Soil to pH 6.0 to pH 6.5 to pH 6.0 to pH 6.5 to pH 6.0 to pH 6.5
6.0 0.0 2.0 0.0 4.0 0.0 5.0
5.5 2.0 4.0 4.0 7.0 5.0 10.0
5.0 4.0 6.0 7.0 11.0 10.0 15.0
4.8 4.5 7.0 8.0 12.0 12.0 17.0
Characteristics of Organic Fertilizer
Composting is a biochemical process converting various components in organic wastes into relatively stable humus-like substances that can be used as a soil amendment or organic fertilizer (Jeong and Kim, 2001). It helps improve the physical and chemical properties of the waste and reduce its phytotoxicity (Marchain et al., 1991). Composting is also considered one of the most suitable ways of disposing of unpleasant wastes and of increasing the amount of organic matter that can be used to restore and preserve the environment (Stentiford, 1987). The finished compost was rated as “stable” with minimum impact on soil C and N dynamics. Good compost should be tolerated readily by growing crops and should not interfere with root growth and development in the way which fresh manure can do. Composted organic materials, therefore, can act as slow-release sources of plant-available N. Therefore, mature compost is the first choice. Nutrient contents can vary widely according to manure type or compost materials (Titiloye et al., 1985).
Organic matters added to soils contain a wide range of C compounds that vary in rates of decomposition. The biological breakdown of the added organic matter depends on the rate of degradation on each of the C-containing materials present in the sample (Reddy et al., 1980). Ajwa and Tabataba (1994) showed that the amount of CO2-C releases increased rapidly initially, but the pattern differed among the organic materials used. Gilbertson et al. (1979) showed that the annual mineralization rate of organic N in animal manure was positively correlated with the N content of waste. Variation in environmental factors, however, may cause a change in the decomposition rates of organic materials in soils. Most of the N found in a composting mixture is organic, principally as part of the structure of proteins, and simple peptides. The proportion of added organic matter that is mineralized after compost application ranks from several up to a hundred percent, depending on experimental conditions, and compost types.
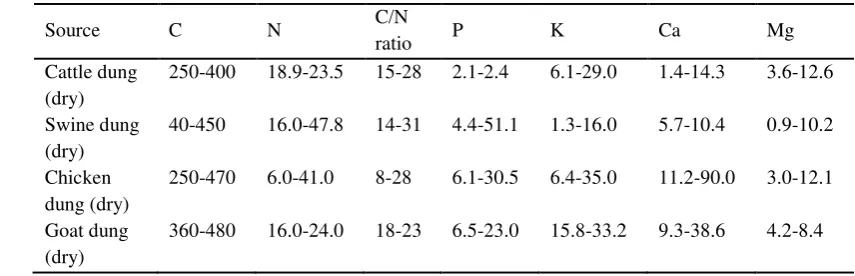
within 14 days of incorporation into soil. Griffin et al. (2000) reported that the amount of N in manure mineralized in a cropping season varied with the different manures: cattle manure 25%; dairy manure 35%; poultry manure 60%; and swine manure 50%. Traditionally, manure has been applied to farmlands to increase soil fertility on the basis of crop N requirement. Organic matter applied, therefore, should be calculated based on its mineralization rate. For example, the application of cattle manure is 20 000 kg/ha at a rate of 100 kg N/ha. Compost is a source of fertilizer N in varying degrees. Thus, understanding the factors that control mineralization will make compost more valuable for agricultural and horticultural uses (Sikora and Szmide, 2001). The nutrients composition of plant material and animal dung are show in Table 3, 4, and 5.
Table 3 Chemical Composition of Raw Plant Materials for Compost (g/kg) (Titiloye et al., 1985)
Source C N C/N ratio P K Ca Mg
Straw 540-560 6.4-6.9 78-88 0.2-0.5 16.6-17.4 3.0-8.6 1.8-3.1
Husk 390-520 3.6-7.0 74-108 0.3-2.0 2.3-10.8 1.1-2.4 0.3-2.4
Table 5 Chemical Composition of Compost Derived from Different Materials
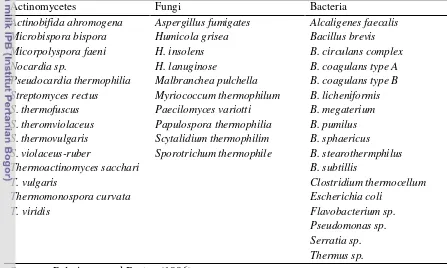
Table 6 List of Major Microorganisms Present in Compost
Actinomycetes Fungi Bacteria
Actinobifida ahromogena Aspergillus fumigates Alcaligenes faecalis Microbispora bispora Humicola grisea Bacillus brevis Micorpolyspora faeni H. insolens B. circulans complex Nocardia sp. H. lanuginose B. coagulans type A Pseudocardia thermophilia Malbranchea pulchella B. coagulans type B Streptomyces rectus Myriococcum thermophilum B. licheniformis S. thermofuscus Paecilomyces variotti B. megaterium S. theromviolaceus Papulospora thermophilia B. pumilus S. thermovulgaris Scytalidium thermophilim B. sphaericus S. violaceus-ruber Sporotrichum thermophile B. stearothermphilus Thermoactinomyces sacchari B. subtillis
(1995) showed that cattle feedlot manure application for 20 years resulted in a significant increase in soil P levels (from 9 mg/kg to 1,200 mg/kg). The research of Hao et al. (2003) showed that the high application rate of manure resulted in considerable nitrate-N accumulation, reaching 80-100 mg/kg. An ideal agricultural soil can contain as much as 5% organic matter by weight.
However, an increase in soil organic matter content increases the risks of nutrient losses to the environment. Organic matter losses can be as great as 1.5% annually (Raymond, 1986). Darwish et al. (1995) showed that at least 95% of total applied annual manure over 15 years was degraded. However, soil organic content can still be increased and maintained by the application of compost. Insufficient knowledge of specific fertilizer values and inadequate application rates can result in under or over use (Conacher and Conacher, 1998). The ultimate purpose of applying organic fertilizer is to establish the suitable soil organic matter content. High initial applications to build up the organic pool and cut back in subsequent years would be appropriate.
Advantages and Disadvantages of Using Inorganic and Organic Fertilizer for Crop Growth and Soil Fertility (Chen, 2008)
Among the materials used in agriculture, fertilizer is the most widely used. Based on the production process, it can be roughly categorized into two types: Inorganic and organic. Each type of fertilizer has its advantages and disadvantages. These advantages need to be integrated in order to achieve optimum performance by each type of fertilizer and to realize balanced nutrient management for crop growth.
Inorganic Fertilizers Advantages:
1. Nutrients are soluble and immediately available to the plants; therefore the effect is usually direct and fast.
3. They are quite high in nutrient content; only relatively small amounts are required for crop growth.
Disadvantages:
1. Over-application can result in negative effects such as leaching, pollution of water resources, destruction of microorganisms, and friendly insects, crop susceptibility to disease attack, acidification or alkalization of the soil or reduction in soil fertility thus causing irreparable damage to the overall system. 2. Oversupply of N leads to softening of plant tissue resulting in plants that are
more sensitive to diseases and pests.
3. They reduce the colonization of plant roots with mycorrhizae and inhibit symbiotic N fixation by rhizobia due to high N fertilization.
4. They enhance the decomposition of soil organic matter (OM), which leads to degradation of soil structure.
5. Nutrients are easily lost from soils through fixation, leaching or gas emission, and can lead to reduced fertilizer efficiency.
Organic Fertilizers Advantages:
1. The nutrient supply is more balanced, which helps to keep plants healthy. 2. They enhance soil biological activity, which improves nutrient mobilization from organic and chemical sources, and decomposition of toxic substances. 3. They enhance the colonization of mycorrhizae, which improves P supply. 4. They enhance root growth due to better soil structure.
5. They increase the organic matter content of the soil, therefore improving the exchange capacity of nutrients, increasing soil water retention, promoting soil aggregates, and buffering the soil against acidity, alkalinity, salinity, pesticides, and toxic heavy metals.
7. They supply food and encourage the growth of beneficial microorganisms and earthworms.
8. They help to suppress certain plant diseases, soilborne diseases and parasites.
Disadvantages:
1. They are comparatively low in nutrient content, so larger volume is needed to provide enough nutrients for crop growth.
2. The nutrient release rate is too slow to meet crop requirements in a short time, hence some nutrient deficiency may occur.
3. The major plant nutrients may not exist in organic fertilizer in sufficient quantity to sustain maximum crop growth.
4. The nutrient composition of compost is highly variable; the cost is high compared to chemical fertilizers.
MATERIALS AND METHOD
Location and Time
The research was conducted at Bogor Agricultural University green house and the soil and plant were analyzed in soil analysis Laboratory, Department of Soil Science and Land Resource, Bogor Agricultural University from November, 2009 to July, 2010.
Materials
The materials required in this research were: Soil (Oxisols), trays, plastic bag (35x35 cm), tomato seed (Panah merah, Tomat RATNA EW SELECT), inorganic fertilizers [(Urea, Superphosphate (SP), and Potassium chloride (KCl)], organic fertilizer (peat or straw compost), and Dolomite [CaMg(CO3)2].
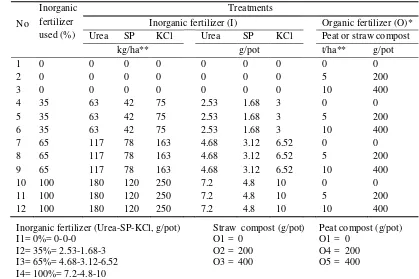
Treatments and Experimental Design
Table 7 The combination of inorganic and organic fertilizers provided following
Inorganic fertilizer (I) Organic fertilizer (O)*
Urea SP KCl Urea SP KCl Peat or straw compost
* Organic fertilizer (Compost of cow dung, husk and straw in the ratio 1:1:2 by volume or compost of cow dung, husk and peat in the ratio 1:1:2 by volume)
** The dose of fertilization gram per pot calculated from tomato population 25 000 plants/ha
Composting Preparation
Soil Preparation and Planting Soil Preparation
The soil was air dried in green house, sieved by 5 mm size, then put into tray for seed sowing, and put into plastic bag (3.5 kg/pot) for cultivation. Both soils for sowing and cultivation were adjusted to pH 6 with dolomite [CaMg(CO3)2] before application of fertilizers. Sowing and transplanting was conducted after one week of pH adjustment.
Seed Sowing
Seeds were sown in trays. Each of trays contains 500g of mixture of soil adjusted to pH 6, cow dung and burnt husk in ratio of 2:1:1 that fertilized with 10 g of equal mixture of Urea, SP, and KCl fertilizers. Sowing was conducted a week after growth media mixture and fertilization.
Transplanting and Fertilization
Seedlings were ready for transplanting in three weeks after sowing. Mixture of soil (after adjusted to pH 6) and compost was done a week before transplanting. There were four times of fertilizers applications as side dressing fertilization. The first application was done at the same time of soil and compost mixing, with 25% of urea, 50% of SP, and 50% of KCl fertilizers. Second application was conducted at two weeks (14 days) after transplanting, with 25% of urea, 25% of SP, and 25% of KCl fertilizers. Third application was done at 44 days after transplanting, with 25% of urea, 25% of SP, and 25% of KCl fertilizers. The last application was completed with the rest 25% of urea at 59 days after transplanting. Spacing between pot plants was 50 x 80 cm.
Observation and Parameters Plant Observations
fruit per plant were measured and calculated at the time of harvesting. Weight of biomass was measured after final harvest.
Soil and Fertilizer Parameters
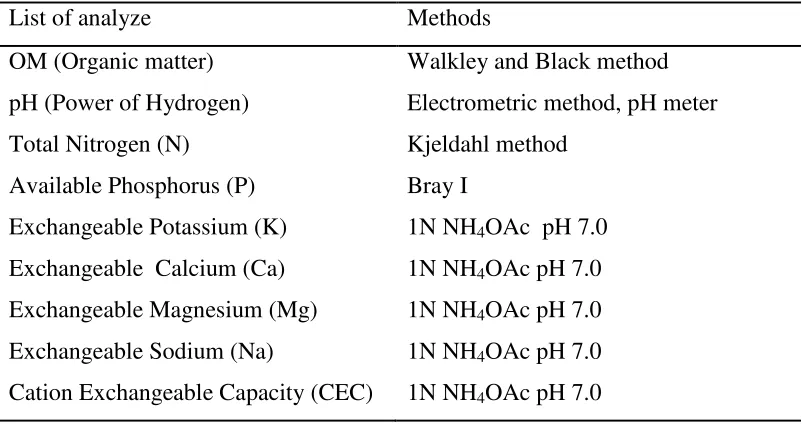
The soil was analyzed before planting and after harvesting. The inorganic and organic fertilizers were analyzed before application to reach the required standards. The list of methods of analysis for the various test procedures which were carried out are listed in Table 8, 9 and 10.
Table 8 Soil Parameters
List of analyze Methods
OM (Organic matter) Walkley and Black method
pH (Power of Hydrogen) Electrometric method, pH meter
Total Nitrogen (N) Kjeldahl method
Available Phosphorus (P) Bray I
Exchangeable Potassium (K) 1N NH4OAc pH 7.0
Exchangeable Calcium (Ca) 1N NH4OAc pH 7.0
Exchangeable Magnesium (Mg) 1N NH4OAc pH 7.0
Exchangeable Sodium (Na) 1N NH4OAc pH 7.0
Cation Exchangeable Capacity (CEC) 1N NH4OAc pH 7.0
Table 9InorganicFertilizer Parameters
List of analyze Methods
Urea (% N) Kjeldahl method
SP (% P2O5) HCl 25%
Table 10Organic Fertilizer Parameters
List of analyze Methods
OM (Organic matter) Nebius
pH (Power of Hydrogen) Electrometric method, pH meter
Total N Kjeldahl method
Total P Dry ashing
Total K Dry ashing
Total Ca Dry ashing
Total Mg Dry ashing
Total Na Dry ashing
Plant Parameters
The root, leaf, and stem of the tomato plant after harvest, and fruit of tomato were analyzed for their N, P, and K nutrient content. The list of analysis for the various test procedures are listed in Table 11.
Table 11Plant Parameters
Nutrient Accumulation Methods
Nitrogen (N) Kjeldahl method
Phosphorus (P) Dry ashing
Potassium (K) Wet ashing
Statistical Analysis
The data were computed using Microsoft excel, ANOVA used the General Linear Model (GLM) option of Minitab software (Minitab Release 14 Statistical Software).
Where:
Yijk = Observation of (plant height and plant production) due to treatments combination with factor A (inorganic fertilizer) i (1, 2, 3, 4) and factor B (organic fertilizer) j (1, 2, 3) and replication as block (k = 1, 2, 3).
µ = Overall mean.
i =Effect of factor A (inorganic fertilizer), (i = 1, 2, 3, 4).
j
= Effect of factor B (organic fertilizer), (j = 1, 2, 3).
(αβ)ij = Effect of interaction factor A and B (inorganic and organic fertilizer). Ρk = Effect of replication as block (k = 1, 2, 3)
εijk = Treatment error of factor A (inorganic fertilizer) i (1, 2, 3, 4) and factor B (organic fertilizer) j (1, 2, 3) and replication as block k (1, 2, 3).
Formula for calculating plant nutrient efficiency
100
NEff, PEff, KEff = Nitrogen, phosphorus, and potassium efficiency (%), respectively
NT, PT, KT = Nitrogen, phosphorus, and potassium of treatment, respectively
RESULTS
Soil chemical characteristics before planting and after harvesting
The result of soil chemical analysis before planting is presented in Appendix 1, while the results of that after harvesting are presented in Appendix 2 and 3, and Table 12, 13, and 14. According to the assessment criterion of soil chemical property (PPT, 1983; used to asses all described soil chemical characteristics), before planting the soil was acidic, very low in [organic carbon (Org-C), total nitrogen (N), phosphorus (P), calcium (Ca), and magnesium (Mg)], low in [potassium (K), sodium (Na), and cation exchange capacity (CEC)].
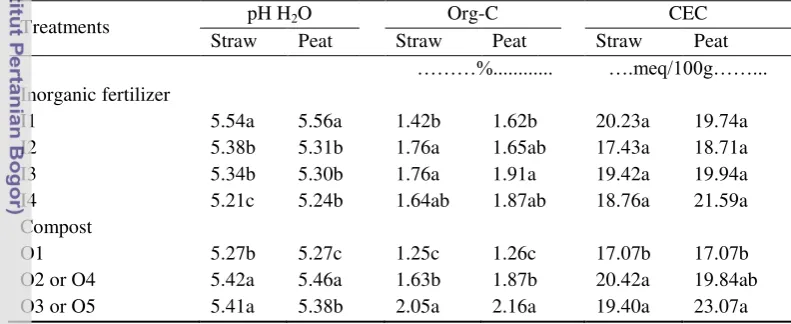
Table 12 Effect of using inorganic fertilizer, straw or peat compost on soil pH, organic C, and CEC in the soil
Note: Different letters in the same column indicate significant differences among treatment (P< 0.05) by Tukey 95% simultaneous confidence intervals
inorganic fertilizer treatment. All soils treated with inorganic fertilizer treatments were higher in organic C compared to that without fertilizer treatment I1. The soil can be classified as low in organic C, and moderate in CEC. Using straw or peat compost had significant effect (p<0.05) on increasing soil pH, organic C, and CEC of the soil (Table 12). The soil can be classified as acid, moderate in CEC; Organic C was low in treatment O1 and O2 or O4 but moderate in treatment O3 or O5.
Table 13 Effect of using inorganic fertilizer, straw or peat compost on total N, available P, and exchangeable K in the soil
Note and definition of symbols, refer to Table 12
effect (p<0.05) on increasingN and P but had no significant effect (p<0.05) on K. Treatment O2 provided the highest N, treatment O3 showed the highest P. The soil could then be classified as very low in N in every treatment, moderate in P at treatments O2 and O3 but low in treatment O1. Using peat compost had no significant effect (p<0.05) on N and K but had significant effect (p<0.05) on increasing P. Treatment O4 provided the highest P and the soil can be classified as very low in N in every treatment, moderate in P in treatment O4 and low in other treatments.
Table 14 Effect of using inorganic fertilizer, straw or peat compost on exchangeable Ca, Mg, and Na in the soil
Note and definition of symbols, refer to Table 12
Mg. This soil can henceforth be classified in every treatment as very low in Ca, low in Mg, and very high in Na.
Inorganic fertilizer (Urea-SP-KCl, g/pot) I1= 0%= 0-0-0
I2= 35%= 2.53-1.68-3 I3= 65%= 4.68-3.12-6.52 I4= 100%= 7.2-4.8-10
Straw compost (g/pot) O1 = 0
O2 = 200 O3 = 400
Peat compost (g/pot) O1 = 0
O4 = 200 O5 = 400
Figure 5Response of combined use of inorganic fertilizer with straw (a) or peat (b) compost on soil pH.
Results shown in (Figure 5) showed that combined use of inorganic fertilizer with straw or peat compost had significant interaction effect (p<0.05) on soil pH. Treatment of inorganic fertilizer I1 with straw compost in treatment O2 or peat compost in treatment O5 showed the highest value of soil pH. The soil can be classified as acidic and moderately acidic.
Note: For definition of symbols, refer to figure 5
The results showed that combined use of inorganic fertilizer with straw compost had no significant interaction effect (p<0.05) on organic C. The soil can be classified as moderate in treatment I2O3 and I3O3, very low in treatment I1O1, and low for other combinations. Combination of inorganic fertilizer with peat compost had significant interaction effect (p<0.05) on organic C. Treatments I1O5, I3O5, and I4O5 provided the highest value in organic C but similar to treatments I1O4, I3O4, I4O4, and I2O5. The soil can be said to be moderate in treatments I1O5, I2O5, I3O5, and I4O5, very low in treatment I1O1 and low for other combinations (Figure 6).
Note: For definition of symbols, refer to figure 5
Figure 7Response of combined use of inorganic fertilizer with straw (a) or peat (b) compost on CEC in the soil.
Note: For definition of symbols, refer to figure 5
Figure 8Response of combined use of inorganic fertilizer with straw (a) or peat (b) compost on total N in the soil.
According to experimental results, combined use of inorganic fertilizer with straw or peat compost had significant interaction effect (p<0.05) on N. Treatment I4O1, I4O2, and I4O4 provided in the highest N. The soil can be classified as low in treatment I4O1, I4O2, and I4O4, very low for other combinations (Figure 8).
Note: For definition of symbols, refer to figure 5
Figure 9Response of combined use of inorganic fertilizer with straw (a) or peat (b) compost on available P in the soil.
I1O5, I4O5, I3O4 and I4O4, very low in treatment I1O1 and low for other combinations (Figure 9).
Note: For definition of symbols, refer to figure 5
Figure 10Response of combined use inorganic fertilizer with straw (a) or peat (b) compost on exchangeable K in the soil.
Combining inorganic fertilizer with straw or peat compost had no significant interaction effect (p<0.05) on K and the resultant soil can be classified as very high in treatments I3 and I4 with straw or peat compost (0, 200, and 400 g/pot), high in treatments I2O1 and I2O3, moderate in treatment I1O3, I2O2, I2O4 and I2O5, low for other combinations (Figure 10).
Note: For definition of symbols, refer to figure 5
From the results, combined use of inorganic fertilizer with straw compost had no significant interaction effect (p<0.05) on Ca. On the other hand, inorganic fertilizer had significant effect (p<0.05) on Ca when in combination with peat compost. Treatment I1O5 provided the highest Ca. The soil is classified as very low for every combination (Figure 11).
Note: For definition of symbols, refer to figure 5
Figure 12Response of combined use inorganic fertilizer with straw (a) or peat (b) compost on exchangeable Mg in the soil.
The results showed that combining inorganic fertilizer with straw or peat compost had no significant interaction effect (p<0.05) on Mg. The soil can be classified as very low in treatments I1O4, I3O4, and I4 with straw or peat compost (200 and 400 g/pot), and low for other combinations (Figure 12).
Note: For definition of symbols, refer to figure 5
Combining inorganic fertilizer with straw or peat compost had no Treatment O1 had the shortest plants. Using inorganic fertilizer had no significant effect (p<0.05) on tomato height at 0, 7, 14, and 21 DAT but significant effect (p<0.05) at 28, 35, 42, and 49 DAT. Increasing the amount of inorganic fertilizer to a certain level reduced tomato height. Treatment I2 gave the tallest height, treatment I4 gave the shortest height, and similar to treatments I1 and I3.
Table 15 Effect of using straw compost and inorganic fertilizer on tomato height
Treatments Days after transplanting
Note and definition of symbols, refer to Table 12
also increased tomato height. Treatment O4 gave the tallest plants at 49 DAT but similar to treatment O5. Treatment O1 gave the shortest height. Using inorganic fertilizer had no significant effect on tomato height at 0, 7, 14, and 21 DAT. However, it had significant effect (p<0.05) at 28, 35, 42, and 49 DAT. Increasing the use of inorganic fertilizer it decreased on tomato height. Treatment I4 gave the shortest height, I2 gave the tallest height at 49 DAT but similar to I3.
Table 16 Effect of using peat compost and inorganic fertilizer on tomato height
Treatments Days after transplanting
0 7 14 21 28 35 42 49
……….cm……… Inorganic fertilizer
I1 8.11a 12.94a 19.78a 29.78a 39.00ab 42.89bc 44.89b 46.33bc
I2 7.28a 11.89a 21.39a 32.89a 44.67a 53.67a 56.78a 58.67a
I3 8.33a 12.94a 20.94a 31.89a 42.67a 47.22b 48.78ab 50.89ab
I4 8.08a 12.33a 20.83a 28.78a 36.22b 39.11c 40.78b 41.67c
Peat compost (g/pot)
O1 7.81a 12.42a 20.42a 30.08a 38.67a 42.83a 43.50b 44.33bc
O4 8.21a 12.71a 20.63a 30.50a 41.00a 47.17a 50.67a 52.50a
O5 7.83a 12.46a 21.17a 31.92a 42.25a 47.17a 49.25ab 51.33ab
Note and definition of symbols, refer to Table 12
The results showed that combined use of inorganic fertilizer with straw or peat compost had no significant interaction effect on tomato height at 49 DAT. Treatments I2O2 and I2O4 better increased on tomato height than other combinations (Figure 14)
Note: For definition of symbols, refer to figure 5
Tomato yield
The results (Table 17) showed that using inorganic and organic fertilizer had significant effect (p<0.05) on tomato yield. Increasing the use of straw or peat compost increased tomato yield. Application of straw compost in treatment O3 had the highest tomato yield. Application of peat compost in treatment O5 had the highest total fruit weight, the biggest fruit size, and that was similar to treatment O4. Application of peat compost in treatment O5 had the highest number of fruit per plant. Further increasing the amount of inorganic fertilizer, however, decreased tomato yield. Application of inorganic fertilizer in treatment I2 had the highest yield of tomato.
Table 17Effect of using inorganic fertilizer, straw or peat compost on tomato yield
Note and definition of symbols, refer to Table 12
Note: For definition of symbols, refer to figure 5
Figure 15 Response of combined use of inorganic fertilizer with straw (a) or peat (b) compost on fresh weight of fruit per plant.
Plant Nutrient Uptake
Table 18 Effect of using inorganic fertilizer, straw or peat compost on plant nutrient uptake
Treatments Nitrogen (N) Phosphorus (P) Potassium (K)
Straw Peat Straw Peat Straw Peat
………..….mg/plant………..……….…...
Inorganic fertilizer
I1 102.13c 98.99c 31.55c 23.03b 278.41c 143.47c
I2 422.11a 414.38a 76.32a 81.71a 752.20a 686.69a
I3 397.83a 304.78ab 70.01a 54.56ab 731.05a 532.84ab
I4 227.74b 189.86bc 47.67b 34.83b 449.57b 327.58bc
Compost
O1 176.88b 176.88a 31.02b 31.02b 294.07c 294.07a
O2 or O4 308.97a 303.64a 63.18a 55.87a 596.11b 474.61a
O3 or O5 376.51a 275.49a 74.96a 58.70a 768.25a 499.26a
Note and definition of symbols, refer to Table 12
The results show that combined use of straw or peat compost with inorganic fertilizer had no significant interaction effect (p<0.05) on plant nutrient uptake. The combination of fertilizers at I2O3 and I2O4 better increased plant N and K uptake than other combinations (Figure 16 and 18). The combination of fertilizers at I2O3, I2O5 and I3O3 better increased plant P uptake than other combinations (Figure 17).
Note: For definition of symbols, refer to figure 5
Note: For definition of symbols, refer to figure 5
Figure 17Response ofcombined use inorganic fertilizer with straw (a) or peat (b) compost on plant P uptake.
Note: For definition of symbols, refer to figure 5
Figure 18 Response of combining inorganic fertilizer with straw (a) or peat (b) compost on plant K uptake.
Plant Nutrient Efficiency
in the highest plant efficiency. Application of peat compost in treatments O4 and O5 provided in the highest plant N, P, and K efficiency.
Table 19 Effect of using inorganic fertilizer, straw or peat compost on plant nutrient efficiency
Treatments Nitrogen (N) Phosphorus (P) Potassium (K) Straw Peat Straw Peat Straw Peat ……….%………….………….……... Inorganic fertilizer
I1 0.00c 0.00c 0.00c 0.00c 0.00c 0.00c
I2 23.79a 29.78a 7.22a 10.64a 22.57a 32.35a
I3 14.78ab 10.89b 4.15b 3.31b 12.62ab 10.95b I4 6.51bc 3.53bc 1.96bc 1.01bc 6.17bc 3.72bc Compost
O1 9.56a 10.55a 3.02a 3.32a 9.40a 10.66a
O2 or O4 9.68a 12.29a 3.20a 4.29a 7.62a 13.32a O3 or O5 14.57a 10.31a 3.78a 3.62a 14.01a 11.29a
Note and definition of symbols, refer to Table 12
The results show that combined use of straw or peat compost with inorganic fertilizer had no significant interaction effect (p<0.05) on plant N, P, and K efficiency. The combination of fertilizers at I2O3, I2O4 and I2O5 better increased plant N, P, and K efficiency than other combinations (Figure 19, 20, and 21).
Note: For definition of symbols, refer to figure 5
Note: For definition of symbols, refer to figure 5
Figure 20 Response of ombined use inorganic fertilizer with straw (a) or peat (b) compost on plant P efficiency.
Note: For definition of symbols, refer to figure 5
DISCUSSION
Effects of using inorganic fertilizer, straw or peat compost on fertility of Oxisols, tomato growth, yield, plant nutrient uptake, and efficiency
CONCLUSIONS
The result of the research indicated that combined use of inorganic and organic fertilizers had positive effects on tomato yield and plant nutrient efficiency. The best combination of inorganic fertilizer occurred at lowest doses with organic fertilizer 200 or 400 g/pot.
1. Combination of inorganic fertilizer at (2.53 urea- 1.68 SP- 3 KCl, g/pot) with straw or peat compost at 400 g/pot resulted in the highest tomato yield than other combinations.
2. Combination of inorganic fertilizer at [2.53 urea - 1.68 SP - 3 KCl (g/pot)] with straw compost at 400 g/pot or peat compost at 200 and 400 g/pot resulted in the highest nutrient efficiency.
RECOMMENDATION
REFERENCES
Ajwa HA and Tabataba MA. 1994. Decomposition of different organic materials in soils. Biol. Fertil., Soils, 18: 175-183.
Akanbi WB, Akande MO, and Adediran JA. 2005. Suitability of composted maize straw, and mineral N fertilizer for tomato production. Journal of VegeTable Science 11(1): 57-65.
Anonymous. 2009. Tomato information update. www.tomato-info.com.
Arshad M, Khalid A, Mahmood MH, and Zahir ZA. 2004. Potential of nitrogen and L-tryptophan enriched compost for improving growth and yield of hybrid maize. Pak J Agric Sci 41: 16-24.
Brady NC and Weil RR. 2005. The nature and properties of soil, 13rd edn. Macmillan Publishing Co, New York.
Brown JE. 1995. Comparison of broiler litter, and commercial fertilizer on production of tomato. Journal of Vegetable Crop Production 1(1): 53-62. Buol SW and Eswaran H. 2000. Oxisols, Department of Soil Science, North
Carolina State University, Releigh, North Carolina 27695. Natural Resources Conservation Service, U.S. Department of Agriculture, Washington, DC.
Cabrera ML, Tyson SC, Kelley TR, Pancarbo OC, Merka WC, and Thompson SA. 1994. Nitrogen mineralization and ammonia volatilization from fractionated poultry letter. Soil Sci. Soc. Am. J., 58:367-372.
Chen JH. 2008. The combined use of chemical and organic fertilizers and/or boifertilizer for crop growth and soil fertility. Department of Soil and Environmental Sciences, National Chung Hsing University 250 Kuo-Kuang Road, Taichung. Taiwan.
Data statistic of agriculture. 2009. Horticulture Directorate General, Department of Agriculture, Indonesia. www.hortikultura.daptan.go.id.
Dekker M. 1999. Handbook of agriculture, Characteristics of the main vegetable crops, Crops grown for their fruit.
Dormar JF and Chang C. 1995. Effect of 20 annual application of excess feedlot manure on labile soil phosphorus. Can. J. Soil Sci., 75: 507-512.
Drinkwater LE, Letourneau DK, Workneh F, Bruggen ACH van, and Shennan C. 1995. Fundamental differences between conventional and organic tomato agroecosystems in California. Ecol. Appl., 5: 1098-1112. 73.
Gilbertson CB, Norstadt FA, Mathure AC, Holt R, Barnett FAP, McCalle TM, Onstad CA, and Young RA. 1979. Animal waste utilization on cropland and pastureland: a manual for evaluation agronomic and environmental effects. USDA Utilization Research Report No. 6 and EPA- 600/2-79-059. Giller KE. 2001. Targeting management of organic resources and mineral fertilizers: Can we match scientists „fantasies with farm‟ realities. In: Balanced Nutrient Management systems for the Moist Savanna and Humid Forest Zones of Africa. Vanlauwe, B., Sanginga, N., Diels, J., and Merckx, R. (Eds.).Wallingford, UK: CAB International.
Griffin TS and Honeycutt CW. 2000. Using growing degree days to predict nitrogen availability from livestock manures. Soil Sci. Soc. Am. J., 64: 1876-1882.
Hadas A and Pornoy R. 1994. Nitrogen and carbon mineralization rates of composted manures incubated in soils. J. Environ. Qual., 23: 1184- 1189.
Hao X, Chabg C, Travia GR, and Zhang F. 2003. Soil and carbon and nitrogen response to 25 annual cattle manure applications . J. Plant Nutr. Soil Sci., 166: 239.-245.
Havlin JL, Beaton JD, Tisdale SL, and Nelson WL. 1999. Soil fertility and fertilizer. An introduction to nutrient management. Sixth edition, Prentice Hall, Upper Saddle River, New Jersey 07458.
Hillock D. 1990. Improving Garden Soil Fertility. Division of Agricultural Sciences and Natural Resources. website at: http://www.osuextra.com Hoyum R. 2006. Soil Fertility more Important Now than Ever Before
www.mosaicco.com
Leer K. 2006. Development of fertilizer recommendations for field vegetables in Dong Anh district, The VEGSYS Research project. www.hort.Purdue .nedu/vegeTable/chinesecabl.htm.
Lindsay WL. 1979. Chemical Equilibrium in Soils. A Weley-Interscience Publication, J. Wiley & Sons, New York. Chichester. Brisbane. Toronto. Printed in the United States of America 10 9 8 7 6 5 4 3 2 1.
Mann LK. 1986. Changes in soil carbon storage after cultivation. Soil Sci., 142: 29-288. application on the growth, fruit yield and quality of tomato (Lycopersicon lycopersicum). Journal of Applied Biosciences 8 (1): 236 – 242.
Palmisano AC and Bartaz MA. 1996. Microbiology of solid waste, pp 125-127. CRC press, Inc 2000. Corporate Bld. N.W. Boca Raton. FL 33431 USA. Parmer DK and Sharma V. 2002. Studies on long-term application of fertilizers
and manure on yield of maizewheat rotation and soil properties under rainfed conditions in Western- Himalayas. J Indian Soc Soil Sci, 50: 311-312.
Pusat penelitian Tanah. 1983. Jenis dan macam Tanah di Indonesia untuk keperluan survai dan pemetaan Tanah Dearah Transmigrasi. Pusat Penelitian Tanah, Bogor.
Rautaray SK, Ghosh BC, Mittra BN. 2003. Effect of fly ash, organic wastes and chemical fertilizers on yield, nutrient uptake, heavy metal content and residual fertility in a ricemustard cropping sequence under acid lateritic soils. Biores Tech 90: 275-283.
Raymond PP. 1986. Toward a more sustainable agriculture. Westport, Connecticut, USA: Avi Publishing Company, Inc. pp. 116-161.