i
ECOSYSTEM AND COMMUNITY BASED MODEL FOR
ZONATION IN NINO KONIS SANTANA NATIONAL PARK,
TIMOR-LESTE
RAIMUNDO MAU
GRADUATE SCHOOL
BOGOR AGRICULTURAL UNIVERSITY
BOGOR
ii
STATEMENT
I, Raimundo Mau, hereby stated that this thesis entitled:
ECOSYSTEM AND COMMUNITY BASED MODEL FOR
ZONATION IN NINO KONIS SANTANA NATIONAL PARK,
TIMOR-LESTE
Is a result of my own work under the supervision of advisory board during the period of March until October 2010 and that it has not been published ever. The content of this thesis has been examined by the advisory board and external examiner.
Bogor, December 2010
iii
ABSTRACT
RAIMUNDO MAU. ‘Ecosystem and Community Based Model for Zonation in Nino Konis Santana National Park, Timor-Leste’. Under supervision of HARTRISARI HARDJOMIDJOJO and GATOT H. PRAMONO
In order to contribute management purposes of Nino Konis Santana National Park, an ecosystem and community based model for zonation has designed. The study is carried out focused on data exploration of the potentials assets of ecological, physics and social economic factors as basis in designing zonation. Zonation scheme was done systematically by conduct several stages of processes such as assessment on High Conservation Values Areas (HCVAs), delineation of Priorities Conservation Areas (PCAs) and evaluation of social economic of the community in six villages covered. Assessment of HCVA occurrence is based on several maps such as Land Cover, Digital Terrain Model, IUCN Listed Species and Social Economic Characteristics. Land cover map classified based on Landsat TM5 acquired November 2006, Digital Terrain Model analysis by generated slopes and elevation maps based on the United State Geology and Survey-Shuttle Radar Thematic Mapping points data. Social economic data analyzed is focused on the pressures by population density and household activities in gathering forests products.
Integration of several method analyses has used such as satellite imagery processing, surfaces analysis and spatial analysis. The product of study is the Biosphere Reserves Zonation model for terrestrial part of Nino Konis Santana National Park. Coverage area designed are Core Areas 180.90 km2 (26.7%), Buffer Zones 215.3 km2 (32.9%) and Transition Areas 279.8 km2 (40.46%). Core Areas is consists of PCA-1 Jaco Island, Tutuala Beach and Adjacent Forests, Paitchao Mountain Range and Lore Reserve Forests, dominantly distributed in villages such Lore I and Tutuala. Buffer Zones is consists of PCA-2 Forests Habitat Corridor, PCA-3 Iralalaro and Numunira Lake, PCA-3 Oaoloho Swamp Forest and PCA-4 North Dry Lowland Forests. Buffer zones mainly distributed in Mehara and Muapitine villages. Transition Areas is consists of areas that have not sufficient data to extract the conservation values that might exist.
iv
ABSTRAK
RAIMUNDO MAU. Ekosistem dan Komunitas Model untuk Zonasi pada Taman Nasional Nino Konis Santana, Timor-Leste. Dibawah bimbingan dari HARTRISARI HARDJOMIDJOJO dan GATOT H. PRAMONO
Dalam rangka menyumbangkan ide untuk pengambilan keputusan dalam pengelolaan taman nasional Nino Konis Santana di Timor-Leste, melalui penelitian itu telah dihasilkan sebuah model yang berbasis pendekatan ekosistem dan komunitas. Model ini terbangun sebagai satu-kesatuan dari data spatial nilai ekologi fisik dan sosial ekonomi kebudayaan masyarakat setempat. Data analisa menghasilkan empat type prioritas konservasi areas (PCAs). Analisa dilaksanakan dengan menggunakan data spatial berupa Peta Penutupan Lahan, Peta Permukaan Bumi, Peta Penyebaran Burung Penting, Peta Klaim Tradisional Lahan oleh Ratu dan Peta Sosial Ekonomi Karakteristik. Sosial ekonomi analysis di titikberatkan pada pengolahan data survey nasional pertanian, yakni tingkat kepadatan penduduk dan ketergantungan pada hasil hutan. Petatradisional klaim kepemilikan lahan dibangun sebagai hasil survey lapangan.
Pemodelan ekosistem yang diperggunakan dalam penelitian ini mengadopsi pemodelan universal dan merupakan kombinasi dari beberapa teknik data analisa seperti dalam identifikasi area-area bernilai konservasi tinggi. Delineasi prioritas area untuk konservasi dilaksanakan berpatokan pada panduan internasional yang telah diintegrasikan dengan regulasi dalam negeri dan atau regional. Sistem zonasi yang diperggunakan mengikuti konsep Biosphere Reserves. Zona Inti meliputi 180.90 km2 atau 26.7%, Zona Penyangga meliputi 215.3 km2 atau 32. 9% dan Zona Transisi meliputi 279.8 km2 atau 40.46%. Masing-masing zona memiliki tingkat resiko sosial ekonomi yang berbeda, demikian juga dengan alternatif penatagunaannya yang berbeda pula. Zona inti terdiri dari beberapa prioritas area seperti Pulau Jaco, Kelompok Hutan Pantai Tutuala, Hutan di Pegunungan Paitchao dan sekitarnya and Hutan Primer Dataran Rendah di Lore I. Zona Penyangga terdiri dari PCA-2 Rimba, PCA-3 Danau Iralalaro dan Numunira, PCA-3 Hutan Rawa Oaoloho dan PCA-4 Hutan Dataran Rendah di Pantai Utara. Sedangkan area yang tidak teridentifikasi adanya nilai-nilai konservasi diperuntukkan bagi pengembangan infrastruktur dan sektor pertanian.
v
SUMMARY
RAIMUNDO MAU. ‘Ecosystem and Community Based Model for Zonation in Nino Konis Santana National Park, Timor-Leste’. Under supervision of HARTRISARI HARDJOMIDJOJO and GATOT H. PRAMONO
Nino Konis Santana National Park is the first national park that was declared by Timor-Leste Government on August 2008. Aims is to i) Protect and conserve nationally and globally important natural and cultural values, ii) Contribute to the achievement of sustainable livelihoods for local communities, iii) Establish the first protected area in Timor-Leste’s world-class protected area system, iv) Increase awareness of conservation and the sustainable management of biodiversity and natural resources, v) Ensure the active participation of and foster ownership by the communities in the protected area, and vi) Manage the NKSNP as an internationally recognized protected area where the traditional interactions of people and nature are maintained in a way that protects the environment.
In order to contribute the management of Nino Konis Santana National Park, a spatial management zoning has modeled throughout this study which is based on ecosystem and community approach. The study is carry out on identification and mapping the potentials assets of ecological as threatened factors and characterization of social economic of community as affecting factors.
Approach in this research has follows universal human-ecosystems models. Integration of several models were used, mainly play by spatial analysis tools such in assessments of high conservation values areas (HCVAs), delineation of priorities conservation areas by considering the national and regional law and regulation. Several maps for Nino Konis Santana National Park have generated in order to fill the minimum spatial data required for analysis. Those maps are including Zonation Map, Land Cover Map, Digital Terrain Model, Important Bird Habitat, Traditional Forest Land Claim and Population Density Map and Household Forests Activities Map.
Ecological factors identified classed into each Priority Conservation Areas (PCAs), four PCAs has produced, PCA-1 occupied 26.44% consist of Jaco Island, Tutuala Beach and Adjacent Forest, Paitchao Mountain Range and Lore Reserve. PCA-2 occupied 15.13% consists of forests areas that functions as habitat corridors to connect Paitchao Mountain Range and Tutuala to the Lore Reserve Forest. PCA-3 occupied 2.22% inland and 5% of Marine Part, consist of Iralalaro Lake, Numunira-Utchanira Lake, Oaoloho Swamp Forest and shallow water of north coast. PCA-4 occupied 13.55%, covered forest communities of Socoloho, north dry lowland forest along Com-Mehara Beach. Forests community in this area has basic function for drink water to the community in Com, Poros and Mehara because there is spring water existed on hilly part.
vi format through raster weights method, thence overlay spatial to spatial between threatened factors and affecting factors to come up with a new characteristic raster. Analyzing of social economic components is aim to characterized its pressures to the conservation areas, this done by given scores to measure the pressures. Data analysis of population density and forests household pressures to conservation areas thence produced information of pressures level of each PCA in every village.
In order to ensure the active participation of and foster ownership by the communities in the protected area a coarse map of Traditional Land Claim by community were generated. The proposed national park is, for Fataluku society, a wholly local preserve and the vital inheritance of their ancestors. Map were divided a zone for traditional land claim based on fieldwork of geo-positioning of boundary amount Ratu. Seven zones has divided are Ilha de Jaco, Paitchao, Praia do Norte, Praia do Sol, Lore, Lagoa Iralalaro and Plateau.
Traditionally, forests of PCA-1 Lore is claim by Ratu Naza, Ratu Pitileti, Ratu Chailoro as dominant Ratu and many small area claim by others with their sacral sites which regularly visited. Praia do Sol (North Coast) of national park where is categorized into buffer areas of PCA-4 within Com Village are claim and dominated by Kati Ratu, Conu Ratu, Keberesi Ratu, Lavera Ratu, and many others Ratu that claimed pieces of land. While PCA-4 where as part of Mehara Village from coast to the terrestrial are claimed and dominated by Home Ratu, Ma’assipanu Ratu, Pair Ratu, Iuru Ratu, Luturenu Ratu, Macapairanu Ratu, Puitical Ratu, Ma’avari Ratu, Keriseni Ratu and Ilivali Ratu. PCA-3 Numunira-Utchanira Lake is claim by Kati Ratu. PCA-3 Iralalaro Lake is claim by Latuloho Ratu, Ma’assipanu Ratu and Solor Ratu. Several Ratu name listed claimed the areas. At Poros Village part of Mehara Village is claimed by Nari Ratu, Letimece Ratu and Comocho Ratu. Mehara and Louiquero hamlet is claimed by Pair Ratu, Pairu Ratu, Latuloho Ratu and Chailoro Ratu.
A set of criteria has set-up in order to end up a final zonation based on ecological values and social economic characteristics. A core area is ecologically it must be represented at least one components of PCA-1 of Endangered, Threatened and Endemic Species, it is covered all land cover class within slope ≥
vii Product of this study by applied the set-up criteria is a model of zonation for terrestrial part of NKSNP by adopted the universal UNESCO Biosphere Reserve Concept. Coverage area zones designed are Core Areas is occupied 180.90 km2 (26.7%), Buffer Zones are occupied 215.3 km2 (32.9%) and Transition Areas is 279.8 km2 (40.46%). Core Areas is consists of PCA-1 Jaco Island, Tutuala Beach and Adjacent Forests, Paitchao Mountain Range and Lore Reserve Forests. Buffer Zones is consists of PCA-2 Forests Habitat Corridor, PCA-3 Iralalaro and Numunira Lake, PCA-3 Oaoloho Swamp Forest and PCA-4 North Dry Lowland Forests. While the Transition Areas are consists of the areas that has not sufficient data to explore the conservation values that might existed. Based on zones designed, several points have recommended. They are such as i) determine zones boundary in the field and demarcate it by conduct a consensus with representation of Traditional Leader, Ratu Entity as representation of community, ii) ground based details mapping of traditional land claim to foster the community ownership, iii) mapping of south coastal marine habitat from Valu Beach to Lore Beach to completed the coastal marine data and iv) establish community board at each village to accumulate and ensure the active participatory of community.
viii
Copyright © 2010, Bogor Agriculture University Copyright are protected by law,
1. It is prohibited to cite all of part of this thesis without referring to and mentioning the sources;
a. Citation only permitted for the sake of education, research, scientific writing, report writing, critical writing or reviewing scientific problem.
b. Citation does not inflict the name and honor of Bogor Agricultural University.
ix
ECOSYSTEM AND COMMUNITY BASED MODEL FOR
ZONATION IN NINO KONIS SANTANA NATIONAL PARK,
TIMOR-LESTE
RAIMUNDO MAU
A thesis submitted for the degree Master of Science in Information Technology for Natural Resources Management Program Study
GRADUATE SCHOOL
BOGOR AGRICULTURAL UNIVERSITY
BOGOR
xi Research Title : Ecosystem and Community Based Model for Zonation
in Nino Konis Santana National Park, Timor-Leste Student Name : Raimundo Mau
Student ID : G051088021
Study Program : Master of Science in Information Technology for Natural Resources Management
Approved by, Advisory Board
Dr. Ir. Hartrisari Hardjomidjojo, DEA Dr. Gatot H. Pramono
Supervisor Co-Supervisor
Endorsed by,
Program Coordinator Dean of the Graduate School
Dr. Ir. Hartrisari Hardjomidjojo, DEA. Prof. Dr. Ir. Khairil A. Notodiputro, MS.
Date of Examination: Date of Graduation:
xii
ACKNOWLEDGEMENTS
Many people that I wish to give my appreciations regarding to my MSc study period. First of all my gratitude for Dr. Ir. Hartrisari Hardjomidjojo, DEA as Program Coordinator and also my Supervisor, Dr. Gatot H. Pramono as my Co-Supervisor for you are both your guidance, comments, corrections and constructive inputs to finalized my thesis is highly appreciated. My appreciation also specially dedicated to Dr. Ir. Ricky Avenzora, M.Sc.F as the external examiner, your valuable inputs and corrections.
Many thanks to SEAMEO-BIOTROP management board and staff during certain period of stay within campus facility and secured environments. Library accesses are usefully learned. MIT-IPB Secretariat, MIT Students specially my classmate and IPB Graduate School Directorate for kinds of supports in managing and administration services, is highly appreciated.
The Ministry of Agriculture and Fisheries Timor-Leste, the SEAMEO-SEARCA as my sponsorship during last two semester, the GTZ Jakarta Office and to those who given assistant financially to me in order to gain successful in my study, are highly appreciate.
Community in Nino Konis Santana National Park, District, Sub Districts, Villages Authority, many thanks for your support during my field work. District, National Forestry, Agriculture, Livestock officers, many thanks for yours accompanied during fieldwork.
Last but not least, Junita Marcal my beloved wife, special kiss for you, your patient, support and pray for me during my study. Joni, Didi, Annie, Bento and Nina you were all good children, Daddy presented this thesis special for you all as Christmas gift. My beloved Mother, Brothers for your support, many thanks.
xiii
CURRICULUM VITAE
The Author was born in Atsabe, Ermera Timor-Leste on 31st August 1971, child of couple Domingos Sigamau and Elsa Fatima. He was finished his Forestry Senior High School (SKMA) Kadipaten in Majalengka, 1991 and Undergraduate Degree in Social-Economic of Agriculture in Universitas Timor-Timur (UNTIM), in Kupang, 2000.
xiv
TABLE OF CONTENTS
Pages
TABLE OF CONTENTS ... i
LIST OF TABLES ... iii
LIST OF FIGURES ... xviii
LIST OF ANNEXES ... xix
I. INTRODUCTION ... 1
1.1 Background ... 1
1.2 Problem Statement ... 2
1.3 Goals and Objectives ... 3
1.4 Scopes of Analysis ... 3
1.5 Outputs ... 4
II. LITERATURE REVIEW ... 5
2.1 Ecosystem ... 5
2.2 National Park ... 6
2.3 Socio-Economic Factors ... 7
2.4 Biosphere Reserve Concept ... 8
2.5 Biological Indicator ... 9
2.6 Imagery Interpretations ... 9
2.7 Spatial Data Analysis and Spatial modeling ... 10
2.8 Previous Study ... 10
2.8.1 Flora and Vegetation Survey ... 10
2.8.2 Important Bird Areas ... 11
2.8.3 Fataluku Forests Tenure ... 12
2.9 The declaration of Nino Konis Santana National Park ... 12
III. METHODOLOGY OF RESEARCH ... 13
3.1 Time and Location ... 13
3.2 Data and Tools ... 13
3.3 Research Framework ... 14
3.4 Data Preparation ... 15
3.4.1 Terrain Model ... 16
3.4.2 Land Cover Classification ... 17
3.4.3 Important Bird Areas ... 19
3.4.4 Threatened Trees Species Distribution ... 21
3.4.5 Social Economic Factors ... 22
3.4.5.1 Population Density ... 24
xv
3.4.5.3 Traditional Land Claim ... 26
3.5 Zonation Scheme ... 30
3.5.1 Rapid Assessment of High Conservation Values Areas ... 31
3.5.2 Delineation of Priorities Conservation Areas ... 32
IV. RESULTS AND DISCUSSION ... 34
4.1 Ecological Values Assessments ... 34
4.1.1. Assessment of High Conservation Values Areas ... 34
4.1.2. Delineation of Priorities Conservation Areas ... 35
4.1.2.1 Priority Conservation Areas-1 ... 37
4.1.2.1.1 Jaco Island ... 37
4.1.2.1.2 Paitchao Mt. Range and Tutuala Beach Forest ... 38
4.1.2.1.3 Lore Reserve Forest ... 39
4.1.2.2 Priority Conservation Areas-2 ... 40
4.1.2.3 Priority Conservation Areas-3 ... 41
4.1.1.3.1 Numunira-Utchanira Lake ... 42
4.1.1.3.2 Iralalaro Lake ... 42
4.1.1.3.3 Oaoloho Swamp Forest ... 43
4.1.1.3.4 Coastal Habitat ... 43
4.1.2.4 Priority Conservation Areas-4 ... 45
4.1.2.5 Non Priority Conservation Areas ... 46
4.2 Social Economic Characteristics ... 48
4.2.1 Population Density ... 48
4.2.2 Household Forests Activities ... 50
4.2.3 Traditional Land Claim ... 53
4.3 Zonation Scheme ... 55
4.3.1 Criteria in Zonation Scheme ... 55
4.3.2 Zones Designed ... 58
4.3.2.1 Core Areas ... 59
4.3.2.2 Buffer Zones ... 60
4.3.2.3 Transition Areas ... 60
4.3.3 Management Needs ... 61
V. CONCLUSIONS AND RECOMMENDATIONS ... 63
5.1 Conclusions ... 63
5.2 Recommendations ... 64
REFERENCES ... 65
xvi
LIST OF TABLES
Pages
Table 1 Ecosystem Approach and Biosphere Reserve Concept ... 8
Table 2 List of vector, raster and descriptive data used ... 14
Table 3 List of hardware and software used ... 14
Table 4 Slope classes distribution ... 16
Table 5 Elevation classes distribution ... 17
Table 6 Percentage of land covers classes divided per category ... 19
Table 7 IUCN protected trees species recorded within several points on surveyed ... 21
Table 8 Score in Weighted Overlay Process for Social-Economic Factors ... 23
Table 9 Population distribution and density per village ... 25
Table 10Purposes of forest activities by households per village ... 26
Table 11Estimated areas of each zone of traditional land claim ... 29
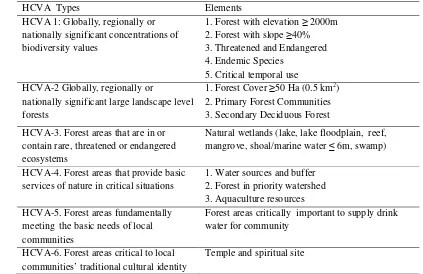
Table 12HCVAs and its elements used in assessment of existing conservation values within national park (FSC Toolkit, Adjusted) ... 32
Table 13Bio-physical analysis to delineate the priorities conservation areas based on FSC-HCVAs Landscape level toolkit. ... 33
Table 14Criteria used in delineation PCA-1 of Lore, Paitchao and Tutuala Forest Areas in zonation scheme for core areas ... 33
Table 15Check list in identifying high conservation values forests areas ... 35
Table 16Distribution of PCAs and Non PCAs covered in each village ... 36
Table 17Percentage areas of Priority Conservation Areas-1 ... 37
Table 18Protected plants species recorded in Jaco Island ... 37
Table 19Important birds recorded in Jaco Island ... 38
Table 20IUCN protected birds recorded in Paitchao-Tutuala Forest... 39
Table 21IUCN Protected plants recorded in Paitchao-Tutuala Forest ... 39
Table 22IUCN protected birds recorded in Lore Reserve ... 40
Table 23IUCN protected Plants Species recorded in Lore Reserve ... 40
xvii
Table 25Percentage of natural wetlands that form PCA-3... 42
Table 26Coastal line in national park ... 44
Table 27North coastal habitat on natural wetland... 44
Table 28Percentage areas of Priorities Conservation Areas-4 ... 45
Table 29Land cover in transition areas per village ... 47
Table 30Livestock distribution per village ... 47
Table 31Population pressure scores in each village ... 49
Table 32Household forests activities score scored in each village per zone ... 52
Table 33Estimated areas in traditional land claim by community ... 53
Table 34Distribution zones within village based of priorities conservation areas based on ecological analysis... 56
Table 35 Determination of zones by combining the ecological assessment and social-economic components of each village ... 56
Table 36Criteria in designing zonation for NKSNP ... 57
Table 37Zones areas distribution per village ... 59
xviii
LIST OF FIGURES
Pages
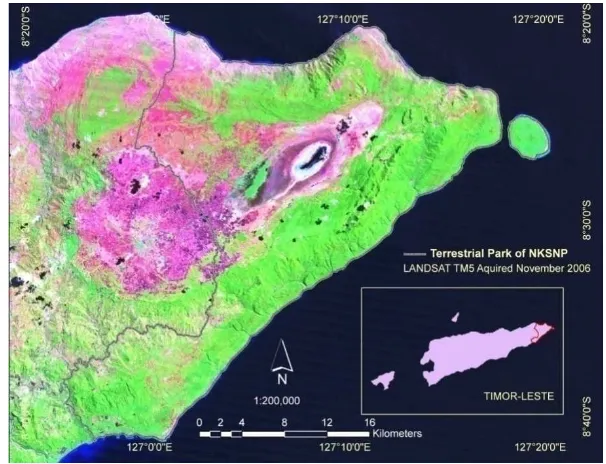
Figure 1 Map area of study ... 13
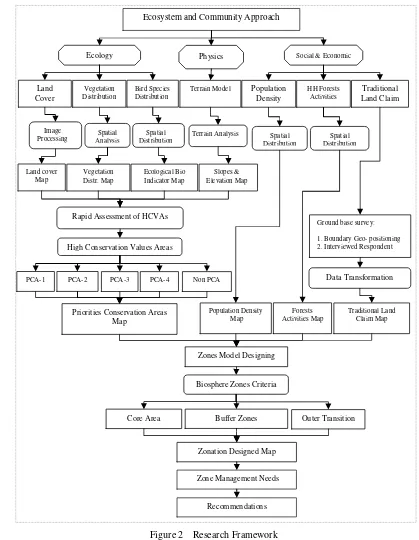
Figure 2 Research Framework ... 15
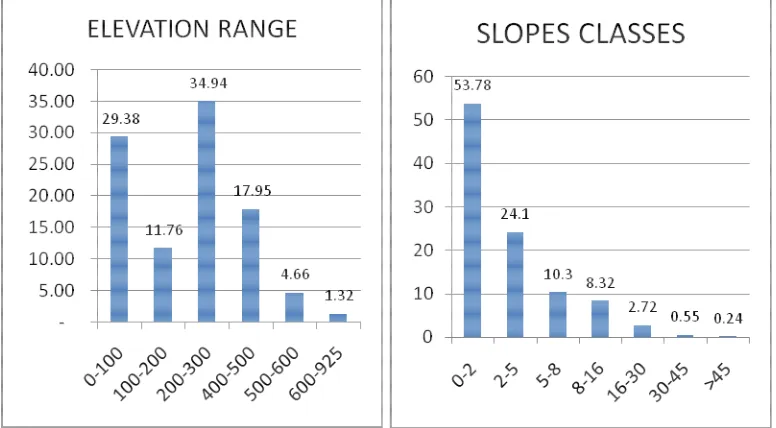
Figure 3 Percentage areas of elevation and slopes distribution within national park ... 17
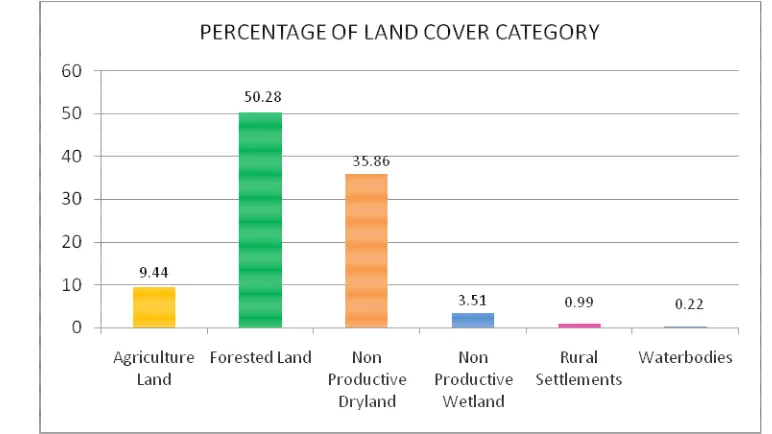
Figure 4 Distribution covered area by each land cover class. ... 18
Figure 5 Land cover classification based on Landsat TM5 Nov 2006 ... 19
Figure 6 Spatial distribution sites in bird survey, interpolated used IDW Method ... 21
Figure 7 Dominant trees species listed in IUCN as protected species ... 22
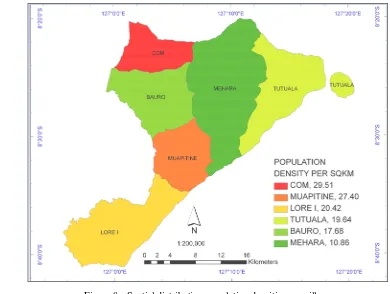
Figure 8 Spatial distribution population densities per village ... 25
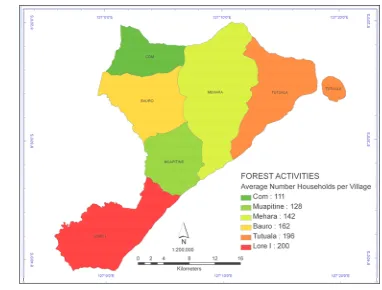
Figure 9 Spatial distribution households in forests activities per village ... 26
Figure 10 Example of traditional boundary marker amount Ratu claim ... 28
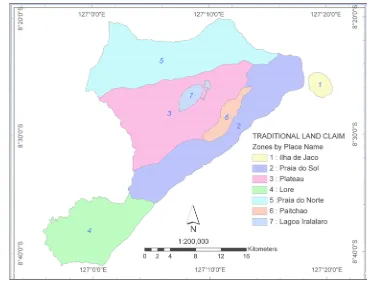
Figure 11 Zone of traditional land claim by communities. ... 29
Figure 12Flows in building zonation for NKSNP adopting the Biosphere Reserve Zones (Herwinda 2006, modified). ... 31
Figure 13Priorities Conservation Areas delineated based on HCVAs, PCA-4 (purple), PCA-3 (blue), PCA-2 (orange) and PCA-1 (green). ... 37
Figure 14 Rasterization processes in analyzing population pressure to the conservation areas ... 50
Figure 15 Spatial distributions pressure of population density to PCAs per village ... 50
Figure 16 Rasterization processes in analyzing the household forests activities pressure to the conservation areas ... 52
Figure 17 Spatial distributions the pressure of household forests activities to PCAs per village ... 52
Figure 18 Traditional land claim zones areas based on places name. ... 53
xix
LIST OF APPENDICES
Pages
Appendix 1 List of GCPs Tracking on High Conservation Areas Assessments .. 67
Appendix 2 Ground Control Points, Thcino-Lori ... 68
Appendix 3 Ground Control Points, Sapuru-East Com Beach ... 69
Appendix 4 Ground Control Points on Com Beach-Fauna ... 71
Appendix 5 Ground Control Points on Numunira Lake-Flora... 72
Appendix 6 Ground Control Points on Numunira Lake-Fauna ... 73
Appendix 7 Ground Control Points on Numunira Lake Landscape ... 74
Appendix 9 GPS Points on Ratu Boundary Identification, Beaches. ... 78
Appendix 10 GPS Points on Culture Sites ... 79
Appendix 11 GPS Points on Farming Spots ... 80
1
I.
INTRODUCTION
1.1 Background
Nino Konis Santana National Park (NKSNP) is the only one of the world class protection area that existed under Timor-Leste jurisdiction. It is a lived-in protected area which covered six villages and home of more than 12,000 peoples. About 87.7% of household’s main economic activity is owned food crops and livestock farming (NASS 2007). The actual community condition is poor and highly dependency on the exploitation of forests resources.
As a new national park that has just been declared by the government on 1st August 2008, there are many challenges that experiencing. One of these challenge that faced by national park authority is since its declaration till nowadays has not established yet a zonation to address a proper management. A clear zonation necessary to be establish early in order to reach the aims of establishment the national park, which underlined by the Ministry of Agriculture Forestry and Fisheries as national park authority. These are such i) to protect and conserve important natural and cultural values, ii) to contribute to the achievement of sustainable livelihoods for local communities, iii) to establish the first protected area in Timor-Leste’s world-class protected area system, iv) to increase awareness of conservation and the sustainable management of biodiversity and natural resources, v) to ensure the active participation of and foster ownership by the communities in the protected area, and vi) Manage the NKSNP as an internationally recognized protected area where the traditional interactions of people and nature are maintained in a way that protects the environment (MAFP, 2006).
2 cover distribution and general wetlands distribution within the national park area. Terrain models such elevation and slopes generated based on height points of USGS SRTM data. Fieldwork and literature study enrich the basic data that required for designing the zoning system for the national park. Spatial distribution of threatened species of trees and bird generated based on previous study; this is done by conduct spatial analysis in the mapping processes. These ecological and biophysics data are used as criteria in the rapid assessment of high values conservation areas that occurred within the study area. The HCVAs identified are as basis in delineation of priority areas to be conserved. Priority conservation areas which have bio-centric functions then assigned as Core Area, while the anthropocentric assigned as buffer zones.
It is important to note that a degradation and change of ecosystems are something that unavoidable, since human and nature are interacted each other. Socio-economic factors such population density and household forests activities considered as affecting factor to conservation priorities areas in processes of designing the zonation. As human well being is improved time to time, increasing population density, physical development such settlements are such factors that enforce on the loosing of biodiversity.
Several points of recommendation have formulated based on ecological, physics and social economic factors were analyzed related to the management zoning system for NKSNP. Rest expectation that the model of zoning system that designed throughout of this research would contribute the national park authority in order to decide suitable development strategies for national park based on its zoning.
1.2 Problem Statement
3 produced a zonation map and its management needed. The approach were done by integrated the Remote Sensing and GIS Technology application in the assessments of high values of conservation areas as ecological factors and population density and household forests products gathering, both as affecting factors that given pressure to conservation areas.
1.3 Goals and Objectives
The goal of this research is to design a model of zonation for Nino Konis Santana National Park (NKSNP). To this end, research activities were focused on exploratory of four main aspects such as:
1. To assess the values of conservation areas
2. To evaluate the related socio-economic factors villagers dynamics to the natural resources
3. To assess the traditional land claimed by the community. 4. To design the better zonation of the NKSNP
While, at least the objectives of the study is to get better management process, approach, as well as the management efficiency, effectiveness and results. For further hope, it is useful for reaching a better conservation actions and example through the national park best learnt.
1.4 Scopes of Analysis
Considered to the challenges in this study, data analysis just limited only several points such follows:
1. Biophysics factors focused on forested lands and wet lands of terrestrial park of NKSNP
2. Household forests activities analysis conducts by downscale NASS 2007 Lautem District to six villages within study area
3. Population density analyzed by explored the GPS Waypoints of TL Housing and Population Census 2004 with required field data updated 4. Rapid ground based survey for traditional land claim in a very short time
4 5. FSC Toolkit Landscape Level in considering to Timor-Leste Forestry Law (Draft) used to carried out a preliminary assessment the occurrence of high conservation values areas and delineated the priorities conservation areas
1.5 Outputs
5
II.
LITERATURE REVIEW
2.1 Ecosystem
An ecosystem or ecological system as a basic to the conservation of natural resources, its sustain life on biosphere, provided ecological services through cleaning up and absorption of pollution, protecting coastline, supplying wildness food from fish to bush meat, conserving genetic resources for crops, maintain soil and hydrology, these are only a few kinds of ecosystems function that existed. Its play crucial roles on human survive and prosperity, forest stimulates local rainfall and prevents erosion and soil loss, coral reef and mangrove protected coast from abrasion and guard sea level rise.
6 natural and or human made water bodies that are flooded with fresh brackish or salt water including marine waters whose depth is not more than six meter during low tide and are located within wetlands. Commonly know that two types of wetlands, natural and artificial. Natural wetlands consist of mangrove, peat swamp, freshwater swamp, sea-grass, coral reefs and lakes, while artificial wetlands are paddy field, fishpond and freshwater pond.
2.2 National Park
A national park is a reserve of natural or semi-natural land, declared or owned by a government, set aside for human recreation and enjoyment, animal and environmental protection and restricted from most development. In 1969 the IUCN (International Union for the Conservation of Nature and Natural Resources) declared a national park to be a relatively large area with particular defining characteristics.A national park was deemed to be a place:
• with one or several ecosystems not materially altered by human exploitation and occupation, where plant and animal species, geomorphological sites and habitats are of special scientific, educative and recreative interest or which contain a natural landscape of great beauty.
• the highest competent authority of the country has taken steps to prevent or eliminate as soon as possible exploitation or occupation in the whole area and to enforce effectively the respect of ecological, geomorphological or aesthetic features which have led to its establishment.
• visitors are allowed to enter, under special conditions, for inspirational, educative, cultural and recreative purposes.
In 1971 those criteria were further expanded upon leading to more clear and defined benchmarks to evaluate a national park. These include:
• a minimum size of 1,000 hectares within zones in which protection of nature takes precedence
• statutory legal protection
• a budget and staff sufficient to provide sufficient effective protection
7
2.3 Socio-Economic Factors
Pressures on forests, included high population growth rates, has increased demands on land for farms, particularly in industrial enterprise based on natural resources such as timber and pulp industry while in developing countries demands on fuel wood and charcoal is recognized as the most timber cutting. Piecemeal forest removal has also fragmented forest regions, which has a disproportionate effect on species diversity by limiting the ecosystems ability to recover from catastrophes such as fires and reducing species mobility.
Complex socio economic pressure has caused degradation of ecosystems. Deforestation has multiple causes with the particular mix of causes varying from place to place. Kaimowitz & Angelsen (1998) revised several models of deforestation; i) direct agents and the underlying causes. Physical environment, agricultural price, timber price, wages and off farm employment, agricultural input price, technology, accessibility, property regime and strategic behavior are part of the direct agents. However, choices between the conservation and restoration of ecosystems and the continuation and expansion of human activities have to be made in the recognition of conflicts between the expansion of certain human activities and the continued provision of valued ecosystem goods and services. In making these choices, the economic values of ecosystem goods and services should be assessed and compared with the economic values of activities that may compromise them.
Human activities are the proximate direct affect the environment and thus constitute proximate sources of changes (Turner et al, 1990). Interms the change in land cover as biophysical attributes of the earth’s surface and land use as human purpose or intends applied activities that directly alter the physical environment. It might be interpreted as more immediate, direct factors, which originate from land use and directly impact upon forest cover. Land cover changes create conversion of forest to other cover types, with further environmental consequences that may ultimately feedback to affect land use.
8 have damaged wetlands by damming and canalizing rivers, converting floodplains to aquaculture, planting trees on bogs area that must be prevented from progressing, draining marshes for agriculture, forestry and urban development instead leaved it as originate for waterlogged area. Historically, agricultural activities has taken places as one of the most caused of damaged on wetlands including traditional wet pastures, drained to provided croplands.
2.4 Biosphere Reserve Concept
Biosphere reserve concept and its applications are described in a statutory framework know as Seville Strategy. A comparison of some key principles of the ecosystem approach and the Seville Strategy provided some evidence of the corresponding objectives between ecosystem approach and biosphere reserve.
Table 1 Ecosystem Approach and Biosphere Reserve Concept
Source: Man and Biosphere, 2002.
Ecosystems Approach Biosphere Reserve
The objectives of management of land, water, and living resources are a matter of societal choice
All local authorities have to be consulted and approve the nomination; the management of a biosphere reserve should be promoted as a part with society as a whole
Management should be decentralized to the lowest appropriate level
Support and involvement of local people has to be secured for the definition and implementation of management policy.
Ecosystems must be managed within the limits of their functioning
Biosphere resources should be extended to take into account fragmented habitats, threatened ecosystems and vulnerable environments.
The ecosystems approach should seek the appropriate balance between, and integration of conservation and use of biological diversity
Biosphere reserve constitute a tools for the conservation of biological diversity and the sustainable use of its components
The ecosystems approach should consider all forms of relevant information, including scientific and indigenous and local knowledge, innovations and practices
Information should flow freely among all concerned; the role of traditional knowledge in sustainable development should be recognized and encouraged
The ecosystems approach should involve all relevant sectors of society and scientific disciplines
9
2.5 Biological Indicator
Biological indicators are species used to monitor the health of an environment or ecosystem. They are any biological species or group of species whose function, population, or status can be used to determine ecosystem or environmental integrity. An example of such a group is the copepods and other small water crustaceans present in many water bodies. Such organisms are monitored for changes (biochemical, physiological, or behavioral) that may indicate a problem within their ecosystem. Bioindicator can tell us about the cumulative effects of different pollutants in the ecosystem and about how long a problem may have been present, which physical and chemical testing cannot (http://en.wikipedia.org/wiki/Bioindicator).
Bird’s data point that recorded during 2003-2004 in Timor-Leste by Colin Trainor including those that recording within national park could be used also as indicator of the ecosystem that existed. Information on each GPS points are included the habitat types such as forests and woodland, river estuary, beach and lake. This task carried out by using Spatial Analysis to maps the distribution of those species.
2.6 Imagery Interpretations
A valuable tool in the identification and characterization existed ecosystems and related land cover types are remote sensor technologies. These technologies measures and store the characteristics of variables of interest or related surrogate variables in a permanent record. They allow the collection of data over large areas in a relative short period as compared to 100% field sampling of the ecosystem.
10 Field et al., 1990; Jensen et al., 1992; Lunette and Balogh, 1999 (Lyon, 2005), emphasized that of the wetland ecosystems and the exposure of stressors on wetlands or adjacent ecosystems can best be met by an analysis of multiple sources of remote and in situ sensor data, GIS Databases, and models of wetland and water resource characteristics. Monitoring experiments require good quality data for initialization of the system and real-time delivery of data.
2.7 Spatial Data Analysis and Spatial modeling
Spatial data analytical techniques and spatial models can perform functions which, in the main, current GIS lack, but which are important for the sorts of question that decision makers in private and public organizations are interested in. (Manfred M. Fischer et al. 1996).
A model is an abstraction or simplification of reality (Odum 1975; Jeffers 1978; Duerr et al. 1979). When models are applied to the environment, it is anticipated that insights about the physical, biological or socio-economic system may be derived. Models may also allow prediction and simulation of future conditions, both in space and in time. The reason to build models is to understand, and ultimately manage, a sustainable system.
2.8 Previous Study
There are several study was done previously during preparation proposed national park that used as referenced for this research. Those are such as Vegetation and Flora Survey (Northern Territory Herbarium), Preliminary Inventory (the Ministry of Agriculture and Fisheries), Important Birds Areas (Colin Trainor) and Fataluku Forest Tenure (Andrew Mc William).
2.8.1 Flora and Vegetation Survey
11 with 391 taxa (54%) presently identified to species level. Three IUCN Red List Species for Timor-Leste & Indonesia were recorded in the Park (Intsia bijuga, Pterocarpus indicus, Santalum album). Additional species that may be threatened include Antiaris toxicaria, Neoalsomitra podagrica, Carallia brachiata and
Eleocharis geniculata. The area also contains significant populations of Cycas rumphii a taxon listed by IUCN as Near Threatened (Cowie, 2006).
In the previous year, a preliminary survey also carried out by the Ministry of Agriculture. Survey were conducted using tracking method at several point such as in Jaco Island (3 tracks), Paitchao Mountain Range (8 tracks) and Lore Reserve (4 tracks). Data that were recorded is the occurrence of tree species along tracking line and surrounding (approximately 200 meters on left and right). Statistical processes of this survey have indicated the distribution of four IUCN species within proposed national park. Intsia bijuga, Pterocarpus indicus, Anthiaris toxicaria and Elaeocarpus arnhemicus dominantly found in Paitchao Mountain Range Forest and Tutuala beach and adjacent forests (Santana F, 2005 unpublished report).
2.8.2 Important Bird Areas
Three important bird areas are existed within national park area. They are such as TL06 Lore, TL07 Mount Paitchao and Lake Iralalaro and TL08 Jaco Island. TL06 Lore is located about 40 km south of Lospalos. Twenty-four restricted-range species have been recorded, including the Endangered Timor Green-pigeon, and the Critically Endangered Yellow-crested Cockatoo also occurs there (FAO/UNDP 1982, Ora 2000, Trainor et al. 2004).
12
2.8.3 Fataluku Forests Tenure
Andrew McWilliams, Australian Anthropology Senior Researcher was carried out a study on the Fataluku Forests Tenure in the Proposed Nino Konis Santana National Park. A long ignored and subsumed within government regulations, customary tenures and local claims of Fataluku-speaking populations to the forestry zone remain substantially intact. The present of national park status in this region should foster the traditional owner right. However, since Portuguese period there is no legal document such map to describe the ownership even amount community they know their boundary of land claim in the field.
A detail GIS based survey in future is highly needed to mapping the traditional claim in the national park areas. During field work, were carried out a geo-positioning on land boundary amount community claim related to forests tenure in Fataluku customary. A coarse map has produced and divided the national park into seven zones.
2.9 The declaration of Nino Konis Santana National Park
Ecologically, there are five important biodiversity areas that combined in the national park status. They are such i) Lore Reserve Forests, ii) Mount Paichao Range, iii) Lake Iralalaro, iv) Jaco Island and v)Tutuala Beach and Adjacent Forest.
13
III.
METHODOLOGY OF RESEARCH
3.1 Time and Location
Research was conducted between March and October 2010. It consists of process develop method, analysis and reporting. Laboratory work was accomplish at MIT IPB Research Laboratory, while field works such gathering additional updated data related to method developed took place at Nino Konis Santana National Park, Timor-Leste.
Figure 1 Map area of study
Administratively, NKSNP is located at Lautem District, the Democratic Republic of Timor-Leste. It’s covered six villages’ areas, such Com, Bauro, Mehara, Tutuala, Muapitine and Lore I. It’s lied at coordinates -8o 16’ 48” to – 8o 43’ 48” S and 126o 55’ 12” to 127o 23’ 24” E. The total area is 1,231.34 km2, divided into terrestrial part (677 km2) and marine part (554 km2).
3.2 Data and Tools
[image:32.595.159.462.283.515.2]14 work done focused on exploratory of the previous documents during preparation for proposed the national park, share amount GIS Users.
Geographically, Timor-Leste located at UTM Grid Zone 51S and 52S, and the study area is located at UTM zone 52S. There is no national datum standard setup yet. But, GIS users used the UTM Zone 51S to project the country. A personal GIS Geodatabase for internal storage and also to perform the integrity of spatial data by conduct basic corrections on the topology errors and re-project the spatial reference, since there were un-uniform spatial references on spatial data have collected.
Table 2 List of vector, raster and descriptive data used
Table 3 List of hardware and software used
3.3 Research Framework
In order to reach objective of the research, a framework has designed to accumulate flows of thinking (Figure 2). There are three major essential variables in designing the zoning, such as ecology, physics and social economic. Research activity covered investigation, analysis processes, option evaluation or synthesis and the recommendation of to support the decision.
Data Format Custodian/Author Date
Administration Boundary Shapefile ALGIS-MAF 2001
National Park Boundary Shapefile ALGIS-MAF 2003
Land Cover Shapefile 2006
Dwelling Occupations Shapefile ND of Statictics of TL 2004
Coastal and Marine Habitat Shapefile ALGIS-MAF 2007
Landsat TM 5 TIFF ALGIS-MAF 2006
Topographic Map, 25k JPEG Bakosurtanal, INA 1993
Aerial Orthophoto ECW ND of Land and Property 2003
SRTM HGT USGS
Trees Species Distribution Descriptive Ian Cowie 2005
Important Birds Area Shapefile Colin Trainor 2003-2004
Lautem NASS Descriptive MAF 2007
Items Basic Functions Remarks
PC Dell Latitude Removable PC Intel ® Core™2CPU 1.83GHz 1.5GB
Handheld GPS GCPs ALGIS Properties
ArcGIS 9.2 Spatial data processes ALGIS Licensed ( ESRI®SS and 3D Analysis)
ER MAPPER 6.4 Image Processes MIT-IPB Licensed
Global Mapper 9 Spatial data processes ALGIS Licensed
15 Figure 2 Research Framework
3.4 Data Preparation
Spatial data generated is ecology, physics and social economic. Ecological data such land cover, distribution of endangered species of trees and bird. Physics data is the digital terrain model such as elevation and slopes. Non spatial data is the social economic data that indicated as major issues which have potential
Land Cover Traditional Land Claim Population Density Map Spatial Distribution Population Density HH Forests Activities Social & Economic
Ecology
Ecosystem and Community Approach
Rapid Assessment of HCVAs
High Conservation Values Areas
Core Area
PCA-1 PCA-2 Non PCA
Buffer Zones Outer Transition Priorities Conservation Areas
Map Traditional Land Claim Map Forests Activities Map Vegetation Distribution Bird Species Distribution Terrain Model
Zone Management Needs
Ground base survey:
1. Boundary Geo- positioning 2. Interviewed Respondent
Zones Model Designing
Spatial Distribution Spatial
Analysis Image
Processing Terrain Analysis
Land cover Map Vegetation Distr. Map Ecological Bio Indicator Map Slopes & Elevation Map Data Transformation
PCA-3 PCA-4
Spatial Distribution
Physics
Biosphere Zones Criteria
Zonation Designed Map
[image:34.595.98.517.80.620.2]16 impact to the conservation areas, such as population density, household forest activities and traditional forests land claim by community. Traditional forest land claim map is generated by assessing the traditional boundary in the field, using GPS device. This data layer provided information like distribution of Ratu Forest Claim in national park that must be taking into account when making a management decision. Even this right is not recognized yet under government low, but considering the aims of establishment of the national park is to conserve the community rights of land. Results of data preparation are described followed.
3.4.1 Terrain Model
Terrains model such slope and elevation generated using height points derived from USGS SRTM. First process is to crops the points of area of interest. This done using Global Mapper Program thence exported as text file with spatial resolution has resample the original resolution from 90 m x 90 m. Height point data (X, Y, and Z) that has geo-referenced thence interpolate to produce Triangular Irregular Network (TIN) as raster dataset to generate elevation and slope map. The use of height points data are given are smooth result in surfaces analysis but its less accurate at coast area.
Slopes classes derived from GTOPO30 data (EROS Data Centre, 1998) the Global Agro-Ecological Zones Study, Food and Agriculture Organization of the United Nations (FAO), Land and Water Development Division (AGL) with the collaboration of the International Institute for Applied Systems Analysis (IIASA), 2000.
Surfaces data analysis resulted about 88.19% of terrestrial park are flat (slopes <8%) and 11.81% other are with slope hilly to mountainous (slopes >8%). In table 4, showed the percentage of area based on slopes class in Nino Konis Santana National Park.
Table 4 Slope classes distribution
Slopes 0-2 2-5 5-8 8-16 16-30 30-45 >45
Area (km2) 364.4 163.3 69.8 56.4 18.4 3.7 1.6
17 Surfaces data analysis also produced elevation map for study area, as list in table 5 that the area is almost 94% dominated with elevation range between 0-500 meters, while areas above 500 meters to 925 meters only 6%. Elevation Map has indicated that within area of study are less than 2000 m. The highest point only 925 m and its meaning no area fit to the HCVA 1.1 protected places with elevation > 2000 m.
[image:36.595.119.507.215.429.2]Figure 3 Percentage areas of elevation and slopes distribution within national park
Table 5 Elevation classes distribution
Elevation (m) 0-100 100-200 200-300 400-500 500-600 600-925 Total Area (km2) 198.98 79.64 236.64 121.59 31.54 8.91 677.30 % of Area 29.38 11.76 34.94 17.95 4.66 1.32 100.00
3.4.2 Land Cover Classification
18 Land cover classification has produced information on percentage of covered area of the Terrestrial Park by each of land cover category. There are four categories such, Agriculture Land, Forested Land, Non Productive Dryland, Non Productive Wetland and Water Bodies. Agriculture Land covered 63.89 km2 or 9.44% and consisting of four classes such as Food Crops Arable (49.76 km2 or 7.35%), Rice Field (2.91 km2 or 0.43%) and Smallholder Crops (11.22 km2 or 1.66%). Forested Land is general forests class, covered 340.55 km2 or 50.28%. Non Productive Dryland covered 242.86 km2 or 35.86% and consisting of three classes such as Bareland (29.85 km2 or 4.41%), Grassland (73.71 km2 or 10.88) and Woodland (139.3 km2 or 20.57). Non Productive Wetland such shrubs covered 27.35 km2 or 3.51%. Rural Settlements such Village and Mixed Garden are covered 6.69 km2 or 0.99%. Waterbodies such Lake is covered 1.49 km2 or 0.22%.
[image:37.595.112.498.357.574.2]19 Table 6 Percentage of land covers classes divided per category
Category Class Area (km2) % of Area
Food Crops Arable 49.76 7.35
Ricefield 2.91 0.43
Smallholder Crops 11.22 1.66
63.89 9.44
Forested Land Forests 340.55 50.28
Bareland 29.85 4.41
Grassland 73.71 10.88
Woodland 139.3 20.57
242.86 35.86
Non Productive Wetland Shurbs 23.75 3.51
Rural Settlements Village and Mixed Gradens 6.69 0.99
Waterbodies Lake 1.49 0.22
Agriculture Land
Total Agriculture Land
Non Productive Dryland
Total Non Productive Dryland
Figure 5 Land cover classification based on Satellite Imagery Landsat TM5 Nov 2006
3.4.3 Important Bird Areas
20 Pigeon and Wetar Ground dove. Only two of these the cockatoo and green pigeon occur in the Nat Park. All Globally Near threatened birds – about 15 species (Colin Trainor, Pers. Comm. December 2010).
Colin Trainor on 2003 has listed almost birds’ species and collected its geo-positioning by using GPS device and data stored in tabular format. Through spatial data analysis has modeled a mostly good quality habitat of birds within national park. Distribution sites of birds developed aims to indicate areas that need to be considering as habitat of endangered, threatened, near threatened and restricted range Timor Birds to fulfill the High Conservation Values Assessments.
21 Figure 6 Spatial distribution sites in bird survey, interpolated by inverse distance weighted.
3.4.4 Threatened Trees Species Distribution
The aim of plant species distribution mapping is to identify species that threatened under IUCN List. Preliminary survey during the preparation of the declaration of the national park that was conducted in 2005 by Fernando Santana, was implemented transect data record within three target protected areas such Jaco, Paitchao-Tutuala and Lore Reserve. Survey was applied transect line by observing within radius 200 meters from estimated track line at three different area, Jaco Tutuala and Lore. Data recorded is number of trees species that counted along the track line and stored as tabular format. Statistical data processing is applied to identify dominants tree species, endangered, near threatened, threatened and red list species that must be considered as high values forest that would be protected.
Table 7 IUCN protected trees species recorded within several points on surveyed
Local Name Scientific Name Family Paitchao Jaco Lore IUCN
Aina Pterocarpus indicus Fabaceae 465 5 105 Red List
Aibesi Intsia bijuga Fabaceae 128 0 29 Red List
Aimanuhirus Anthiaris toxicaria Moraceae 43 0 9 Red List
Valuvalur Elaeocarpus arnhemicus Elaocarpaceae 16 7 0 Threatened
Note: Data in Paitchao, Jaco and Lore are numbers of frequency counted
Unfortunately data was recorded without geo-positions marking, and it’s difficult to plot into spatial distribution. Through this data processes discovered the trends of trees that most frequent. Table and figure below are described IUCN protected plants species frequency counted by transect of Tutuala Forest, Jaco Forest and Lore Forest. Appears that Tutuala Forest is the most high frequents of four protected species, while Jaco only recorded two protected species with less number and Lore Forest with three protected species on IUCN Red List on
Pterocarpus indicus, Intsia bijuga, Anthiaris toxicaria and no record for
22 Figure 7 Dominant trees species listed in IUCN as protected species
3.4.5 Social Economic Factors
Since there were no public data available for household income and village revenue social economic data analysis considered only to two available data, such population density and forests activities by households. Forests activities are explored from Nacional Agriculture Sample Survey 2007. While number of population counted from each attribute of GPS Waypoints of Timor-Leste Census of Population and Housing 2004 and were upgraded during the fieldwork. Each of points was recorded attributed by number of family members. Analysis of social economic factors as state in methodology are by converting available descriptive data into spatial standard in order to have a spatial format which able to overlay to each other layers.
23
Vi = Ci/100 * ∑ HH (1)
Where;
Vi is Village i (HH/Village)
Ci is Criterion under consideration (%) and
∑ HH is Total Household (HH/Village)
Once attributes for each village of those social economic data has inputted, its store in different class and format of data. Before converted into raster grid format, must be done normalization of attributes. Normalization method adopted here is range 0-1. That’s mean ‘zero’ is the lower perform and ‘one’ is the high perform. Malczewski (1999), there are many methods to standardized criterion map, and one of the ways is by using linear scale transformation. Benefit criterion is used as new values in which the highest score (score = 1) represent the better performance, and contrary (score = 0) is worst performance. Standardization of attribute done follows the Benefit Criterion Equation below.
Xij X’ij = Ximax Where;
X’ij = standardized score for the ith object (alternative) and the jth attribute Xij = the row score
Ximax = the maximum score for the jth attribute
A simplest method of rank order established to given the weights to social economic components based on attributes of data embedded. Weighting is aim to convert the descriptive data format into spatial data format.
Table 8 Score in Weighted Overlay Process for Social-Economic Factors
Score 1 2 3 4 5
Mean Very Low Low Medium High Very High
Scoring Basis are the spatial attributes of each raster layer which reclass using Natural Break (Jenk) Method, scale 1-5 by 1. Classes are based on natural groupings inherent in the data. ArcMap identifies break points by picking the
24 class breaks that best group similar values and maximize the differences between classes. The features are divided into classes whose boundaries are set where there are relatively big jumps in the data values (ArcMap ESRI Tutorial). Raster layers of each social economic criterion such population density and Household Forests Activities in the zonation scheme analysis done through weighted overlay of referred layers.
3.4.5.1 Population Density
Population pressure is the social factors that might affects conservation areas. A high population number are would give high pressure to conservation areas. During field work data updated, indicated that 12.716 peoples are lived within national park areas. All six villages covered within national park are categorized as rural villages. Statistics data processed has produced a population density map for six villages of area study. Furthermore analysis is the density population attributes have been normalized within new values range from 0-1 (Low-High). Normalized weight values thence to re-evaluate in classes within scale 1 to 5 by 1 based on ArcMap Natural Break (Jenks). Classes generated are based on natural groupings inherent in the data. ArcMap identifies break points by picking the class breaks that best group similar values and maximize the differences between classes. The features are divided into classes whose boundaries are set where there are relatively big jumps in the data values.
25 Table 9 Population distribution and density per village
Village Area (km2) HH1) No Pop 2) Pop Den3) Score Pressure Mehara 189.91 454 2,063 10.86 1 Very Low Bauro 98.94 518 1,750 17.69 2 Low Lore I 133.26 640 2,722 20.43 3 Medium Tutuala 119.19 625 2,342 19.65 3 Medium Muapitine 75.97 408 2,082 27.41 4 High Com 59.53 354 1,757 29.51 5 Very High
Total 676.80 2,999 12,716 20.92
Notes:1) households, 2) Number of Population, 3) Population Density
Figure 8 Spatial distribution population densities per village
3.4.5.2 Household Forest Activities
26 Data analysis on number of household gathered forests products resulted that Com, Mehara and Muapitine Village are ‘low’ number. Tutuala and Bauro are ‘medium’ number of households and only Lore I that are high number of households in gathering forests products.
Figure 9 Spatial distribution households in forests activities per village
Table 10 Purposes of forest activities by households per village
Village HH1) FW 2) BM 3) Food Average HH Score Pressure Com 354 130 155 47 111 1 Low Muapitine 408 150 179 55 128 2 Low Mehara 454 167 199 61 142 2 Low Bauro 518 190 227 69 162 3 Medium Tutuala 625 229 274 84 196 3 Medium Lore I 640 235 280 86 200 4 High
Total 2,999 1,101 1,314 402
Notes: 1) Number of Households, 2) Firewood, 3) Building Materials
3.4.5.3 Traditional Land Claim
[image:45.595.112.494.166.456.2]27 and the vital inheritance of their ancestors. Product of this assessment is Community Traditional Land Claim.
During field work, 34 respondents were interviewed for their opinion and perspectives on forests use that claim by each of group of family which called Ratu. The respondents were interviewed are youth, oldest, women, professionals and government officer. The most respondent are addressed within the national park area, and them that selected in the interviewed processed are the oldest first, because the reason is that the oldest man considering know the historic of the land and forest tenure claimed by each Ratu including give an indication regarded to boundary amount Ratu land. The interview method is recording documents, since many of oldest were will only able to speak in local language (Fataluku). The recorded interviewed data then analysis through re-interpretation through translation into Tetum, the national language. Several principals’ points were concluded as issues that need further treatments, such as:
1. Traditionally the whole part of Terrestrial Park were divided into pieces of land that belonging to the each group of Ratu as it’s already exist for long time in the pass. That’s mean that every management zone will encompasses Ratu land.
2. Regarded to the park management, basically community is having positive responds by wishing to participate at the whole conservation areas. Community asked for defining the definitive boundary of land to emphasize these areas which is allowed and restricted or limited accessed only.
3. Capacity building for youth within Sucos of park area by establish training center for foreign language and touristic techniques and guides.
28 5. Develops potential sites on tourism that ecologically. The eco-tourism concept is suitable to adopt in the development of tourism side in the national park. Since all features in the park land is claimed traditionally by Ratu group, the management of tourism sites is should be by the Ratu owner and under Park Authority monitoring.
Boundary land between Ratu traditionally demarcated and the point of place considered and believed to be sacral. Marked that used is consist of a wood as pole and constructed surrounded with stones. Each of Ratu has theirs different type of wood, motives and meaning. Those demarcated points are also considered as sacral sites that necessarily the owners will do rituals ceremony (Figure 10).
Figure 10 Example of traditional boundary marker amount Ratu claim
29 Figure 11 Zone of traditional land claim by communities.
Table 11 Estimated areas of each zone of traditional land claim
Place Name Jaco Praia do Sol Plateau Lore Praia do Norte Paitchao Iralalaro
Zone 1 2 3 4 5 6 7
Area (km2) 11 158.11 118 180.53 158.11 11.25
[image:48.595.123.490.82.364.2]30 of Ratu forested land claim within the conservation areas by grouping into zone. It’s recommended for future survey to complete the Ratu forest land claim map.
Every Ratu zones areas are encompasses the priorities conservation areas except the Plateau zone that has not identified high conservation values and it’s automatically became transition zone. During the field work has assessed almost the Ratu name and their distribution forest area claim by locality, only small boundary that was marked using GPS device (Ratu name listed in appendix).
3.5 Zonation Scheme
In this study, zones designed based on the PCAs delineated through HCVAs preliminary assessment. The national park is adopted IUCN Category V, which is not compatible to have a core area in the management purposes. This mean that all PCAs delineated to be managed as buffer zones only if referred to the IUCN Category V, but in case of the NKSNP, for national interest in conservation of biological diversity, it is necessary to manage a part of PCAs as core of ecosystem. The PCA-1 on protected places defined to be managing as core area within NKSNP. This is aim constituted area that devoted to long-term protection, according to the conservation objectives of the biosphere reserve and of sufficient size to meet these objectives.
Non PCA-1 such PCA-2, PCA-3, and PCA-4 assigned as buffer zones which surrounded the core area. A buffer zone or zones clearly identified and surrounding or contagious to the core area or areas, where only activities compatible with the conservation objectives can take place, aims to ameliorate external pressures. In other words buffers zones defined as areas adjacent to protected areas, on which land use is partially restricted to give an added layer of protection to the protected area itself while provided values benefits to rural neighboring communities (Wells and Brandon 1993). However, that there are few studies that test the effectiveness of buffer zones, and most of those have focused on the socio-economic as opposed to the ecological buffering functions.
31 between these core units need to be established or strengthened. An outer transition area where sustainable resource management practices are promoted and developed, transition area as a linkages to maintain connectivity between these core units need to be established or strengthened. The concept of connectivity refers to how the spatial arrangement and the quality of the elements in the landscape affect the movement of organisms among habitat patches (Bennet, 2003).
The patches areas either it is fulfill the criteria as core or buffer but it is distributed separately in a small size then considered to belonging the main zone surrounded, for example that an area that has values as core area but it is only a small in size and located surrounded buffer then it would be grouped as buffer zone (Figure 12).
Figure 12 Flows in building zonation for NKSNP adopting the Biosphere Reserve Zones (Herwinda 2006, modified).
3.5.1 Rapid Assessment of High Conservation Values Areas
High conservation values areas (HCVAs) consists of broad category which is internationally known as protected forests, wildlife habitat, vulnerable ecosystem, areas with functions to support fundamentals of live system, and areas that considered have traditional identity. Considering the components for each category, slopes and elevation are use to determine the protected forests; forests cover and forests areas as function for wildlife habitat; wetland is the critical
No Yes
Yes Yes
NKSNP
PCA-1 PCAs HCVAs
Core
Non PCA-1
Outer Transition
Surrounding Core
Buffer
[image:50.595.228.424.333.519.2]32 ecosystem; aquifer, watershed and aqua-culture sources are areas with live support system; and historical sites are areas as traditional identity.
Table 12 HCVAs and its elements used in assessment of existing conservation values within national park (FSC Toolkit, Adjusted)
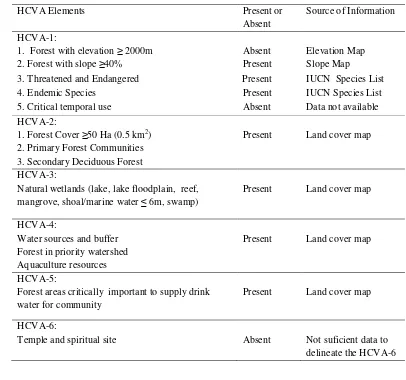
Internationally, there is six types of HCVAs, the idea of was developed by the Forest Stewardship Council (FSC) and first published in 1999. Since Timor-Leste has no particular HCVAs yet, the preliminary assessment of HCVAs in this study is mainly based on Indonesia HCVA Toolkit with small adjustment to the Timor-Leste Forest Regulation Draft. Assessment mainly based on the information that generated for this study such as slopes and elevation map, land cover map, IUCN Protected Species in flora and fauna.
3.5.2 Delineation of Priorities Conservation Areas
Priorities conservation areas is product of assessment of high conservation values areas. Table 13 concluded the associated FSC toolkit, regional and national law and regulation that used to identify the high conservation values which existed within the study area. There are several legal based that integrated with FSC toolkit and RAMSAR Convention to perform the biophysical factor analysis,
HCVA Types Elements
HCVA 1: Globally, regionally or nationally significant concentrations of biodiversity values
1. Forest with elevation ≥ 2000m 2. Forest with slope ≥40% 3. Threatened and Endangered 4. Endemic Species
5. Critical temporal use HCVA-2 Globally, regionally or
nationally significant large landscape level forests
1. Forest Cover ≥50 Ha (0.5 km2) 2. Primary Forest Communities 3. Secondary Deciduous Forest
HC