SUPPLIERS SELECTION MODEL
USING FUZZY PRINCIPAL COMPONENT ANALYSIS
Pipit Sari Puspitorini1*, Very Effendy2
1,2 Industrial Engineering Departement, Engineering Faculty, University of Islam Majapahit
Jl. Raya Jabon Km 0,7 Mojokerto *Email: [email protected]
Abstract
Selection Supplier is Multi Criteria Decision Problem (MCDP) which is one of the main key in maximizing the total value for sustainable company. The study present at the construction company Indonesia. The product of construction company is box culvert . This study models the integration of fuzzy method and Principal Component Analysis (PCA). The objective of the research is to determine the best model of suppliers selection on based five criteria’s such as quality, performance, flexibility, relationship and cost. Fuzzy method is used to deal the vagueness of subjective judgements and finding criteria weight and then PCA utilize data reducing, eliminating multicollinearity among them and ranks suppliers. The suppliers of cement, gravels 10/20, gravels 5/10, sands and iron are considered in this study. For solving the problem, this study uses software statistiXL. The results show that the suppliers can be classified based on Principle Components (PCs). The best suppliers for PC1 is sands (s9, score 0.890, criietria C), PC2 is gravels 10/20 (s7, score 0.634 criietria R). The first two PC(z1 and z2) are PC1= 0.131Q+0.218F+0.758P+0.821R+0.914CdanPC2=(-0.931)Q-0.043F-0.382P+ .304R+0.188C Keywords: Criteria , Fuzzy, Multi Supplier, Principal Component Analysis and Raw
material
Abstrak
Pemilihan supplier adalah Multi Criteria Decision Problem (MCDP) yang merupakan salah satu kunci utama dalam memaksimalkan total nilai perusahaan secara berkelanjutan. Studi dilakukan pada perusahaan Konstruksi di Indonesia dengan produknya box culvert. Model studi ini mengintegrasikan metode fuzzy dan Principal Component Analysis (PCA). Tujuan dari studi ini adalah untuk menentukan model terbaik dari supplier berdasarkan lima kriteria, yaitu kualitas, kinerja, fleksibilitas, hubungan dan biaya. Metode Fuzzy digunakan untuk menangani masalah ketidakjelasan dalam penilaian subjektif dan menentukan pembobotan kriteria. PCA digunakan untuk mengurangi data, menghilangkan multikolinearitas di antara data dan merangking supplier. Studi ini dilakukan pada perusahaan konstruksi. Produk perusahaan konstruksi ini adalah box culvert. Supplier terdiri dari semen , kerikil 10/20, kerikil 5/10, pasir dan besi. Pemecahan masalah studi menggunakan software statistiXL. Hasil studi menunjukkan bahwa supplier dapat diklasifikasikan berdasarkan komponen utama (PC). Hasil studi juga menunjukkan bahwa supplier terbaik untuk PC1 adalah pasir (S9, skor 0.890, kriteria C), PC2 adalah kerikil 10/20 (S7, skor 0,634, kriteria R). Terbentuk dua PC(z1 dan z2), yaitu PC1 dan PC2. PC1= 0.131Q+0.218F+0.758P+0.821R+0.914C dan PC2=(-0.931)Q-0.043F-0.382P+ 0.304R+0.188C
Kata kunci: Kriteria , Fuzzy, Multi Supplier, Principal Component Analysis and Raw
Material
1. INTRODUCTION
and services comprise up to 80% in high techonogy companies (Chou and Chang, 2008). Meanwhile, selection of the right supplier plays a key role because it are the great importance as triggers for sustainable supply chain (Buyukoztan and Cifci, 2011). Satisfying the customer with the high quality products in the short lead time and lowest cost is a key for any organization to succed in the global market. On the other hands, according to Aksoy and Ozturk (2011), improving the quality products and reducing the cost and time to market is important role in selection and evaluation. The suppliers selection could also decrease production lead time, increase customer satisfaction and strenghten company competitiveness signifacantly. The trade-offs between the tangible and intangible components which include quantitative and qualitative factors are identified by multi criteria problem. Previous studies reported that there are two main approaches in supplier selection. They focus on selecting criteria’s and methods. For example, the selection of criterias had been done by Dickson (1996) who outlines research based on 279 purchasing managers and 23 criterias for selection suppliers. Dickson was pioneering research in suppliers selection criteria. Some methods which are are used for selection of suppliers such as fuzzy and preference programming (Lin, 2009), Fuzzy and QFD (Amin and Razmi, 2009), mathematic programming application as integrated ANP and MOMILP (Ustun and Demirtas, 2009), AHP such as integrated AHP and nonlinear integer, and multiple objective programming (Kokangul and susuz, 2009).
Dealing with the uncertainty, prior research develops fuzzy set theory. Using fuzzy set theory, decision makers are no longer forced in a precise and rigid form to formulate the problem. The method covers multiple attributes and accessible. According to Amid, Ghodsypour, O’brien (2010), the best tool to handle uncertainty, the presence of vagueness and imprecision of information in the criteria selection problem, is fuzzy set theory. Wu (2010) develops a fuzzy multi objective programming for supply chain outsourcing risk management with consider quantitative and qualitative risk factors. Decision makers could perform trade-offs analysis such as cost, on time delivery quality acceptance levels and risk factor, while research in PCA, which was developed by Lam and Hu (2005), reviews elimination the multicollinearity, assign weight and forms new variables without much loss information. Lam, Tao and Lam (2010) believe that using integrated fuzzy and PCA could measure subjective decision makers.
This study proposes an integrated methodology fuzzy and Principal Component Analysis (PCA). Fuzzy is used to consider qualitative data includes subjective judgement of decision makers for uncertainty environment and PCA ranks the suppliers based on compress data and eliminating multicollinearity among them. The proposed model has been applied for Indonesian construction company. This study considers several criterias such as quality, flexibility, performance, relationship and cost. The criterias are generated based on brainstorming with experts consisting of researchers and managers of production, quality control, production planning and inventory control supervisors. The total suppliers involved in this study are 15 suppliers of five raw materials. The raw materials includes cement, gravels 5/10, gravels 10/20, sands and irons. For solving this study using software StatistiXL
1.2. Fuzzy Concept
Figure 1. Trapezoidal curve repesentation Figure 2. Membership Fuction (Source: Zadeh, 1965) (Source: Zadeh, 1965)
The evaluation of each criteria is using corresponding linguistic. And corresponding fuzzy number of each linguistic term are fuzzy number Low (0, 0.1, 0.2, 0.3), Medium (0.4, 0.5, 0.5, 0.6) High (0.7, 0.8, 0.8, 0.9) and Very high ( 0.8, 0.9,1,1)
1.2. Principle Compenent Analysis
According to Sharma (1996), Principle Component Analysis (PCA) is a technique for forming new variables which are linear composites of the original variables.The other words, PCA is reduction data technique. It called reduction because compress a large number of variable to few data. The maximum number of new variables that can formed is equal to the number of original variables, and new variables are uncorrelated among themeselves. The advantage of using principle component analysis is multicollinearity can be avoided and new variables not be correlated. Hunteman (1989) note that the idea was originally conceived by pearson (1901) and independently developed by Hotelling (1993). Pearson (1901), finding lines and planes that planes that best fit a set of points in ρ-dimensional space and the geometric optimization problem. Hotelling’s approach finding the power models. The power models gives a simple algorithm for finding the first (largest) eigenvalue of covariance or correlation matrix and cooresponding eigenvector from which the first PC and its variance can derived. Similar to factor analysis in that both technique try to explain part of the variation in a set of observed variables on thes on the basis of a few underlying dimension is the goal of PCA (Dunteman,1989). The other main advantage of PCA (Smith, 2002), is found the patterns in the data and compress the data without much loss information.
According to Sharma (1996), perform a PCA by an algebraic explanation are : a. Geometric of PCA
Data which consists of 15 suppliers and 5 variables are presented into matrices. This step finds mean data, calculate the corrected data, correlation matrices and calculate the eigenvector and eigenvalues of the covariance matrix, choosing component and forming a feature vector.
b. Analytical Approach variables or new PC can be intepreted as loading. The loading is ilustrated as:
. ... (4)
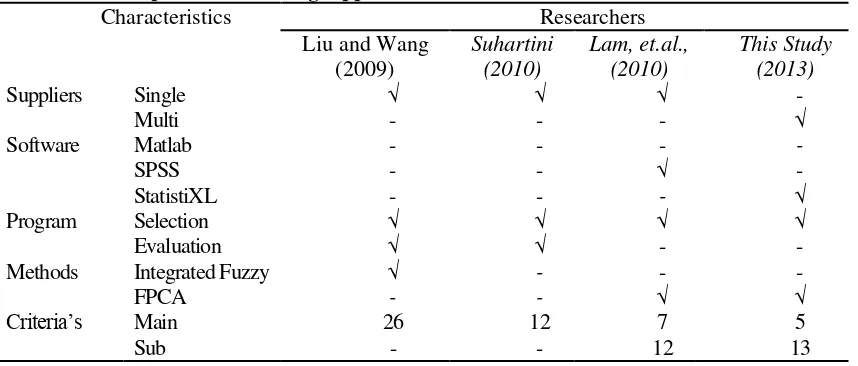
The best suppliers are interpreted by the highest score of eigenvalue. The eigenvalue for standardized data is greater than 1. Further research position is ilustrated on Table 1.
Table 1. Research position of selecting suppliers
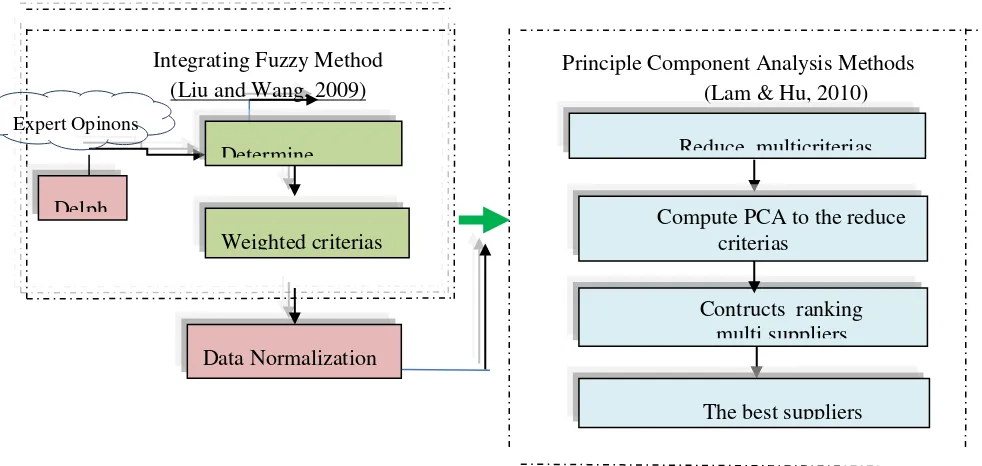
The proposed methodology in this study is Fuzzy Principle Components Analysis (FPCA) which consists of two main steps as follows:
Step 1. Integrating Fuzzy Method (Liu and Wang, 2009)
a. Determine criterias by reasearcher and experts using delphi brainstorming.
As we know, delphi brainstorming is a methods that assist experts to achive goal in integrate the opinions. The technique called as Delphi method. Delphi method is a judgment method and has a well procedures. The method design describes an appropriate quesionaires, judgemental in different circumstances. The criterias of evaluating suppliers are quality (Q), flexibility (F), performance (P), relationship (R) and cost (C). Construct model according to criterias and weight of each criterias. The evaluation of criterias have been identified and designed questionnaire. The aim is to
integrate the subjective judgement among the experts. Designing questionnaires are determined into two stages. Firstly, to preeliminary screening of evaluation criteria. Secondly, experts provide appraisal and weight based on performance rating criterias by using linguistic such as low, medium, high and very high. The suppliers consists cement, gravels 10/20, gravels 5/10, sands and irons.
b. Data Normalization.
To normalize criterias by using linear equation transformation (Lam, Tao and Lam. 2010):
... ... ( 5)
Step 2. Principle Component Analysis (Lam & Hu, 2010) a. Compute PCA
Data consist of 15 suppliers and 5 variables which are presents into matrices. Data set is changed into matrices with p variables and n samples.
Variance: ... (7)
The Covariance is measured of covariance among two variables.
... (8)
The Correlation matriks is a square root of the variance :
... (9)
and it has value between -1 to +1. If the value= 0, it is non linear between two variables. If value -1 is inverse linear elationship and value +1 is linear relationship
Eigenvector = measurement technique of the variance in a PC. Principle component formed by linear combination of the variables x1, x2, ...xp. The equation is
ζp = w11 x11 +w12x2 +....+ w1pxp ... (10)
Note :
Xik =mean corrected of ith observation for the kth variable
SS = Sum of square
Xij =mean corrected of ith observation for the jth variable
Df = degrees of freedom
Sjk =covariance among variables j and k, xij
n = the number of observations
SCP = Sum of the cross products
b. Ranking multi suppliers
The loading explains correlation of original variables and Principle Component. Original variables contributes to the Principle Component if it has high loading and vice versa. The eigenvalue (loading factor) greater than one is a default for standardized data. The loading is ilustrated as:
... (11)
c. The best suppliers
The higher eigenvalue of variable explains principle component score has influence and vice versa.
Figure 3. The framework of purposed multiple suppliers model
3. RESULTS & ANALYSIS
Based on the results of using statistiXL software, procedure mean corrected was applied to perform PCA as visualized in its results. Each mean corrected of fifth suppliers are zero. A plot of mean corrected data in five dimensional space while the variances of fifth variables greather than 1 and total variance is 0,6 %. The main objective is to select the best suppliers and which criterias they select.
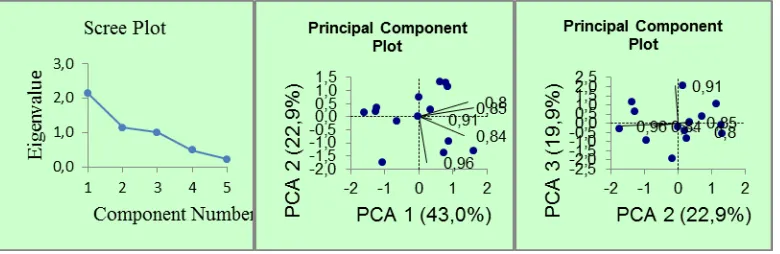
As shown in table 3 that new variables formation are formed into five principle components and the variance of the five variables are extracted. The tables explains the eigenvalues with the variance and cumulative percentage of variation. The eigenvalues is 2,148 which is 42,957% of the sum of the eigenvalues, indicates that the total variance is the first principal component formed. The second principal component has an eigenvalue of 1.143.
Table 3. Explained variance (Eigenvalues)
Value PC 1 PC 2 PC 3 PC 4 PC 5
Eigenvalue 2,148 1,143 0,997 0,493 0,219
% of Var. 42,957 22,860 19,947 9,852 4,384
Cum. % 42,957 65,817 85,764 95,616 100,00
0
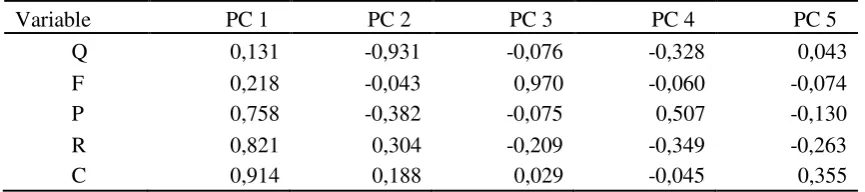
Loadings determine correlation of the original variables and each principal component that indicate contributions of each variable in each principal component such as criteria C and R for PC1 that have the highest loadings for PC1. For the largest loading of PC2 is criteria R, the largest
loading of PC2 is R, and the largest loading PC3 is P. The Correlation between initial variables and
principle component analysis are shown in Table 4. Integrating Fuzzy Method
(Liu and Wang, 2009)
Delph Expert Opinons
Principle Component Analysis Methods (Lam & Hu, 2010)
Reduce multicriterias
Compute PCA to the reduce criterias
The best suppliers Determine
criteria’s Weighted criterias
’s
Table 4.Component loadings for citeria and each PC
Variable PC 1 PC 2 PC 3 PC 4 PC 5
Q 0,131 -0,931 -0,076 -0,328 0,043
F 0,218 -0,043 0,970 -0,060 -0,074
P 0,758 -0,382 -0,075 0,507 -0,130
R 0,821 0,304 -0,209 -0,349 -0,263
C 0,914 0,188 0,029 -0,045 0,355
The principal component score coefficients provide the actual coefficients by which the principal component axes are defined and from which the actual principal component scores (see below) can be calculated for each case. These component score coefficients are the eigenvectors corresponding the eigenvalues. Coefisient scores are presented in Table 5.
Table 5. Component Score Coeefisient (Eigen vectors)
Variable PC 1 PC 2 PC 3 PC 4 PC 5
Q 0,089 -0,871 -0,076 -0,468 0,092
F 0,149 -0,040 0,972 -0,086 -0,158
P 0,517 -0,358 -0,075 0,722 -0,278
R 0,560 0,284 -0,209 -0,498 -0,561
C 0,624 0,176 0,029 -0,065 0,758
Table 6 shows that the final text output is the case-wise values calculated for all principal components, using the above equations of component score coefficients. The PC 1 is a weight sum
of suppliers and criteria C dominates of the score. The best suppliers of PC1 is sands (s9, score 0.890 ),
PC2 is gravels 10/20 (s7, score 0.634 ), PC3 is gravels 5/10 (s9, score 0.890 ) PC4 is cements (s3, score 0.819 ) and
PC5 is gravels 5/10 (s9, score 0.926) . The first two principal components (z1 and z2) given are :
PC1 = 0.131Q+0,218F+0,758P+0,821R+0,914C
PC2 = -0,931 Q - 0,043 F - 0,382 P + 0,304 R+ 0,188 C
Table 6. PCA Scores
Suppliers PCA 1 PCA 2 PCA 3 PCA 4 PCA 5
S1 -1,612 0,158 2,041 -1,452 0,841
S2 -1,076 -1,736 -0,321 0,435 0,895
S3 -0,632 -0,161 -1,925 0,819 1,276
S4 -1,264 0,204 -0,416 0,191 -1,842
S5 0,014 0,736 0,364 -0,772 -0,165
S6 0,751 -1,360 1,141 0,952 -0,799
S8 0,850 1,146 1,052 1,216 0,926
S9 0,890 -0,947 -0,917 -1,050 -0,376
S10 0,616 1,317 -0,578 -0,343 1,371
S11 0,334 0,264 -0,826 -1,945 -0,793
S12 -1,223 0,360 0,045 1,205 -0,853
S13 -0,035 -0,002 -0,203 0,105 0,509
S14 0,785 1,306 -0,090 0,734 -1,134
reported that C value has large positif component on the axis PC1 and PC2 has small negatif
component of C.
Figure 4. Contribution of original variables
4. CONCLUSION
The study has developed integration selection supplier using fuzzy and Principle Component Analysis (FPCA).The objective of this study is to analyze the potential of suppliers using integrated techniques for evaluating suitable company using a detailed evaluation. The model consist of two steps. Firstly, applies Fuzzy based on weighted linguistic number from four experts. Secondly, form new variables which have linear combination of the original variables. The results indicate that the integrated methods give a smooth solution in determining the best supplier. This study could enrich the existing literature in decision making strategy especially for manufacturing industry. Future study should consider evaluation supplier with contract, alocation order and lead time to delivery.
ACKNOWLEDGMENT
The researchers are thankfully appreciated to manager for providing valuable data from construction company and the authors also thank to industrial engineering departement. .
REFERENCES
Aksoy, Asl dan Nursel Ozturk, (2011) Supplier and performance evaluation in just in time production environment, International journal of expert system with application 38, 6351-6359.
Amid A., Ghodyspour S.H., and O’Brien C., (2010), A Weighted max-min model for fuzzy multi objective Supplier selection in supply chain, International journal Product Economics Buyukoztan, G. And Cifci G, (2011), A Novel fuzzy multicriteria decision framework for
sustainable supplier selection with incomplete information, Computer in industry. 62. 164-174
Chou. S.Y and Chang Y.H. (2008). A decision support system for supplier selection based on a strategy aligned fuzzy SMART approach. International journal of expert system with application 34, 2241-2253
Dunteman, G.H. (1989), Principle Component Analysis Series Quantitative application in the Social Sciences. Newbury Park: Sage Publications, Inc.
Ha S.H & Krishna, R (2008), A Hybrid approach to supplier selection for the maintenance of a competitive supply chain, International journal of expert system with application 34, 1303-1311
Lam, KC, T.S. Hu, S.T. Ng, (2005), Using the principal component analysis method as a tool in contractor pre-qualification, Construction Management and Economics. 23, 673–684.
Liu, H.T and Wang, W.K., (2009), An integrated fuzzy approach for provider evaluation and selection in third party logistic, Expert System with Applications 36, 4387-4398
Suhartini, (2009), Pendekatan Fuzzy Quality Function Deployment dan Goal Programming dalam Pemilihan Supplier, Tesis Fakultas Teknologi Industri Jurusan Teknik Industri, Institut Sepuluh November Surabaya.
Ustun Oand Aktar Demirtas. E (2008), An integrated multi objective decision making process for multi period lot sizing with supplier selection. Omega 36 (4), 509-521
Wu, D.D., Zang Y, Wu, D and Olson. D.L. (2010), Fuzzy multi objective programming for selection and risk modelling a possibility approch. Europe Journal of Operation Research. 200, 774-787
Zadeh, L.A. (1965), Fuzzy sets. Information and Control 8, 338-353.