CONCLUSION AND RECOMMENDATION
6.1 Conclusion
Conclusions of this research are:
1. HDPE can be used as additive for Hot Rolled Sheet Wearing Course.
Optimum asphalt content is 6.8% with 3% and 5% of HDPE content.
2. The influence of HDPE in the HRS WC mixture are :
a. Stabilityincreases as HDPE increase. Stability also increases as
percentage of asphalt increase.
b. VITM increases as HDPE increase. VITM decrease as percentage
of asphalt increase.
c. MQ values increases as HDPE increase. MQalso increases as
percentage of asphalt increase.
3. Other Marshall parameters decreased as the use of HDPE for additive are :
a. Flow decreaseswhen increase HDPE amount in the mixture. Flow
decrease as percentage of asphalt increase.
b. VFWA decreases as HDPE increase. VFWA increases as
percentage of asphalt increase.
c. Density decreases as HDPE increase. Density increases as
6.2 Recommendation
For better result, there are some recommendations for other researcher
that want to continue or do similar research:
1. different asphalt penetration type can be used for similar research.
2. use smaller interval of HDPE amount, so can accurate the asphalt
optimum content value.
3. different pavement mix design can be used for similar research
4. the measurement in the laboratory must be done accurately, and
REFERENCES
Anonim ,2010, Spesifikasi Umum Bahan Perkerasan Jalan Divisi 6(standard specification of road pavement design, division 6). Bina Marga 2010 Revision (1)
Departemen Pekerjaan Umum
Wallace, Hugh and Martin, Rogers, 1967, Asphalt Pavement Engineering, Mc Graw Hill Book Company, London, UK
Kreb, R.D. and Walker, R.D.,2004, Highway Material, Mc Graw Hill, Book Company Virginia, polytechnic institute and state university,USA
Kandhal, Priviti, 1993. Waste Materials in Hot Mix Asphalt – An Overview, ASTM, Philadelphia,US.
Sukirman, S.,1992,Perkerasan Lentur Jalan Raya(Pavement mix design), Nova, Bandung
Suroso, T.W, 2002 Aplikasi Penggunaan Polymer dan Mikro Karbon Dalam Meningkatkan Mutu Aspal Untuk Jaringan Prasarana Jalan(The uses of polymer and micro carbon to increase asphalt quality for road infrastructure). Access on 28
August 2012http://pustaka.pu.go.id/katalog-detail.asp
Rahayu, R.H., etal. 2009, Studi Karakteristik Campuran Beton Aspal Lapis Aus (AC – WC ) yang ditambahkan plastic PVC (Study of PVC uses in AC – WC), Fakultas Teknik Universitas Taduloko, Palu.
Nugroho, A.A., 2009, Pengaruh Poly Ethylene Sebagai Additive Terhadap Sifat Marshall HRA(The influence of poly ethylene as additive in HRA). Tugas Akhir Strata Satu Unversitas Atma Jaya Yogyakarta, Yogyakarta.
Pangestiaji, Anderson, 2011, Pengaruh Sampah Plastik Sebagai Bahan Tambah Terhadap Karakteristik Marshall pada Hot Rolled Sheet – B (HRS-B)(The uses of plastic waste to influence marshall characteristic of HRS – B). Tugas Akhir Strata
Satu Unversitas Atma Jaya Yogyakarta, Yogyakarta.
Hamonagan, R.D.S, 2009,JENIS-JENIS PLASTIK, PENGGUNAANYA DALAM
Work : Final project report
By : Teofilo Jose Nurratri Soares /08 13 13112
Date : 10 Oktober 2012
ASPHALT PENETRATION TEST PREPARATION
Sample heated Start at 09.15
Finish at 09.30
Temperature : 1500C
Sample in the room Temperaturee
Start at 09.30 Finish at 10.00
Room temperature : 270C
Sample in 250C Start at 10.00
Finish at 11.00
Penetration test Start at : 11.00 Finish at: 11.45
Penetration in 250C
With 100 gram weight in 5 second I II III
Observation : 1 58 58 65
2 59.5 65 68
3 64 65 67
4 65 66 78
5 69 61 71
Average 66 64,25 66,67
Total average 65,64
Asphalt penetration type:
Asphalt type PEN. 40 PEN. 60 PEN.80
Requirment Min. Max. Min. Max. Min. Max.
40 59 60 79 80 99
Work : Final project report
By : Teofilo Jose Nurratri Soares /08 13 13112
Date : 10 Oktober 2012
ASPHALT PENETRATION AFTER LOSS WEIGHT
PREPARATION
Sample heated Start at. 12.00
Finish at. 12.30 Temperature asphalt : 150oC
Sample in the Start at. 12.30
Room temperature Finish at. 13.00 Room temperature : 27oC
Sample Start at. 15.00
In the 250CFinish at. 16.00
Penetration testStart at. 16.00
Finish at. 16.40
Asphalt penetration test:
Penetration in 25oC
With 100 gram weight in 5 second
I II III
Observation: 1
2
3
4
5
62 56 62
64 64 65
65 67 67
49 69 68
66 62 76
Average 61.2 63.6 67.6
Total average 64.1
Asphalt type PEN. 40 PEN. 60 PEN. 80
Requirment Min. Max. Min. Max. Min. Max.
Work : Final project report
By : Teofilo Jose Nurratri Soares /08 13 13112
Date : 10 Oktober 2012
ASPHALT LOSS WEIGHT TEST PREPARATION
Sample heated Start at 09.15
Finish at 09.30
Temperature : 1500C
Sample in the room temperature
Start at 09.30 Finish at 10.00
Room temperature : 270C
TEST
Loss weight in the oven with temperature 1630C Start at : 11.00
Finish at: 16.00
Tin box no. I II III
Tin box weight (A) 7,811 10,354 9,686
Tin box + sample weight (B) 54,051 57,170 51,45
Sample weight (C)=(B)-(A) 46,24 46,816 41,76
Tin box + sample weight after heated (D) 54,010 57,168 51,45
Sample weight after heated (E)=(D)-(A) 46,229 46,814 41,76
Loss weight (F)=(C)-(E) 0,011 0,002 0
% loss : x100%
(C)
(F) 0,0237
9
0,0042
72 0
Work : Final project report
By : Teofilo Jose Nurratri Soares /08 13 13112
Date: 10 Oktober 2012
SOLUBABILITY OF ASPHALT IN THE CCL4 PREPARATION
Sample heated Start at 09.15
Finish at 09.30
Temperature : 1500C
Sample weight measurement
Start at 12.00 Finish at 12.15
Room temperature : 270C
Filtering process Start at 12.15 Finish at 14.00
Room temperature : 270C
Dry process Start at 14.00
Finish at 14.15
Temperature : 1100C
TEST
A Erlenmeyer number I
B Erlenmeyer weight 331,989 gram
C Erlenmeyer + asphalt weight 333,024 gram
D Asphalt weight (C – B) 1,035 gram
E Cone sieve weight 1,022 gram
F Cone sieve weight after test 1,084 gram
G Asphalt weight 0,062 gram
H % weight : x100%
(D) (G)
0,3255 %
Work : Final project report
By : Teofilo Jose Nurratri Soares /08 13 13112
Date: 10 Oktober 2012
DUCTILITY TEST PREPARATION
Sample heated Start at 09.15
Finish at 09.30
Temperature : 1500C
In the room
temperature
Start at 09.30
Finish at 10.00
Room temperature : 270C
Sample in 25 C Start at 10.00
Finish at 11.00
Temperature : 250C
TEST
Test Start at11.45
Finish at11.50
Ductilityat 250C Tools reading :
Observation >100 cm >100 cm
Work : Final project report
By : Teofilo Jose Nurratri Soares /08 13 13112
Date: 10 Oktober 2012
FLASHING AND BURNING POINT OF ASPHALT TEST OBSERVATION
Sample heated Start at 09.15
Finish at 09.30
Temperature : 1500C
Start observe flashing point -56oC
Start at 15.00
Finish at 15.20 Temperature : …………..0C
150C/ minuets (between 560C until
260C to the burning point)
Start at 15.20 Finish at16.00
Temperature : …………..0C 50C until 60C / minuets
TEST
0
C Before flashing point Time Temperature0C
56 1’6”34 269
51 1’6”35 274
46 59”88 279
41 59”88 284
36 59”88 289
31 1’0”49 294
26 1’0”49 299
21 27”61 304
16 19”87 309
11 23”75 314
6 2’48”39 319
1 50”60 324
OBSERVATION Temperature0C
Flashing point 3250C
Work : Final project report
By : Teofilo Jose Nurratri Soares /08 13 13112
Date: 10 Oktober 2012
ASPHALT SOFTENING POINT TEST PREPARATION
Sample heated Start at 12.15
Finish at 12.30
Temperature : 1500C
Keep in room temperature
Start at 12.30 Finish at 13.00
Temperatureroom : 270C
Sample in 25oC Start at 13.00
Finish at 14.00
Temperature : 250C
OBSERVATION
No. Temperature Time (second)
0
C 0F I II
1. 5 41 0 0
2. 10 50 1’0”89 1’0”89
3. 15 59 1’31”92 1’31”92
4. 20 68 1’11”0 1’11”0
5. 25 77 1’17”0 1’17”0
6. 30 89,6 1’27”0 1’27”0
7. 35 95 1’17”0 1’17”0
8. 40 104 1’05” 1’05”
9. 45 13 1’02” 1’02”
10. 50 122 59”46 59”46
11. 55 131
Result Time (sec) Softening point (0C)
Observation I 21’00” 510C
Observation II 9”22 51,50C
Average 51.250C
Work : Final project report
By : Teofilo Jose Nurratri Soares /08 13 13112
Date: 10 Oktober 2012
SPECIFIC WEIGHT OF ASPHALT TEST PREPARATION
Sample heated Start at 09.15
Finish at 09.30
Temperature : 1500C
In the room temperature
Start at 09.30 Finish at 10.00
Temperatureroom : 270C
Sample in 250C Start at 10.00
Finish at 11.00
Temperature : 250C
TEST
A No. Picnometer I
B Weight ofPicnometer 31,338 gram
C Weight ofPicnometer+ asphalt 81,498 gram
D Weight of water (C – B) 50,16 gram
E Weight ofPicnometer+ asphalt 32,508 gram
F Weight of asphalt(E – B) 1,17 gram
G Weight ofPicnometer + asphalt + water 81,603 gram
H Water weight (G – E) 49,095 gram
I Weight of sample (D – H) 1,065 gram
J Specific weight : (I)
(F) 1,0985
9
Requirement:
Specific weight in the temperature 250C: min = 1
Work : Final project report
By : Teofilo Jose Nurratri Soares /08 13 13112
Date: 11 Oktober 2012
SOUND EQUIVALENT (SE) TEST
No. Scale Sample no.
I
1. Mud Scale
4,1
2. SandScale
4
3. SE= x100%
(2) (4)
97,56%
Known by,
Head of transportation laboratory
Work : Final project report
By : Teofilo Jose Nurratri Soares /08 13 13112
Date: 11 Oktober 2012
AGGREGATESOUNDNESS TEST
Rough Fine
Size (mm)
Weight before test A(gram) 100 200
Weight after test B (gram) 100 200
% loss C = x100%
A B
-A 0 0
%resstrained = P 100 100
% loss weight W =
A P)
-(C 0 0
Note Rough aggregateEx : ………
Fine aggregateEx :………
Knownby,
Work : Final project report
By : Teofilo Jose Nurratri Soares /08 13 13112
Date: 11 Oktober 2012
LOS ANGELES AGGREGATE TEST
SIEVE GRADATION SAMPLE NUMBER I
PASS RESTRAINED WEIGHT
1/2” 3/8” 2500 gram
3/4” 1/2” 2500 gram
SAMPLE NUMBER I
Weight before (A) 5000 gram
Weight after test by sieve No. 12 (B) 3868 gram
Weight after (A) – (B) 1132 gram
LAA = x100%
A (B)
-(A) 22,64 %
Known by,
Work : Final project report
By : Teofilo Jose Nurratri Soares /08 13 13112
Date: 11 Oktober 2012
SPECIFIC WEIGHT AND ABSORPTION OF ROUGH AGGREGATE
TEST NUMBER I
A Dry weight 971
B SSD weight 984
C Wet weight 598
D Bulk specific weight =
(C) -(B)
(A)
2,515544
E SSD specific weight =
(C) -(B)
(B)
2,549223
F Apparent specific weight=
(C) -(A)
(A)
2,603217
G Absorption = x100%
(A) (A) -(B)
1,338826%
H Specific weight
2 (F)
(D)
2,72945
Requirment :
- Absorption : 5%
- Specific weight : 2,3 – 2,6
Known by,
Work : Final project report
By : Teofilo Jose Nurratri Soares /08 13 13112
Date: 11 Oktober 2012
SPECIFIC WEIGHT AND ABSORPTION OF FINE AGGREGATE
TEST NUMBER I
A (SSD) – (500) 500
B Dry weight 492
C Weight of Erlenmeyer + water, Temperature 250C 659
D Weight of Erlenmeyer + sample (SSD) + water, Temperature 250C
960
E Bulk specific weight =
D) -500 (C (A) 2,5126
F (SSD) specific weight=
D) -500 (C (B) 2,4724
G (Aparent) apparent specific weight =
D) -B (C (B) 2,5759
H Absorption = x100%
) ( B) -(500 B 1,6260 Requirement :
- Absorption : 5%
- Specific weight :
Work : Final project report
By : Teofilo Jose Nurratri Soares /08 13 13112
Date: 12 Oktober 2012
ASPHALT VISCOSITY TO THE AGGREGATE TEST
Viscosity 100gr, 3hours % from surface
Observation I 97%
average 97%
Work : Final project report
By : Teofilo Jose Nurratri Soares /08 13 13112
Known by,
Head of transportation laboratory
Sieve % pass
% restrained
amount
No. (mm) range Ideal Spec % restrained Gram
¾” 19 100 100 0 0 0
½” 12,5 90 – 100 95 5 5 60
3/8” 9,5 75 – 85 80 20 15 180
No.8 2,36 50 – 72 61 39 19 228
No.30 0,6 35 – 60 47,5 52,5 13,5 162
No.200 0,075 6 – 10 8 92 39,5 474
Pan (filler) 0 0 100 8 96
Calibration Proving Ring Capacity 6000 LBF
1 LBF = 0,453 kg
Ideal Calibration tools indicator (LBF) Calibration tools indicator (kg)
0 -
-100 985,2 446,2956
150 1474,4 668,8092
200 1968,3 891,6399
250 2457,3 1113,1596
300 2928,8 1326,7464
350 3377,7 1530,0981
400 3840,7 1739,8371
450 4312,3 1953,4719
500 4781,9 2166,2007
550 5239,0 2373,6700
600 5691,3 2578,1589
Correlation Value
Volume (cm3)
Sample
Correlation Value
inch mm
200 – 213 1 25,4 5,56
214 – 225 1 1/6 27,0 5,00
226 – 237 1 1/8 28,6 4,55
238 – 250 1 3/16 30,2 4,17
251 – 264 1 ¼ 31,8 3,85
265 – 276 1 5/16 33,3 3,57
277 – 289 1 3/8 34,9 3,33
190 – 301 1 7/16 36,5 3,03
302 – 316 1 ½ 38,1 2,78
317 – 328 1 9/16 39,7 2,50
329 – 340 1 5/8 41,3 2,27
341 – 353 1 11/16 42,9 2,08
354 – 367 1 ¾ 44,4 1,92
368 – 379 1 13/16 46,0 1,79
380 – 392 1 7/8 47,6 1,67
393 – 405 1 15/16 49,2 1,56
406 – 420 2 50,8 1,47
421 – 431 2 1/6 52,4 1,39
432 – 443 2 1/8 54,0 1,32
444 – 456 2 3/16 55,6 1,25
457 – 470 2 ¼ 57,2 1,19
471 – 482 2 5/16 58,7 1,14
483 – 495 2 3/8 60,3 1,09
496 – 508 2 7/16 61,9 1,04
509 – 522 2 ½ 63,5 1,00
523 – 535 2 9/16 64,0 0,96
536 – 546 2 5/8 65,1 0,93
547 – 559 2 11/16 66,7 0,89
560 – 573 2 ¾ 68,3 0,86
Work : Marshall Test, HDPE 0%
By : Teofilo Jose Nurratri Soares /08 13 13112
Innocentius Arus Maheri Viktor Decky Nortantio Date: 12April 2011
Note :
a = Asphaltcontent b = asphalttothe mixture c = dry weight d = SSD weight
j = vol of aggregate. =
weight Spc aggregate
b)bxg -(100
k = void content in the mix = 100 – i – j l = void content inthe aggregate = 100 – j (VMA)
Known by,
Work : Marshall test, HDPE 3%
By : Teofilo Jose Nurratri Soares /08 13 13112
Innocentius Arus Maheri Viktor Decky Nortantio Date: 12April 2011
NOTE :
a = Asphaltcontent b = asphalttothe mixture c = dry weight d = SSD weight
j = vol of aggregate. =
weight Spc aggregate
b)bxg -(100
k = void content in the mix = 100 – i – j l = void content inthe aggregate = 100 – j (VMA)
Known by,
Work : Marshall test, HDPE 5%
By : Teofilo Jose Nurratri Soares /08 13 13112
Innocentius Arus Maheri Viktor Decky Nortantio Date: 12April 2011
Note :
a = Asphaltcontent b = asphalttothe mixture c = dry weight d = SSD weight
j = vol of aggregate. =
weight Spc aggregate
b)bxg -(100
k = void content in the mix = 100 – i – j l = void content inthe aggregate = 100 – j (VMA)
Known by,
Work : Marshall test, HDPE 7%
By : Teofilo Jose Nurratri Soares /08 13 13112
Innocentius Arus Maheri Viktor Decky Nortantio Date: 12April 2011
Note :
a = Asphaltcontent b = asphalttothe mixture c = dry weight d = SSD weight
j = vol of aggregate. =
weight Spc aggregate
b)bxg -(100
k = void content in the mix = 100 – i – j l = void content inthe aggregate = 100 – j (VMA)
Known by,
Work : Marshall test, HDPE 9%
By : Teofilo Jose Nurratri Soares /08 13 13112
Innocentius Arus Maheri Viktor Decky Nortantio Date: 12April 2011
Note :
a = Asphaltcontent b = asphalttothe mixture c = dry weight d = SSD weight
j = vol of aggregate. =
weight Spc aggregate
b)bxg -(100
k = void content in the mix = 100 – i – j l = void content inthe aggregate = 100 – j (VMA)
Known by,
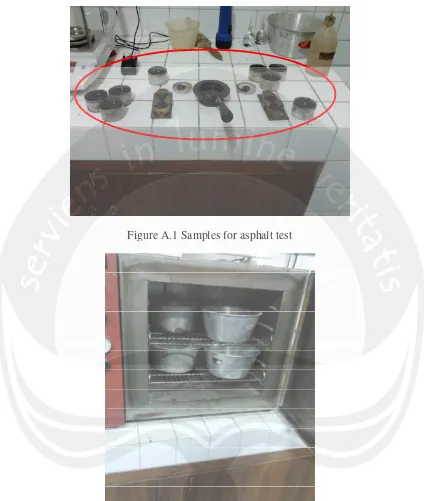
Figure A.1 Samples for asphalt test
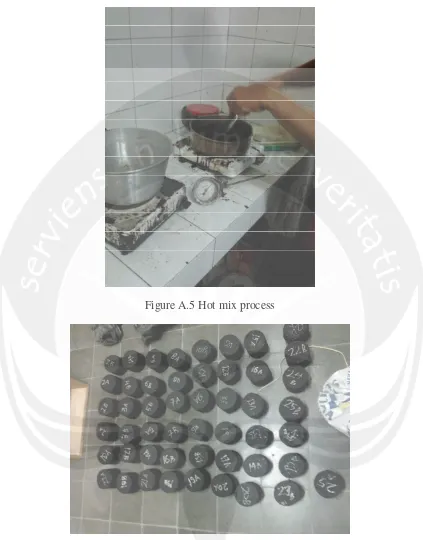
Figure A.5 Hot mix process
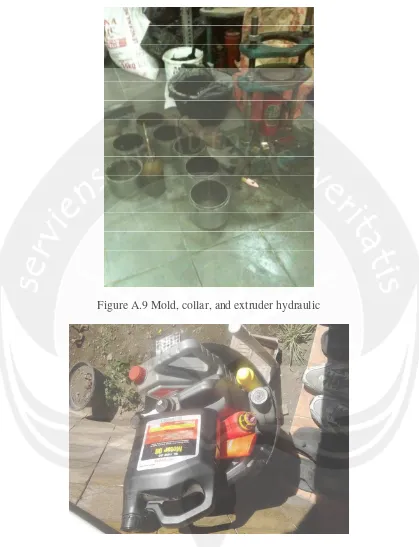
Figure A.9 Mold, collar, and extruder hydraulic