1
THE EFFECT OF GOODWILL IMPAIRMENT ON EARNINGS
MANAGEMENT: EVIDENCE FROM INDONESIA
(PSAK 48 REVISION 2009 FROM IAS 36)
KEZIA ANYA ARIELLA
PRATIWI BUDIHARTA
Program Studi Akuntansi Internasional,
Fakultas Ekonomi, Universitas Atma Jaya Yogyakarta
Jalan Babarsari 43-44, Yogyakarta
ABSTRACT
This research examine the effect of goodwill impairment on earnings management. The change of standard stated that goodwill is no longer subject to amortization but impairment test raised a good chance for management to give their discretion over goodwill impairment. In this research, I estimate that goodwill impairment positively affects earnings management measured using discretionary accruals with board size, leverage, operating cash flows, and political cost as control variables. The model used for measuring discretionary accruals is Modified Jones model. By the total sample of 47 firms in Indonesia from 2011-2013, I found that goodwill impairment positively affects earnings management measured using discretionary accruals.
2 I. INTRODUCTION
1.1 Background
Currently, International Financial Reporting Standards (IFRS) convergence process which officially started in 2008 has entered the second phase to completely implement IFRS to Indonesian Generally Accepted Accounting Principles called Pernyataan Standar Akuntansi Keuangan (PSAK), which will take place from 2013 to 2015. The convergence process is done as the commitment of Indonesia in the G-20 agreement. The results of G-20 meeting in Washington DC on November 15, 2008 that was declared as follows: (1) Strengthening Transparency and Accountability; (2) Enhancing Sound Regulation; (3) Promoting Integrity in Financial Markets; (4) Reinforcing International Cooperation; and (5) Reforming International Financial Institutions(Zamzami, 2011).
For the reporting entity, the most important point of G-20 agreement is to strengthening transparency and accountability. IFRS are principle-based accounting standards that are designed to cover the weaknesses of the old accounting standards, such as the recording of off-balance sheet or the use of extraordinary items. Besides, it is also expected to enhance global comparability of financial information which are derived from countries. Hence, IFRS have high levels of implementation which is much broader and include practices in various entities; since the principle is much more fundamental and flexible when compared with the rule-based standards that are more detailed and inflexible. Thus, it enables the use of professional judgment making financial statements to give better reflection on the substance of transaction and economic conditions. Since the judgment may contains various perspective, it is quite important in determining the professional judgment with the basis of logical reasoning and reasonable.
Back in 2004, the International Accounting Standard Board (IASB) revised International Accounting Standard (IAS) 36 - Impairment of assets, IAS 38 – Intangible assets and introduced International Financial Reporting Standards (IFRS) 3 – Business Combinations. This standards altered the Indonesian accounting standards for PSAK 48 (Revision 2009) – Impairment of assets, PSAK 19 – Intangible assets and PSAK 22 (2010) – Business Combination. These will be the basis form to the accounting procedure goodwill in Indonesia. Therefore, listed companies in Indonesia are required to use PSAK 48 (Revision 2009), PSAK 19 and PSAK 22 (2010) to recognize and evaluate goodwill.
In the new adjustment of PSAK 22 (2010), goodwill is no longer amortized but is subject to an annual impairment test. The purpose of the new standard IAS 36 is to prohibit the method of goodwill amortization that leads to arbitrary accounting (IFRS 2008, BC 140). By using the impairment method, it is possible for a company‟s management to process several assumptions in the impairment test. It is therefore interesting to examine whether this treatment leads to better accounting of goodwill, based on relevance and timeliness of accounting information.
3
not necessarily decline in value on a routine basis but rather has an indeterminate life; led to the conclusion in PSAK 22 (2010) that goodwill should not be amortized but instead must be tested at least annually for impairment.
The impairment for goodwill is set in PSAK 48 (Revision 2009) in accordance with IAS 36 – Impairment of assets. Specifically, PSAK 48 (Revision 2009) is designed to ensure that assets are carried at no more than their recoverable amount and to define how the recoverable amount is calculated. The steps to do impairment test needs high degree of management estimation especially when determining the Cash Generating Unit (CGU) allocated to goodwill, amount of goodwill allocated and the amount of recoverable amount. Recoverable amount is used as a comparison between fair value less cost to sell or value in use. The difficulty in determining the fair value of CGU as a goodwill allocation makes the management typically uses the value in use to determine the recoverable amount of the CGU.
Determination of the recoverable amount will depend on management's estimation. If the recoverable amount of goodwill is less than the carrying amount, the carrying amount of the goodwill is reduced by the recoverable amount. Impairment losses will be reported as an expense in the income statement and will reduce the amount of goodwill reported in the statement of financial position; impairment of goodwill cannot be recovered. PSAK 48 (Revision 2009) seems to give management flexibility to exercise their judgment in determining and reporting goodwill impairment losses – which is very subjective. The determination of amount in impairment test that require management's estimation may become the accounting choice for management. This accounting choice of writing down the value of goodwill and the magnitude of impairment loss provides a good chance for managers to opportunistically manage the reported earnings.
1.2 Research Question
The adoption of IAS 36 through PSAK 48 for Impairment of Assets produce some changes in the treatment of goodwill in Indonesia. The previous standard needs to amortize the goodwill but now it becomes the subject of impairment test. The steps to do impairment test is very subjective and depending to the managements‟ estimation which need professional judgment. This judgment will be used to set the cash generating unit when impairment test is done. The flexibility of the managements to record goodwill impairment loss and to written-off the goodwill regarding their own estimation will raise high possibility of earnings management.
Based on Alves (2013), she investigates whether Portuguese listed companies use goodwill impairment loss to manage earnings. Using a sample of 33 Euro next Lisbon non-financial firms over a period of 6 years, from 2005 through 2010, she found that goodwill impairment is significantly positive related to earnings management using discretionary accruals as the measurement to detect it. It supports the idea that IAS 36 provides managers with discretion for goodwill write-off. Moreover, the results also reveal that there is less earnings management when the board size is large and when cash flows are high and that there is more earnings management when leverage and political costs are high.
4
Dechow et al. (1995), or regression analysis will provide more solid evidence about utilizing goodwill impairment for earning management. Moreover, goodwill impairment is using high level of management discretions.
This research will replicate Alves (2013) which will investigates whether listed companies in Indonesia use goodwill impairment to manage earnings using discretionary accruals as the measurement with board size, leverage, political cost, and operating cash flow as the control variables. This control variables are taken from Alves (2013) as the consideration that goodwill impairment is not the sole factor which affecting earnings management.
Based on the explanation, thereby, this research will raise questions:
Does goodwill impairment positively affect earnings management measured using discretionary accruals?
1.3 Research Objectives
This research has an objective to prove that empirically goodwill impairment positively affects earnings management measured using discretionary accruals.
II. LITERATURE REVIEWS AND HYPOTHESIS DEVELOPMENT 2.1 Goodwill
According to IAS 38, an intangible asset is an identifiable non-monetary asset without physical substance. Intangible assets could be generated from the entities‟ activity. From IAS 38, it is stated that:
“Entities frequently expend resources, or incur liabilities, on the acquisition, development, maintenance or enhancement of intangible resources such as scientific or technical knowledge, design and implementation of new processes or systems, licenses, intellectual property, market knowledge and trademarks (including brand names and publishing titles). Common examples of items encompassed by these broad headings are computer software, patents, copyrights, motion picture films, customer lists, mortgage servicing rights, fishing licenses, import quotas, franchises, customer or supplier relationships, customer loyalty, market share and marketing rights.”
Indonesian PSAK 10 (Revision 2010) as in accordance with IFRS 3 Business Combinations is stating that if an intangible asset is acquired in a business combination, the cost of that intangible asset is its fair value at the acquisition date. If an asset acquired in a business combination is separable or arises from contractual or other legal rights, sufficient information exists to measure reliably the fair value of the asset. In accordance with this IFRS 3 (as revised in 2008), an acquirer recognizes at the acquisition date, separately from goodwill, an intangible asset of the acquiree, irrespective of whether the asset had been recognized by the acquiree before the business combination. This means that the acquirer recognizes as an asset separately from goodwill an in-process research and development project of the acquiree if the project meets the definition of an intangible asset.
Thus, it is clearly stated that goodwill is one of the example of intangible assets. In paragraph 11, it is stated that:
5
acquired or from assets that, individually, do not qualify for recognition in the financial statements.”
Thus in brief, goodwill as an intangible asset is an identifiable non-monetary asset without physical substance which has future economic benefit and should be controlled. Goodwill is the difference between the cost of the purchase and the fair value of the net assets and it could arise in two different ways: (1) internally generated or; (2) acquired as part of the acquisition of another company (business combination). Goodwill shows up in the financial statements only if an acquisition has occurred. Internally generated goodwill is not recognized.
In Indonesia, the treatment for goodwill has been shifted from amortization to annual impairment test. Before 2011, accounting for goodwill was regulated by PSAK 48 requiring that goodwill arising from acquisition to be recognized and amortized on a systematic basis over its useful life.
2.1.1 Accounting for Goodwill
Goodwill is an intangible asset and falls under the regulation of IAS 38. Paragraph 89 describes that accounting for an intangible assets is based on its useful life. It makes a distinction between intangible assets with a finite or indefinite life (IFRS 2008, par 89). This difference is important for the method of measurement of intangible assets. The lifetime for goodwill is difficult to reliably predict, and would be treated as an asset with an indefinite useful lifetime. Following paragraphs 107 and 108, IAS 36 Impairment of Assets is then used to apply the impairment method, as the amortization of goodwill is explicitly prohibited (IFRS 2008).
The objective of IAS 36 Impairment of assets is to describe an impairment test. The Standard prescribes the procedures that an entity applies to ensure that its assets are carried at no more than their recoverable amount. An asset is carried at more than its recoverable amount if its carrying amount exceeds the amount to be recovered through the use or sale the assets. An entity has to test their intangible assets if there is an indication for an impairment loss. As an extension paragraph 10b explicitly describes, testing goodwill annually is required, regardless whether there is in indication for impairment (IFRS 2008, par. 10b).
The new measurement to treat goodwill by FASB in SFAS 142 aims to:
1) Provide a better assessment of goodwill in the statement of financial position, 2) Eliminate the amortization of the arbitrary treatment,
3) Provide a better understanding to users of financial statements regarding the performance of the acquired company, thus it gives a better the ability to predict the company's earnings and cash flows in the future.
Standar Akuntansi Keuangan 22 paragraph 66 concerning goodwill acquired before January 1, 2011 states that:
“Entities applying this statement prospectively for goodwill acquired in the
business combination acquisition date prior to 1 January 2011. Therefore, entities should:
a. discontinue the amortization of goodwill from the beginning of the period of the financial year beginning on or after January 1, 2011;
6
c. performed an impairment test of goodwill in accordance with PSAK 48 (Revision 2009): Impairment of Assets since the early period of the financial year beginning on or after 1 January 2011.”
According to PSAK 48 (Revision 2009), Goodwill is not the subject of amortization but it has to be tested for impairment annually. Impairment is the condition that exists when the carrying amount of goodwill exceeds its implied fair value. Goodwill should be tested for impairment at a level of reporting as a reporting unit – in this case is called Cash Generating Unit (CGU).
2.1.1.1 Amortization
Based on SFAC 6 paragraph 142, amortization is the accounting process of reducing an amount by periodic payments or write-downs. Specifically, amortization is the process of reducing a liability recorded as a result of a cash receipt by recognizing revenues or reducing an asset recorded as a result of a cash payment by recognizing expenses or costs of production. That is, amortization is an allocation process for accounting for prepayments and deferrals. Under the purchase method, the excess of the acquisition cost over the fair values of the identifiable net assets acquired at the date of acquisition is recognized as goodwill.
According to PSAK 22 (1994) paragraph 39 explains that goodwill has to be amortized as an expense over its useful life. Goodwill amortization periods of 5 years can be extended up to 20 years with appropriate base. The amortization used straight-line method unless there is better method with certain provisions. In 2011, this standard is no longer relevant because the new PSAK 22 (2010) requires goodwill has to be tested for impairment and cannot be amortized.
2.1.1.2 Impairment
In order to fulfil PSAK 22 (2010) which requires goodwill as subject to impairment test, accounting procedure for goodwill arises from acquisition is set on PSAK 48 (2009). According to PSAK 48 (2009) paragraphs 80-81, goodwill acquired at the acquisition date in a business combination should be directly allocated to each of the
acquirer‟s cash-generating units, or groups of cash generating units, that is expected to
benefit from the synergies of the combination, irrespective of whether other assets or liabilities of the acquiree are assigned to those units or groups of units. Goodwill allocation to CGU is done as the consideration that goodwill does not generate cash flows independently. It defines CGU as the smallest identifiable group of assets that generates cash inflows that are largely independent of the cash inflows from other assets or group of assets. Each unit or group of units to which the goodwill is so allocated should represent the lowest level within the entity at which the goodwill is monitored for internal management purposes; and not be larger than an operating segment as defined by PSAK 5 – Operating Segments.
7
The recoverable amount is the comparison between the net fair values of the value in use. The net fair value is the fair value less costs to sell, the amount that can be obtained from the sale of an asset or CGU between parties in a fair transaction less costs of disposal (such as whether fair value was determined by reference to an active market). If recoverable amount is value in use, the discount rates used in the current estimate and previous estimate (if any) of value in use. The second way can be seen from the cash flow projections of the testing point to the end of use of the asset in the future; it is taking into the present value for the level of risk, both inflation risk and capital risk.
If the recoverable amount of an individual asset cannot be determined, an impairment loss is recognized for the asset if its carrying amount is greater than the fair value less costs to sell and the results of the allocation procedures; and no impairment loss is recognized for the asset if the related cash-generating unit is not impaired. This applies even if the asset‟s fair value less costs to sell is less than its carrying amount. The impairment of goodwill should be done with reduce the carrying amount of any goodwill allocated to the CGU.
An entity should disclose the requirements of their impairment test. Not only the impairment described in the financial report, but also the event that led to the impairment, information on the calculation of both method and the class of assets to which the impairment is related in the case of CGUs is information that companies have to disclose.
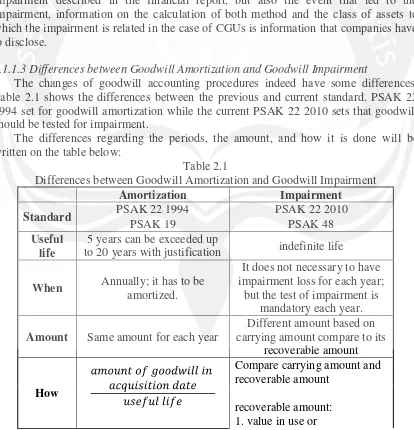
2.1.1.3 Differences between Goodwill Amortization and Goodwill Impairment
The changes of goodwill accounting procedures indeed have some differences. Table 2.1 shows the differences between the previous and current standard. PSAK 22 1994 set for goodwill amortization while the current PSAK 22 2010 sets that goodwill should be tested for impairment.
[image:7.595.92.506.326.756.2]The differences regarding the periods, the amount, and how it is done will be written on the table below:
Table 2.1
Differences between Goodwill Amortization and Goodwill Impairment
Amortization Impairment
Standard PSAK 22 1994 PSAK 22 2010
PSAK 19 PSAK 48
Useful life
5 years can be exceeded up
to 20 years with justification indefinite life
When Annually; it has to be amortized.
It does not necessary to have impairment loss for each year;
but the test of impairment is mandatory each year.
Amount Same amount for each year
Different amount based on carrying amount compare to its
recoverable amount
How
Compare carrying amount and recoverable amount
8
2. fair value - cost to sell
Impairment = recoverable amount < carrying amount
2.2 Earnings Management
With IFRS, the financial statements prepared is on the accrual basis accounting. Accrual accounting has the advantage that the company's earnings information and measurement generally give a better indication of economic performance rather than the information generated from the cash basis accounting (FASB 1978). Accrual accounting also has its weaknesses. Some criticizes that the policies of accrual accounting were not perfect and obscure the financial report which is aiming to provide information about cash flow and the capability of the company to generate cash. The obscurity happen due to accrual accounting policies which give some choices to the reporting entity. Hence, it is very obvious that it will raise vulnerability of information. This vulnerability is called earnings management.
According to Chen (2010), Earnings management is said to be a “reasonable and
legal management decision making and reporting, intended to achieve and disclose stable and predictable financial results”. Most people are aware of the fact that companies‟ earnings are their “net income” or “net profit”. A company‟s earning is believed to be the most important item in the financial statements. It is something that the most analysts use when analyzing a company‟s performance and prospective potential. The most important, the expected value of a company‟s share price is the present value of all its future earnings, and therefore the value of a company is closely related to the increase or decrease in the earnings. Scott (2006: 344) defines earnings management as choices of the accounting policies applied by the manager which is naturally exist to maximize their utility and/or the market value of the company.
Earnings management is a topic of interest, both for accounting researchers and practitioners. The phenomenon of earnings management has also enliven the business world and the press coverage. Some systematic empirical evidence has shown the existence of this phenomenon of earnings management, including Gu & Lee (1999), De Angelo (1988), Holthausen & Sloan (1995), and others. In particular, Gu & Lee (1999) have shown that earnings management has been expanded and there is in every financial report submitted by the company. They give a proof that earnings management occurs in every quarterly financial statements, and management level are largest profit in the third quarter. This shows that earnings management practices is a common phenomenon, not only in certain events but it has been so deeply rooted in the business.
Scott (2006) divides the way to understand earnings management into two. First, see it as opportunistic behavior of managers to maximize their utility for compensation contract, contract debts, and political costs (opportunistic earnings management). Second, from the perspective of efficient contracting (efficient earnings management), in which earnings management gives managers a flexibility to protect the parties involved in the contract as anticipation of unexpected events. Thus, managers can influence the company‟s stock market value through profit management, for example by making the income smoothing.
Based on Roychowdury et al. (2015) they stated that earnings management can occur through two channels, which are:
9
Accruals-based earnings management involves managers‟ intervention in the financial reporting process via the exercise of their discretion and judgment regarding accounting choices. (Roychowdhury, 2006). Thus, accrual-based earnings management generally used for detecting earnings management regarding to accounting choices and policies. Using accrual based earnings management techniques to meet analysts‟ forecasts in the United States has been well researched. Accruals are the difference between net income and cash flows. For example, when companies sell items to others on credit during a growth period, the sale creates an accrual of revenue.
When companies engage in earnings management, they can increase or decrease income by creating accruals; these are often referred to as non-discretionary accruals. However, it is the discretionary accruals, accruals created to manipulate changes in reported earnings that are of concern. These types of accruals include using increasing or decreasing estimates of bad debt reserves, warranty costs, and inventory write-downs. (Moore et al., 2009)
Such research requires a model that estimates the discretionary components of reported income. Existing models range from simple models in which discretionary accruals are measured as total accruals, to more sophisticated models that attempt to separate total accruals into discretionary and nondiscretionary components. Many of the non-discretionary accruals estimate the model from the company's past accruals level prior to the period when there is no systematic earnings management (Jones, 1991). The other alternative is using cross sectional approach where the level of the company's normal accrual in an accrual period compared with the comparison companies in the same period (Defond & Jiambavlo, 1992). By the research; either time series or cross-sectional face the issue with the accrual occurs will vary according to changes in business conditions.
From the past research in their attempt to study accruals use two models: Healy (1985) and DeAngelo (1986) use total accruals as a proxy for earnings management while Jones (1991), Dechow, et al. (1995), Yoon & Miller (2006) use discretionary accruals as a measure of earnings management. Later, they found that modified Jones model is the most powerful model to detect earnings management.
2. Real Activity Management (RAM).
Earnings management through real activity can be detected through operating cash flows, discretionary costs, and production costs. Research on the earnings management through real activities concentrate on the investment activities such as research and development spending reductions. Roychowdury (2006) provide evidence that the manager manipulation through real activity by giving rebates to increase sales, reduce cost of goods sold through an increase in inventories, and reduced discretionary expenses to increase reported earnings. Real activities manipulation can assume many forms, including under-investment in research and development (R&D), advertising, and employee training, all for the purpose of meeting short-term goals. Marketing strategies, tactics, and budgets are often at the center of implementing real activity-based earnings management as well.
10
Managers involved profit management concerned with personal gain to achieve the objectives of reporting because they act as an agent. For example, earnings management to avoid losses, and avoid debt covenant violations, to avoid government intervention, as well as to increase the bonus.
In Indonesia, the research on the manipulation of real activity has been carried out by Andayani (2008). The result is a manufacturing company doing overproduction, discounts, credits and allowances as an indication of earnings management, which led to high production costs.
2.3 Hypothesis Development
The current standard for goodwill requires that the amount of goodwill needs to be tested annually to determine whether any changes in value have occurred. PSAK 48 (Revision 2009) as the convergence of IAS 36 contains the specific requirement that goodwill is subject to a mandatory annual test of impairment and should be impaired to fair value, if necessary. The purpose of the new standard IAS 36 is to prohibit the method of goodwill amortization that leads to arbitrary accounting. By using the impairment method, it is possible for a company‟s management to process several assumptions in the impairment test. Evaluation of fair value and assessment of impairment of goodwill requires management judgment which in fact, can bring a higher of subjectivity in the valuation of goodwill. So, even though an annual impairment test is mandatory, the actual recognition of a goodwill impairment loss is still subject to management„s discretion and highly subjective.
Goodwill impairment losses will affect the accruals, because they lower the reported earnings while they have no influence on the cash flows from operations. Therefore, accounting for goodwill impairment loss provides chances for earnings management. Given that recoverable values are not readily available for many cash generating unit (CGU) to which goodwill balances were assigned, managers enjoy a certain amount of discretion when applying the impairment test.
It is hard and challenging to detect or measure earnings management. It is not possible to observe earnings management directly. Therefore, previous researchers have investigated two venues for earnings management, the choice of accounting methods and the management of accruals. Past research in their attempt to study accruals use two models: Healy (1985) and DeAngelo (1986) use total accruals as a proxy for earnings management while Jones (1991), Dechow et al. (1995), Yoon & Miller (2006) use discretionary accruals as a measure of earnings management. The possible explanation to exclude non-discretionary accruals is that since non-discretionary accruals are used to reflect business condition; subject to firms condition and sales growth and thus it cannot be controlled by managers, it is excluded from the studies.
11
discretionary accruals model developed by Jones (1991) which is very famous and used to many research. The modified Jones model developed by Dechow et al. (1995) represent the current discretionary accrual by adding one more item which is receivables. (Patro & Pattanayak, 2014)
Alves (2013) suggested to include control variables as goodwill impairment is not the only factor to managed earnings. The control variables which are significant will be used in this research, there are board size, leverage, operating cash flow and political cost. Therefore, it is predicted that goodwill impairment will affect earnings management using discretionary accruals as the measurement. Therefore the hypothesis developed:
Ha: Goodwill impairment positively affects earnings management measured using discretionary accruals with board size, leverage, operating cash flows and political cost as the control variables.
III. RESEARCH METHODOLOGY 3.1 Population and Sample
The sample selection is based on purposive sampling method with the following criteria:
1. The company is listed on Indonesia Stock Exchange (IDX) for 2011-2013. 2. The companies are not in financial and banking sector due to the differential
method in estimating the discretionary accruals.
3. The company must have shares listed in the previous period and did not experience any delisting in 2011-2013.
4. The company publishes audited financial statements 2011-2013
5. The financial statements used are the consolidated financial statements.
6. The company's goodwill impairment is included in the statement of financial position during the periods.
7. The financial statements presented in rupiah.
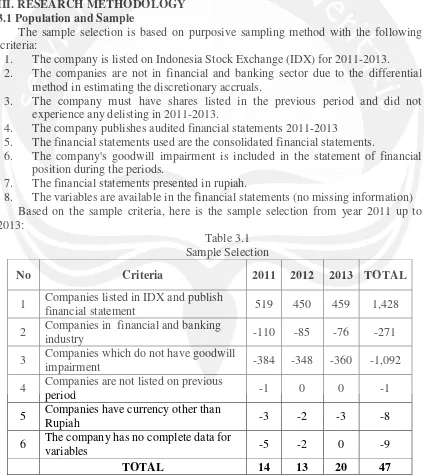
[image:11.595.88.512.281.757.2]8. The variables are available in the financial statements (no missing information) Based on the sample criteria, here is the sample selection from year 2011 up to 2013:
Table 3.1 Sample Selection
No Criteria 2011 2012 2013 TOTAL
1 Companies listed in IDX and publish
financial statement 519 450 459 1,428
2 Companies in financial and banking
industry -110 -85 -76 -271
3 Companies which do not have goodwill
impairment -384 -348 -360 -1,092
4 Companies are not listed on previous
period -1 0 0 -1
5 Companies have currency other than
Rupiah -3 -2 -3 -8
6 The company has no complete data for
variables -5 -2 0 -9
12
As it shows on Table 3.1, the total companies is 1,428 and exclusion of financial and banking industry for 271 companies. The companies which do not have goodwill impairment is 1,092 resulting the rest of 65 companies. The final sample of 47 companies is provided after we exclude unlisted company in the previous period, companies with non-Rupiah currency and companies with missing information.
3.2 Variables Definition and Measurement 3.2.1 Goodwill Impairment
Goodwill Impairment (GW_Impair) is the independent variable. The determination of the amount will affect the management‟s discretionary accruals. It measured as the reported goodwill impairment amount for firm “i” in year “t” deflated by the total assets, formulated from the previous research by Alves (2013) as below:
Explanation:
Goodwill impairment:
1. Input directly from financial statement or
2.
-3.2.2 Earnings Management
Earnings management is the dependent variable. Following the previous research, this study will use discretionary accruals as a proxy for determining earnings management. This research will simplified the previous study which used cross sectional variation of the Jones and modified Jones model by Dechow, Sloan and Sweeney (1995). The Jones‟ model consists of regressing total accruals (TACC) on two variables: the change in revenues (ΔRev), which models the normal component of working capital accruals; and the level of gross property, plant and equipment (PPE), included to control for the non-discretionary component of depreciation and amortization expense, the main component of long-term accruals. Both variables and the intercept are divided by lagged total assets in order to avoid problems of heteroscedasticity.
The modified Jones model differs from the original Jones model in that the change
in revenues is adjusted for the change in receivables (ΔRec). Non-discretionary
accruals (NDACC_ModJones) are the predictions from the OLS estimation of modified model as follows:
-
--
(1)
While the estimated discretionary accruals (DACC_ModJones) are the residuals. The modified Jones model is as follows:
--
-(2)
Where:
TACC = total accounting accruals at the end of year t, estimated as earnings before tax minus net cash flows from operations
TA = total assets at the beginning of year t. ∆Rev = change in revenues of year t and t-1
13
PPE = gross property, plant and equipment at the end of year t i,t = firm and year index.
= error term
DACC = the estimated discretionary part of total accruals for firm i at time t.
3.2.3 Control Variables
The control variables will be measured as follows: 1. Board size (Bsizeit)
Based on Alves (2013) the measurement use to board size (Bsizeit) is the total number of commissioner board members. Alves (2013) find that larger boards are associated with lower levels of discretionary accruals.
Bsizeit = ∑ number of the commissioner board memberit 2. Leverage (Levit)
When leverage concerns with debt covenant violation, it is calculated using the company's ratio of debt to equity. This ratio explains that a company with a high debt to equity ratio shows the greater composition of total debt compared with their total equities; depict that the companies rely the financial on creditors and they usually manage earnings to avoid the violation.
Based on Alves (2013), leverage is significantly positive, providing evidence that an increase in leverage encourage managers to use more accruals to manage earnings to avoid debt covenant violation. This variable will be measured as follow:
3. Operating cash flows (CFsit)
The measurement of this control variable will follow the previous research by Alves (2013) which is ratio between the operating cash flows and the total assets of firm i for period t-1. Alves (2013) find that operating cash flows are negatively associated with discretionary accruals, suggesting that firms with strong operating cash flows are less likely to use discretionary accruals to engage in earnings management. This variable will be measured as follow:
4. Political cost (Sizeit)
Political cost or size can be measured by its total assets, total sales, or market capitalization. In this research, it will measured using the results of the logarithm of total assets. Total assets used as a measurement for firm size with the consideration that total assets relatively more stable compared to total sales or market capitalization as it is stated in Wuryatiningsih (2002). Alves (2013) found that large firms have a higher level of earnings management.The measurement will be:
Sizeit = LN(TotalAssets)
3.3 Research Model
14 Where:
DACCit = discretionary accruals of firm i for period t by using proxy for earnings management the modified Jones model.
GW_Impairit = is measure as the reported goodwill impairment amount for firm in “i” year “i” deflated by the total asset.
Bsizeit = number of members on the commisioner board of firm i for period t. Levit = ratio between the book value of all liabilities and the total assets of firm i for period t.
Cash flowsit = ratio between the operating cash flows and the total assets of firm i for period t-1.
Sizeit = logarithm of total assets of firm i for period t.
it = residual term of firm i for period t. is a constant, are the coefficients.
IV. DATA ANALYSIS AND DISCUSSION 4.1 Descriptive Statistics
Descriptive statistics show the pictures and describe the data from its mean, standard deviation, maximum, and minimum. Descriptive statistics explain about all of the variables which are used in the research and shows the comparison among those variables. It also can help in detecting the outlier data. The result of the data analysis shows that GW_Impair variable represents on average 12.4% of the total assets of the company with the minimum value of 0% up to 17%. Bsize is comprised by approximately 5 members. The range of member is not too high because it only exist from 2 up to 10 members in board. Lev variables represents on average 1.9530 of the total assets of the company. Cash flows variable represents on average 13.38% of the total assets by the company.
4.2 Normality Test
Normality test is used to ascertain whether the data is normally distributed or not. This is very important to have a normal data which the residuals is unbiased and independent. In this study, the normality test is done by looking at the residual values in the regression model. This method is Kolmogorov-Smirnov test with 5% significant value. The indication of normally distributed data can be observed from the value of unstandardized residual of Asymp. Sig (2-tailed). In the condition where unstandardized residual of Asymp. Sig (2-tailed) is more than significance of 0.05 (5%), it is concluded that the data is normally distributed. The outcome in table 4.2 shows the value of 0.918, where 0.918 > 0.05, in conclusion, the sample data is normally distributed.
4.3 Multicollinearity tests
15 4.4 Heteroscedasticity Tests
The aim of this test is to test the identical of variance and residual from an observation. If it comes up with the identical result, it is called homoscedasticity and if the result shows that it is not identical, it called heteroscedasticity. A good regression model is a model which possesses the homoscedasticity. Glejser test is one of the test which can be used. Glejser test suggests to regress the absolute residual of independent variables (Gujarati, 2013). There is no heteroscedasticity test if the P-Value (Sig) > 0.05. It is shown that the Sig. (P-Value) of all of the independent variables are exceeding 0.05. The result conclude that there is no heteroscedasticity.
4.5 Autocorellation Test
The purpose of autocorrelation test is to test whether there is correlation between one observable residual and another. A good regression model possesses no autocorrelation. This test is performed by Durbin-Watson test. Watson value has to be matched with the Durbin-Watson table. Along with n = 50 (the closest number of total sample 47), k‟ = 5 (number of regressor/independent variables), dU of research data is 1.776 and 4-dU of research data is 2.224. The value of Durbin-Watson is 1.896 in which it lies between dU and 4-dU (1.776 < 1.896 < 2.224). So, the conclusion is the research data possess no autocorrelation.
4.6 Hypothesis Testing
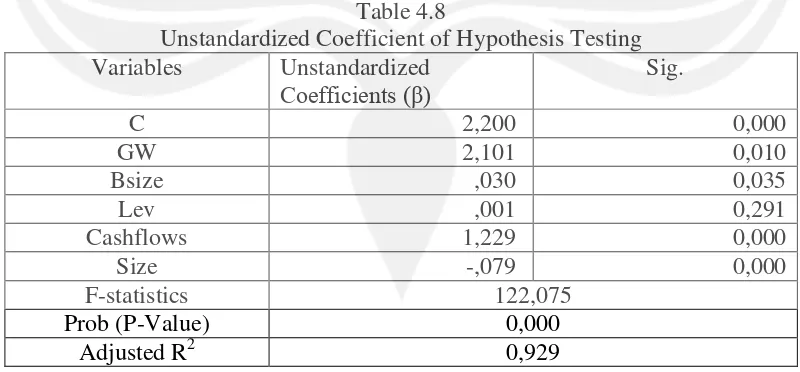
[image:15.595.97.497.520.706.2]The purpose of hypothesis testing is to measure the correlation between independent variable that affect the dependent variable. This test is also the main test to proof the hypothesis statement. The outcome of hypothesis testing partitioned into two parts, the first part is the outcome from the first regression, to search for DACC value. The purpose from the first regression is to seek the coefficient of each year NDACC (non-discretionary accruals). The NDACC coefficient is the key to input the NDACC coefficient to the DACC mathematical equation and compute it mathematically. The second part is the outcome from the second regression, to test the hypothesis. The outcome of hypothesis testing is listed below.
Table 4.8
Unstandardized Coefficient of Hypothesis Testing Variables Unstandardized
Coefficients (β) Sig.
C 2,200 0,000
GW 2,101 0,010
Bsize ,030 0,035
Lev ,001 0,291
Cashflows 1,229 0,000
Size -,079 0,000
F-statistics 122,075
Prob (P-Value) 0,000
Adjusted R2 0,929
16
the independent variables (GW, Lev, Bsize, Size, and Cashflow) can explain the dependent variable (DACC) for 92.9%. The 7.1% explained by the other variables. The result in Table 4.8 also test the goodness of fit of the regression model. The regression model is fit when the P-Value ≤ 0.05. From the result, the regression model is fit because P-Value is smaller than 0.05 (0.000 ≤ 0.05). Besides, it also means that GW, Bsize, Size, Cashflow and Lev are simultaneously affects GW.
The result as it shown in Table 4.8, the constant positive value of 2.200 means that if
all of the research variables‟ value are zero, the DACC (Discretionary acruals) will be
increasing positively for 2.200. For GW, the result is aligned with the expectation that the goodwill impairment positively affects earnings management. It is proven by β1 > 0 and P-Value (Sig) < 0.05 as the value of GW is 2.101 > 0 and 0.010 < 0.05. The regression result also shows that the effect of control variables are not aligned with the
expectation and previous studies. Bsize has positive effect to DACC (β2 > 0 or 0.030)
which tend to have opposite result with Alves (2013). Lev and Cashflow also have
positive effect to DACC with the coefficient the value of 0.001 and 1.229 (β3,β4 > 0)
respectively. Size has negative effect to DACC with β5 = -0.079. In addition, the P-value
(Sig) of all of the control variables exluding Lev is less than 0.05, which mean that those control variables have significant effect to the DACC. It proves that those control variables which have significant effect are the variables which continuously affect the dependent variable, DACC.
4.7 Discussion
The result is aligned with the expectation that goodwill impairments positively affects earnings management measured using discretionary accruals as the main purpose of the research. As already been examined by Alves (2013) and Van de Poel et al. (2009), they suggest that companies use their discretion over goodwill impairment to manage earnings. This result suggests that PSAK 48 (Revision 2009) provides managers too much discretion for goodwill write-off. The main reason is even though an annual impairment test is mandatory, the actual recognition of a goodwill impairment is still subject to management„s discretion and very subjective. Goodwill impairment will affect the accruals, because they lower the reported earnings while they have no influence on the cash flows from operations. This result corroborates the idea that PSAK 48 (Revision 2009) involves managers‟ estimation of parameters, such as cash flow and discount rate, the subjective component in the determination of the amount of goodwill impairment loss to recognize may give rise to earnings management opportunities.
17
board. Besides, a large board tends to be less effective, as decision-making becomes slower due to the involvement of more people. (Mak & Kusnadi, 2005)
Leverage has positive relationship with earnings management means that an increase in leverage encourage managers to use more accruals to manage earnings; this action is done to avoid debt covenant violation. But it suggest no evidence that Leverage significantly affects the level of earnings management. Cashflow has positive effect means strong operating cash flows are morelikely to use discretionary accruals to engage in earnings management. Prior study claimed that the performance of the companies are closely related to the cash flow from operations and return on assets (ROA). So, reporting a good one might be an incentive for managers to manage earnings and signal future performance of the company (Demirkan and Platt, 2009). Besides, There is also an interpretation problem with the evidence that operating cash flows and accruals tend to be negatively related. We have to notice that if operating cash flows are unusually high (low), accruals will naturally be unusually low (high). Indeed, since our prior is that cash flows and nondiscretionary accruals should be negatively correlated, the different magnitude of these correlations could be interpreted as evidence of misclassification. (Bernard & Skinner, 1996)
Size has negative relationship with earnings management explain large firm have a lower level of earnings management. According to Sarumpaet (2012), this matter is still debatable because larger firms are sensitive to critical monitoring, thus they are less likely to manage earnings. Small firms are able to keep their private information more successfully than larger companies, suggesting a reverse size effect (Lee and Choi in Sarumpaet 2002).
V. CONCLUSION 5.1 Conclusion
This research studies about the association between goodwill impairment and earnings management. Based on the result, it suggests that goodwill impairment positively affects earnings management measured using discretionary accruals. This result prove the idea that PSAK 48 (Revision 2009) involves managers‟ estimation, such as cash flow and discount rate, the subjective component in the determination of the amount of goodwill impairment loss. This subjective recognition give opportunity for managers to manage their earnings.
5.2 Limitation
This research have limitations. The first is the limitation of the sample firms. In Indonesia, there are not many firms have goodwill impairment. This research supposed to cover all firms in Indonesia Stock Exchange but unfortunately there are only 47 firms which could pass the criteria. This is the consequence of the limited company which has goodwill in Indonesia. Besides, the research is using the old regulation which is PSAK 48 (Revision 2009). The next limitation is that we only use four control variables which are leverage, board size, political cost, and operating cash flows.
5.3 Suggestion
18
1. The next research may use the newest PSAK so the result could be use as current evaluation.
2. The next research may add some control variables besides leverage, boardsize, political cost, and operating cash flows.
REFERENCES
Agustiani, V. (2015). The Role of Investment Opportunity Sets (IOS) In the Relation between Capital Expenditures and Uncertainty of Future Earnings. Skripsi. Yogyakarta, Indonesia: Universitas Atma Jaya Yogyakarta.
Alves, S. (2013). The Association between Goodwill Impairment and Discretionary Accruals: Portuguese Evidence. Journal of Accounting – Business & Management, 20(2), 84-98.
Andayani, Wuryan. (2008). Pengaruh good corporate governance terhadap manajemen laba melalui aktivitas riil. Prosiding seminar ketahanan ekonomi nasional UPN Veteran Yogyakarta: 24-25 Oktober.
Barton, J., Simko, P. (2002), The Balance Sheet as An Earnings Management Constraint, The Accounting Review, Vol. 77, (Supplement), 1-27
Bernard, V. L., & Skinner, D. J. (1996). What motivates managers' choice of discretionary accruals? Journal of Accounting and Economics (22), 313-325. Chen, T. (2010). Analysis on accrual-based models in detecting earnings management.
Lingnan Journal of Banking, Finance and Economics, 2, Article 5.
De Angelo, L. E. (1986). Accounting number as market valuation substitutes: a study of management buyout of public stockholders. The Accounting Review 41: 400-420.
Dechow, P. M R.G. Sloan, and A.P. Sweeney. (1995). Detecting Earnings Management. The Accounting Review, April Vol. 70 No. 2.
DeFond, M. L. and Jiambalvo, J. (1994), ―Debt Covenant Violation and Manipulations of Accruals, Journal of Accounting and Economics, Vol. 17, No. 1-2, 145-176. Dewan Standar Akuntansi Keuangan. (2009a). Pernyataan Standar Akuntansi
Keuangan 5: Segmen Operasi (Revisi 2009). Jakarta: Ikatan Akuntan Indonesia. Dewan Standar Akuntansi Keuangan. (2009b). Pernyataan Standar Akuntansi
Keuangan 48: Penurunan Nilai Aset (Revisi 2009). Jakarta: Ikatan Akuntan Indonesia.
Dewan Standar Akuntansi Keuangan. (2010). Pernyataan Standar Akuntansi Keuangan 22: Kombinasi Bisnis (Revisi 2010). Jakarta: Ikatan Akuntan Indonesia.
Dewi, K. (2014). Analisis Management Laba Model Big bath terkait Penurunan Nilai Goodwill (PSAK No. 48 Revisi 2009). Skripsi. Yogyakarta, Indonesia: Universitas Atma Jaya Yogyakarta.
FASB. (1984). Statement of Financial Accounting Concepts No. 5: Recognition and Measurement in Financial Statements of Business Enterprises. US: Financial Accounting Standards Board.
FASB. (2001). Statement of Financial Accounting Standards No. 142: Goodwill and Other Intangible Assets. US: Financial Accounting Standards Board.
Ghozali, I. (2011). Aplikasi Analisis Multivariate dengan Program IBM SPSS 19. Semarang: Badan Penerbit Universitas Diponegoro.
19
Healy, P. (1985). The Effect of of Bonus Schemes on Accounting Decisions. Journal of Accounting and Economics, 7:85–107.
Hendriksen, Eldon S., and Michael F. Van Breda. (1992). Accounting Theory 5th edition. New York: McGraw Hill.
Holthausen, R., D. Larcker, and Sloan, R. (1995). Annual bonus schemes and the manipulation of earnings. Journal of Accounting and Economics, March: 73-109.
IASB (2004a), International Accounting Standard (IAS) No. 36: Impairment of Assets (revised). London: International Accounting Standards Board.
Jones, J. J. (1991), ―Earnings Management During Import Relief Investigations‖,
Journal of Accounting Research, Vol. 29, No. 2, 193-228.
Jordan, C.E. and S.J. Clark,. (2004).Big Bath Earnings Management: The Case of Goodwill Impairment Under SFAS No. 142, Journal of Applied Business Research, Vol. 20, No. 2.
Khotari, S. P., Mizik, N., and Roychowdury, S. (2012). Managing for the Moment: The Role of Earnings Management via Real Activities versus Accruals in SEO Valuation. Working Paper.
Mak, Y. T., & Kusnadi, Y. (2005, June). Size really matters: further evidence on the negative relationship between board size and firm value. Pacific-Basin Finance Journal, 13(3), 301-318.
Moore, E. A., McDowell, E., and Li, S. F. (2009). Accrual Based Earnings Management, Real Transactions Manipulation and Expectations Management: U.S. and International Evidence. Working Paper.
Patro, B., and Pattanayak, J. K. (2014). Detecting Earnings Management Using Accrual-Based Models: An Empirical Study with Reference to Coal India Ltd. The IUP Journal of Accounting Research & Audit Practices, XIII (2), 53-64.
Platt, H. D., Demirkan, S., and Platt, M. (2010). Free Cash Flow, Enterprise Value, and Investor Caution. Journal of Private Equity, Vol. 13, No. 4, pp. 42-50.
Ronen, J., and Yaari, V. (2008). Earnings Management: Emerging Insights in Theory, Practice, and Research. NYC: Springer.
Roychowdury,S. (2006). Earnings management through real activities manipulation. Journal of Accounting & Economics (42), 335-370.
Scott William R. 2006. Financial Accounting Theory. 4th edition. USA: Prentice Hall. Sekaran, U., and Bougie, R. (2013). Research Methods for Business: A Skill-Building
Approach. West Sussex: John Wiley & Sons.
Teoh, S., Welch, I., and Wong, T. (1998). Earnings management and the underperformance Of seasoned equity offerings. Journal of Financial Economics, 63-99.
Van de Poel, K., Maijoor, S. and Vanstraelen, A. (2009), ―IFRS goodwill impairment
test and earnings management: the influence of audit quality and institutional environment‖, Working Paper, Universiteit Antwerpen, Universitiet Maastricht. Watts, Ross L. and Jerold L. Zimmerman. (1986). Positive Accounting Theory. New
Jersey: Prentice Hall International Inc.