Url:
http://www.sciencedirect.com/science?_ob=ArticleURL&_udi=B6V91-4BGW2Y0-Trends in urbanization and patterns of land use in the Asian mega cities
Jakarta, Bangkok, and Metro Manila
Akinobu Murakami a, Alinda Medrial Zainb, Kazuhiko Takeuchic, Atsushi Tsunekawac and Shigehiro Yokotad
a
Tokyo Institute of Technology, Interdisciplinary Graduate School of Science and Engineering, 4259 Nagatsuda-cho, Yokohama, Kanagawa 226-8502, Japan; Institut Pertanian Bogor, B-12, KPP-IPB Baranangsiang IV, Bogor, Indonesia; c Graduate School of Agricultural and Life Sciences, The University of Tokyo, 1-1-1 Hongo, Bunkyo-ku,
Tokyo 113-8654, Japan; d Institute of Technology, Shimizu Corporation, 3-4-17 Etchujima, Koto-ku, Tokyo
135-8530, Japan;
Available online 18 January 2004
Abstract
Asian mega cities have experienced rapid population growth and continue to grow. Urbanization in those areas is proceeding differently from the patterns of city growth experienced in Western countries. Understanding the characteristics of Asian urbanization will be indispensable for the establishment of a local landscape planning system. In this study, we used the Clark linear exponential model and the Newling quadratic exponential model to compare the spatial distribution of population densities in three Southeast Asian mega cities: Jakarta, Bangkok, and Metro Manila. We analyzed land-use patterns in each of the three cities by examining the mixture of urban and agricultural land use. The Clark and Newling models showed that the three cities were at different stages of urbanization. Jakarta had entered the suburbanization stage, Metro Manila was still at an early stage of urbanization, and Bangkok was at an intermediate stage between Jakarta and Metro Manila. Analysis of spatial patterns revealed areas of mixed land use within and around the city region in the three cities and that these areas of mixed land use would shift outward as urbanization proceeds. These findings indicate that planning concepts need to respect the vernacular landscape of each Asian mega cities as well as its stage of urbanization.
Url: http://www.sciencedirect.com/science?_ob=ArticleURL&_udi=B6V91-4BGW2Y0-1. Introduction
In Asian mega cities, the peripheral zones have been pushed by urbanization much beyond their previous extents and have spilled over into the rural villages or towns surrounding the cities. The growth has been rapid over the past several decades, causing rural-to-urban conversion of large areas surrounding the cities, uncontrolled development of the urban regions, housing shortages, and expansion of squatter settlements. Urbanization and growth of metropolitan regions in Asia, while showing some of the characteristics of Western urbanization, also exhibit features unique to Asian countries. Several studies have pointed out land-use mixture as a major feature of Asian urbanization. McGee (1991) indicated that rapid urban growth created a chaotic mixture of urban and rural land use, and that such mixture resulted in serious environmental problems and a lack of adequate urban infrastructure. In order to establish a local landscape planning system, an understanding of these features of Asian urbanization is strongly needed.
In this paper we firstly discuss the trends in urbanization in Jakarta (Indonesia), Bangkok (Thailand), and Metro Manila (the Philippines) using Clark’s linear exponential model (1951) and Newling’s quadratic exponential model (1969). Secondly, we examine the characteristics of the land-use patterns and the complexity of land use for each of the cities.
2. Study areas and materials
2.1. Jakarta
DKI (Daerah Khusus Ibukota) Jakarta, or Jakarta city, is the capital city of Indonesia. Jakarta consists of five municipalities and lies in the lowland on the north coast of the western part of Java Island (Fig. 1). The city occupies an area of 640 km2, or 0.03% of the national land area. Jakarta has a flat terrain, and the land gradually rises from 5 to 50 m above mean sea level.
Fig. 1. Location of the three cities.
The 1970, 1980, 1990, and 1998 population data for each subdistrict (kecamatan) of Jakarta were obtained from the Bureau of Statistics (BPS DKI Jakarta Provinces, Indonesia). The kecamatan digital administrative boundaries used in this study were those defined by the National Land Bureau (BPN), Jakarta. Land-use datasets created from the 1990 land-use map (scale 1:25 000) were obtained from the BPN.
2.2. Bangkok
Bangkok, the capital city of Thailand, occupies an area of 1568 km2, or 0.30% of the national land area. Bangkok is situated on the Chao Phraya delta plain (Fig. 1), with an elevation of about 1.5 m above mean sea level.
Url: http://www.sciencedirect.com/science?_ob=ArticleURL&_udi=B6V91-4BGW2Y0-2.3. Metro Manila
Metro Manila is the capital of the Philippines, and consists of eight contiguous cities, including Manila city, and nine other municipalities, covering an area of approximately 638 km2, or 0.20% of the national land area. Metro Manila is located in the lowlands of southwestern Luzon Island and is situated on the eastern coast of Manila Bay at the mouth of the Pasig River (Fig. 1).
Population data for 1970, 1980, 1990, and 1995 for each city of Metro Manila were obtained from the National Statistical Coordination Board, the Philippines. The city administrative boundaries defined by the National Mapping and Resource Information Authority, the Philippines, were digitized and used. The 1995 land-use map was obtained from the same agency.
3. Trends in urbanization in the three cities
3.1. Population growth and spatial extension trends
The historical record shows that the innermost zone of each city was the most populous and that it was, as it continues to be, the center of maximum socio-economic activity. This zone became a magnet for people from outside the metropolitan area (Cadwaller, 1991 and Morrill, 1992). The urbanization process of the innermost zone helped to expand the urban areas and increase the diversity of land use on the fringes of the metropolitan areas. Expansion of urban areas to the fringes of the city also influenced the distribution of population density ( Befort et al., 1988).
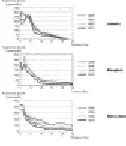
In order to examine the distribution of population density, the average population density (persons/ha) was plotted as a function of distance from the city center by ERDAS software for each of the three cities (Fig. 2). The center point of each city was the National Monument (Monas) for Jakarta, the Grand Palace for Bangkok and Elmita for Metro Manila.
Fig. 2. Population density as a function of distance from the center of the city.
Fig. 2 reveals that Jakarta and Bangkok have had a similar trend of decreasing population density in the center of the city since 1970. Analysis of the data for Jakarta for 1970, 1980, 1990, and 1998 shows a trend of a progressive decline in population density in the center of the city, from 198 persons/ha in 1970 to 153 persons/ha in 1998. Bangkok has a similar trend, from 222 persons/ha in 1970 to 155 persons/ha in 1998. However, Metro Manila has a different trend. In Metro Manila, the population density rises continuously through 1980, declines in 1990, and rises again in 1995.
Url: http://www.sciencedirect.com/science?_ob=ArticleURL&_udi=B6V91-4BGW2Y0-In the range of 5–15 km from the city center, Jakarta shows a rapidly increasing population density at 7 km (from 63 persons/ha in 1970 to 156 persons/ha in 1998), and a more gradual increase in population density at distances greater than 7 km. In Metro Manila, the population density increased over the period from 1970 to 1995. Bangkok shows a trend of increasing population density only during 1970–1990, followed by a decreasing trend from 1990 to 1998.
On the fringes of the urban areas (15–25 km), all three cities show similar trends of increasing population density. Especially, Metro Manila shows a rapid increasing population density at distances greater than 18 km.
3.2. Clark and Newling models
Since Clark (1951) published his classic study on urban population densities, a number of studies have focused on modeling and analyzing urban population densities. The Clark model, which provides a negative exponential distribution of population density, can be described as
D(r)=D0 e−br
where D0 is the population density in the center of the city, D(r) the population density at distance r, r the distance from the center of the city, and b is the measure of the rate of change of the logarithm of the population density.
Berry et al. (1963) and Newling (1966) conducted theoretical and empirical studies to confirm the feasibility of this function. Tanner (1961) and Sherratt (1960) respectively proposed a revised population density model. Later, Newling (1969) introduced a more accepted and generalized function:
D(r)=D0 e(br−cr2) or
where D(r), D0, and r have the same definitions as in the Clark model. The parameter b is the instantaneous rate of change of population density with distance from the center of the city, and c is an approximation of the quadratic exponential parameter. In the Newling model, for positive values of c, the most populous area is predicted to appear at the distance b/2c.
The Clark model explains, as a function of time, how both the city center and areas away from the city show net population density gains. This model fits the early stages of urbanization in metropolitan areas. The next stage of urbanization (suburbanization) is described by the Newling model, which explains the shift of the most populous area from the city center to areas away from the city center. In this case, the city center shows a net loss of population density, while areas away from the city center show net population density gains.
The Clark and Newling models depicted the population density in the context of a monocentric city, in which there existed densely populated central places. Anderson (1982) pointed out the inappropriateness of the negative exponential form, such as the Clark and Newling models, for multicentric cities, and concluded that the cubic spline density function could provide more realistic models of urban density patterns of multicentric cities. Anderson, 1985a and Anderson, 1985b and Zheng, 1991 and Zheng, 1998 conducted studies on population densities and agglomeration economics by employing cubic spline functions. Those studies well demonstrate that the cubic spline function allows more flexible analysis of urban population densities of multicentric cities. However, since Jakarta, Bangkok and Metro Manila were considered to be monocentric cities, the Clark and Newling models were used to classify the three cities in a simple way and to calculate their growth trends.
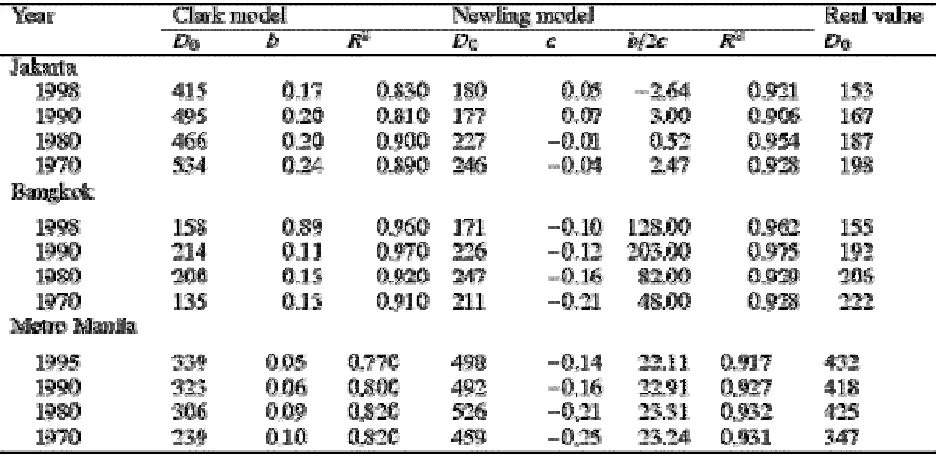
Url: http://www.sciencedirect.com/science?_ob=ArticleURL&_udi=B6V91-4BGW2Y0-0.900) for the three cities, the parameter c in the Newling model has negative values, which suggests that the three cities are not properly represented by the Newling model. Therefore, the spatial patterns of population density in the 1970s and 1980s in the three cities are more appropriately represented by the Clark model than by the Newling model.
Table 1. Results of application of the Clark and Newling models
During the 1990s, the three cities showed different trends of urbanization. The coefficients of determination are still high but the parameter c in the Newling model is positive for Jakarta. This means that the Newling model fits Jakarta of the 1990s more appropriately than the Clark model does, and that Jakarta entered into the stage of suburbanization, although b/2c still has a negative value. In contrast, trends in Bangkok and Metro Manila show that the Clark model is still more appropriate than the Newling model, based on the negative values of the parameter c.
These results from applying the Clark and Newling models suggest that only Jakarta has entered the stage of suburbanization, while Bangkok and Metro Manila are still before the suburbanization stage. However, the recent changes in population density in Bangkok indicate that Bangkok is following right after Jakarta.
4. Land-use pattern
4.1. The complexity of spatial structure
Urban–rural integration as observed in the urban fringe has been pointed out as a distinct feature of Asian mega cities (e.g. McGee, 1991 and Yokohari et al., 2000). In order to comprehend the features of the spatial structure of each of the three cities, we examined the complexity of land use by using a GIS-based dataset relating to land use.
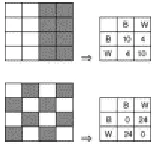
Url: http://www.sciencedirect.com/science?_ob=ArticleURL&_udi=B6V91-4BGW2Y0-represent two different categories, and the diagram shows the method of calculating joins as either BB joins (joins between two black cells), WW joins (joins between two white cells) or BW joins (joins between a black cell and a white cell) in a 4×4 matrix. The join counts method uses the number of BW joins as its value, since this represents the frequency of contiguity between black and white. We analyzed join counts between urban and agricultural land use areas. Thus, the value of join counts indicates the frequency of contiguity between urbanized and agricultural areas, in other words, the degree of land-use mixture.
Fig. 3. Black-and-white map and join counts.
The join counts of land use were calculated by using GIS-based datasets for each of the three cities. In the case of Jakarta, from the analysis above we expected the influences of urbanization to reach beyond the boundaries of Jakarta city; therefore, the dataset was one that covered a wider region (the Jabotabek region) including Jakarta city. The calculation was done for the entire Jabotabek region.
The original GIS data were of vector type, and each metropolitan region was classified into between 12 (Bangkok) and 18 (Metro Manila) classes. The data were converted to raster type, and a new dataset of 50-m resolution was constructed for each city. The 12–18 classes were integrated into three land-use types; urbanized areas (residential areas, industrial areas, roads, etc.), agricultural areas (agricultural areas, forests, fishponds, etc.), and others (sea, rivers, lakes, etc.). Windows of 10×10 pixels (a 500 m×500 m matrix) were scanned and the value of join counts between urbanized areas and agricultural areas within that window was calculated, and this value was assigned to the center (analyzed) pixel.
Each value is plotted in Fig. 4. A high value indicates a high degree of complexity in the land-use type and that the land use is heterogeneous around that pixel (black area). A low value indicates a low degree of complexity in the land-use type and that the land use is homogeneous around that pixel (white area).
Fig. 4. Distribution of land-use join counts.
As is evident from Fig. 4, a high-value area spreads like a belt around a low-value area in Metro Manila. The homogeneous land-use area, which spreads inside the belt, is considered to be highly urbanized. In Jakarta, the spatial structure is similar that of Metro Manila with a belt of mixed land use surrounding the city area. However, this high-value belt spreads outside Jakarta city, beginning almost at the city boundary; the entire city region of Jakarta is considered to be highly urbanized.
Url: http://www.sciencedirect.com/science?_ob=ArticleURL&_udi=B6V91-4BGW2Y0-area of predominantly agricultural or natural land. The location of this http://www.sciencedirect.com/science?_ob=ArticleURL&_udi=B6V91-4BGW2Y0-area coincides with the largest one of the three green zones preserved by the Metropolitan Bangkok Regulations (1982). This indicates that the policy of green zones are effective in this region.
4.2. Belt-transect analysis
In Metro Manila, we conducted a further examination to analyze the temporal change of land-use mixtures. On two sets of aerial photos (taken in 1986 [1:32 000] and 1996 [1:12 500]) we defined a 24 km×0.9 km belt-transect, running from the city core to the south (from lat 14°22 00 N to latitude 14°35 00 N; from longitude 121°00 00 E to long 121°00 30 E), an area that we considered was undergoing intensive urbanization (Fig. 5). The land use within the area was identified by overlaying 100 m×100 m grids on each of the aerial photos. The land use in each grid cell was classified into one of three categories; urbanized area, agricultural area, or other.
Fig. 5. Location of belt-transect in Metro Manila.
In both photos the most highly urbanized area was located near the center of Metro Manila, an area showing urban– rural integration spread outward from the center, and a continuous rural area existed in the outermost part.
The comparison revealed that by 1996 agricultural land shown in the 1986 transect had either vanished as the densely built-up area at the center spread outward or tended to be fragmented.
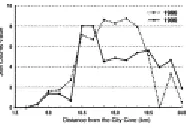
We calculated 3×3 join counts after reclassifying the land use into the three categories. The comparison of the join counts (averaged every 1.5 km) from 1986 and 1996 showed that the low-join-count urbanized area spread outward, join counts in urban–rural integrated areas of initially high value decreased, and join counts in rural areas with initially low values started to increase (Fig. 6). This suggests the outward shift of the urban–rural integrated area, and also the simultaneous spread of the urbanized area.
Fig. 6. Spatial profile for land-use join counts.
5. Discussion
Analysis of the distributions of population density showed that Jakarta, Bangkok, and Metro Manila are at different stages of urbanization. Jakarta has entered the suburbanization stage. Metro Manila is still before the
Url: http://www.sciencedirect.com/science?_ob=ArticleURL&_udi=B6V91-4BGW2Y0-From the spatial analysis, an area of mixed land use was observed within or around the metropolitan regions in each of the three cities. Such mixture occurs as urbanization proceeds. Many studies report that, because of insufficient infrastructure, such as sewerage systems, serious problems of competition arise between urban and agricultural land use in areas of mixed land use (e.g. Kelly, 1998). Therefore, an unbalanced mixture of urban and agricultural landscape must be controlled.
In Jakarta, a belt of mixed land use was seen outside the city region, and we considered that suburbanization continued beyond the city limits. Therefore, a regional plan covering not only Jakarta city but also other neighboring cities is required. In Metro Manila, the area of mixed land use was observed inside the metropolitan region. In addition, the population of Metro Manila is expected to continue growing. A sound land-use plan must be established to control urbanization and to avoid an uncontrolled mixture. In Bangkok, the areas of mixed land use spread linearly. A detailed, fine-scale land-use plan is required to cope with the problem of such a land-use mixture.
Although it is known that mixtures of urban and agricultural land use may cause several environmental problems, segmented patches of agricultural land that remain in the urban fringes can be expected to provide many services, such as water retention capability, micro-climate control, and conservation of visual quality. The establishment of a strategy for urban and agricultural land use to co-exist is strongly needed for Asian mega cities.
References
Anderson, J.E., 1982. Cubic-spline urban-density functions. J. Urban Econ.12, pp. 155–167. Abstract | Article |
PDF (625 K) | View Record in Scopus | Cited By in Scopus (21)
Anderson, J.E., 1985. The changing structure of a city: temporal changes in cubic spline urban density patterns. J. Region. Sci.25, pp. 413–425. Full Text via CrossRef | View Record in Scopus | Cited By in Scopus (23)
Anderson, J.E., 1985. Estimating generalized urban density functions. J. Urban Econ.18, pp. 1–10. Abstract |
Article | PDF (569 K) | View Record in Scopus | Cited By in Scopus (7)
Befort, W.A., Luloff, A.E. and Morrone, M., 1988. Rural land use and demographic change in a rapidly urbanizing
environment. Landsc. Urban Plan.16, pp. 345–356. Abstract | PDF (1846 K) | View Record in Scopus | Cited
By in Scopus (8)
Berry, B.J.L., Simmons, J.W. and Tennant, R.J., 1963. Urban population densities: structure and change. Geogr. Rev.53, pp. 389–405. Full Text via CrossRef
Cadwaller, M., 1991. Metropolitan growth and decline in the United States: an empirical analysis. Growth and Change22 3, pp. 1–16.
Clark, C., 1951. Urban population densities. J. R. Statist. Soc.114 4, pp. 490–496. Full Text via CrossRef Cliff, A.D., Ord, J.K., 1981. Spatial Processes: Medels and Applications. Pion, London.
Fortin, M.J., 1999. Spatial statistics in landscape ecology. In: Klopatek, J.M., Gardner, R.H. (Eds.), Landscape Ecological Analysis: Issues and Applications. Springer-Verlag, New York, pp. 253–279.
Kelly, P.F., 1998. The politics of urban–rural relations: land use conversion in the Philippines. Environ. Urbanizat.
10 1, pp. 35–54. Full Text via CrossRef
McGee, T.G., 1991. The emergence of Desakota regions in Asia: expanding a hypothesis. In: Ginsburg, N., Koppel, B., McGee, T.G. (Eds.), The Extended Metropolis: Settlement Transition in Asia. University of Hawaii Press, Honolulu, pp. 3–25.
Morrill, R., 1992. Population redistribution within metropolitan regions in the 1980’s: core, satellite and exurban growth. Growth and Change23, pp. 277–302. Full Text via CrossRef | View Record in Scopus | Cited By in Scopus (17)
Newling, B.E., 1966. Urban growth and spatial structure: mathematical models and empirical evidence. Geogr. Rev.
59, pp. 242–252.
Newling, B.E., 1969. The spatial variation of urban population densities. Geogr. Rev.59, pp. 242–252. Full Text via CrossRef
Url: http://www.sciencedirect.com/science?_ob=ArticleURL&_udi=B6V91-4BGW2Y0-Tanner, J.C., 1961. Factors affecting the amount of travel. Road Research Technical Paper 51. Department of Scientific and Industrial Research, London.
Upton, G.J.G., Fingleton, B., 1985. Spatial Data Analysis by Example. Wiley, New York.
Yokohari, M., Takeuchi, K., Watanabe, T. and Yokota, S., 2000. Beyond greenbelts and zoning: a new planning
concept for the environment of Asian mega cities. Landsc. Urban Plan.47, pp. 159–171. Article | PDF (3073 K) | View Record in Scopus | Cited By in Scopus (30)
Zheng, X.P., 1991. Metropolitan spatial structure and its determinants: a case study of Tokyo. Urban Stud.28, pp. 87–104. Full Text via CrossRef
Zheng, X.P., 1998. Measuring optimal population distribution by agglomeration economics and diseconomies: a case study of Tokyo. Urban Stud.35, pp. 95–112. Full Text via CrossRef | View Record in Scopus | Cited By in Scopus (6)
Corresponding author. Tel.: +81-45-924-5552; fax: +81-45-924-5553.
Vitae
Murakami: Akinobu Murakami is lecturer at Interdisciplinary Graduate School of Science and Engineering, Tokyo
Institute of Technology. He received his PhD in urban and rural planning from the University of Tokyo in 1999.
Medrial Zain: Alinda Medrial Zain is lecturer of landscape architecture at Institut Pertanian Bogor. He specializes in the urban planning issues of Jakarta.
Takeuchi: Kazuhiko Takeuchi is professor at Graduate School of Agricultural and Life Sciences, The University of Tokyo, where he has taught since 1985. His recent research subjects are regional environmental planning and management, landscape planning, and desertification control studies.
Tsunekawa: Atsushi Tsunekawa is associate professor at Graduate School of Agricultural and Life Sciences, The University of Tokyo. He is a past member of Council for Science and Technology Policy, Cabinet Office,
Government of Japan.