ISSN: 1693-6930
Accredited by DGHE (DIKTI), Decree No.: 51/Dikti/Kep/2010 257
Optimum Reactive Power Dispatch for Alleviation
of Voltage Deviations
Abraham Lomi1*, Dhadbanjan Thukaram2 1
Department of Electrical Engineering, Institut Teknologi Nasional (ITN) Malang, Indonesia Jl. Raya Karanglo Km. 2, Malang, Indonesia, Ph./Fax: +62-341-417636/417634 2
Department of Electrical Engineering, Indian Institute of Science, Bangalore, India CV Raman Avenue, Bangalore, India, Ph./Fax: +91-80-22932361/2360 0444
e-mail: [email protected]*, [email protected]2
Abstrak
Paper ini mempersembahkan suatu algoritma optimasi non-linear untuk mengurangi kondisi naik turunnya tegangan pada operasi sehari-hari dari suatu jaringan daya listrik. Pengendalian tegangan untuk beban yang bervariasi dan kondisi pembangkitan dapat dicapai dengan mengkoordinasikan peralatan kompensasi shunt (SVC), trafo OLTC, dan eksitasi generator. Algoritma yang dikembangkan untuk pengendalian tegangan menggunakan teknik non-linear least square minimization. Hasil-hasil yang diperoleh sebagai ilustrasi menggunakan sistem 6-bus Ward-Hale dan sistem modifikasi IEEE 30-bus.
Kata kunci: least square minimization, OLTC, optimisasi, pengendalian tegangan, SVC
Abstract
This paper presents a non-linear optimization algorithm for alleviation of under-voltage and over-voltage conditions in the day-to-day operation of power networks. Voltage control for varying load and generation conditions can be achieved by coordinated control of switchable shunt VAR compensating (SVC) devices, on load transformer taps (OLTC) and generators excitation. The proposed algorithm for voltage control uses a non-linear least square minimization technique. Results obtained for 6-Bus Ward-Hale system and a modified IEEE 30-Bus system are presented for illustration purposes.
Keywords: least square minimization, OLTC, optimization, SVC, voltage control
1. Introduction
The objective of an energy control center (ECC) is to ensure secure and economic operation of a power system. For the secure operation of power system it becomes essential to maintain network voltage profile within specified limits. In the day-to-day operation, power systems may experience both over-voltage and under-voltage violations. These violations occur due to inadequate reactive power supply for different loading conditions and network configurations. These violations can be relieved by co-ordinated control and switching of voltage/reactive power control devices like:
(i) Switchable shunt VAR compensating (SVC) devices. (ii) On load tap change (OLTC) transformers.
(iii) Generators excitation.
Various algorithms [1-3] employing linear and non-linear optimization techniques have been reported in literature for voltage correction. These algorithms involve intensive numerical computations. This chapter presents a non-linear optimization algorithm for alleviation of under-voltage and over-under-voltage conditions in the day-to-day operation of power networks. The proposed algorithm for voltage control uses a non-linear least square minimization technique [4]
.
Least squares based estimation algorithm used extensively for power system state estimation (PSEE). Least squares minimization gives maximum likelihood estimate when measurement errors obey the Gaussian distribution.2. Formulation of Optimization Problem
The optimization technique used is Least square minimization. The objective function used is minimization of sum of the squares of voltage deviations from pre-selected desired values. The control variables considered are switchable shunt reactive power (SVC), OLTC transformers and generators excitation.
Consider a system where,
n total number of buses
1,2…, g generator buses (g)
g+1, g+2, …, g+s SVC buses (s) and
g+s+1, … , n the remaining buses (r = n-g-s), and
t number of on load tap changing transformer.
The objective function is expressed as
min
[
]
where X is the vector of control variables
[ ]
[
1,..., t, 1,..., g, g 1,..., g s]
.To make ∇xJ( X) equal zero, Newton's method is applied which gives the corrections required for the control variables
Hence, substituting Equations (3) and (5) in (4), we obtain,
2.1. Computation of H Matrix
The element of H matrix cannot be defined directly and so is evaluated as sensitivity matrix. The relation between the net reactive power change at any bus due to change in the transformer tap setting and voltage magnitudes can be written as,
obtain,
B3 =
10 9
6 5
A A
A A
, B4 =
− −
− −
12 11
8 7
A A
A A
, B5 =
−
0
I ,
Size of various sub-matrices are:
S1: (g) x (t + g),
S2 : (g) x (s),
S3 : (s + r) x (t + g),
S4 : (s + r) x (s),
H : (s + r) x (t + g + s), B1 : (g) x (t + g),
B2 : g x (s + r),
B3: (s + r) x (t + g),
B4: (s + r) x (s + r),
B5 : (s + r) x (s) and
I : is an identify matrix of size (s x s).
Matrices S3 and S4 are voltage sensitivities of load and matrices S1 and S2 are
sensitivities of generator Q injections to different reactive power controllers.
2.2. Algorithmic Steps
In day-to-day operational power systems, for a particular load and set of network conditions, an optimal combination of real power generation schedule has to be obtained from an active power optimization algorithm. The control variables are to be initialized in the P-optimization algorithm. The following steps are followed to obtain the optimal reactive power allocation in the system.
Step 1: Read the system data. Step 2: Form network matrices.
Step 3: Perform initial power flow (assumed available from state estimator). Step 4: Compute the voltage error vector
[
des cal]
err
V V
V = −
Step 5: If all the voltage errors are within the specified tolerance go to step 11. Step 6: Compute [H] matrix using Equation (11).
Step 7: Solve for control variables using Equation (6).
Step 8: The control variables are adjusted for a suitable step size.
Step 9: Control variables are updated and checked for their limits. If no scope for Controller change exist then go to step 11.
Step 10: Perform power flow and go to step 1. Step 11: Print the results.
2.3. Hard and Soft Constraints
Equipment constraints including SVC, OLTC settings and generator outputs should not exceed its rating due to equipment safety and other operational constraints. Hence SVC, OLTC settings and generators excitation/Q outputs are treated as hard constraints. In case of any voltage violations exist in the system than they must be completely alleviated, if possible, else reduced by suitable control action. Hence the system voltage is considered as a soft constraint.
3. Test System Studies 3.1. Ward-Hale6-Bus system
The single line diagram of Ward-Hale 6-Bus system, transformers, line data, load data, generation schedule data and SVC setting are adopted from [5]. The controller variable parameters are given in Table-1.
algorithm proposed in this paper. During the VAR control iteration, the limits on the control variables are taken as follows:
Transformer tap settings : ± 0.0250 p.u.
Generator excitation settings : ± 0.0250 p.u, ± 0.01 p.u. Switchable VAR compensator settings : ± 1.00 MVAR.
Table 1. Ward-hale 6-bus system: controller settings Controller
Variables
Bus
Initial VAR control iteration
From To 1 2 3 4 5 6
Trf. tap- Setting
6 4
5 3
1.0000 1.0000
1.0250 1.0250
1.03812 1.00000
1.03811 0.99464
1.03811 0.99464
1.01311 0.98748
0.97500 0.95000 Generator
Excitation 1 2
1.0000 1.0000
1.0000 1.0250
1.00000 1.05000
1.02500 1.07500
1.02500 1.07500
1.05000 1.10000
1.03663 1.05000 SVC (Q)
(MVAR) 4 5
0.0000 0.0000
1.0000 0.0000
2.00000 1.00000
2.00000 1.00000
2.00000 1.00000
1.00000 1.00000
0.00000 3.00000
Table 2. Ward-hale 6-bus system: bus voltage magnitude (p.u) Load
Bus No. Initial
VAR control iteration (Optimum)
1 2 3 4 5 6
1 2 3 4 5 6
1.000 1.000 0.835 0.857 0.806 0.836
1.0000 1.0250 0.8350 0.8750 0.8150 0.8550
1.0000 1.0500 0.8690 0.8860 0.8280 0.8710
1.0250 1.0750 0.9040 0.9170 0.8600 0.9030
1.0250 1.0750 0.9040 0.9170 0.8600 0.9030
1.0500 1.1000 0.9370 0.9410 0.9020 0.9280
1.0400 1.1250 0.9360 0.9470 0.9020 0.9360
Ploss, MW 12.91 11.28 12.28 11.45 11.45 10.64 10.99
Table 3. Summary results of ward-hale 6-bus system
Parameters Initial Value Optimal Value
MW MVAR MW MVAR
Total Generation 147.91 80.58 145.99 68.76
Total P - Q Load 135.00 36.00 135.00 36.00
Total Power Loss 12.91 44.56 10.99 35.76
Total Reactive Compensation (MVAR) 0.00 3.00
Percentage Power Losses (%) 8.73 7.53
Reduction in Losses (%) 0.00 13.74
Vmin (p.u) V5 = 0.806 V5 = 0.902
Vmax
(p.u) V1-2 = 1.000 V2 = 1.125
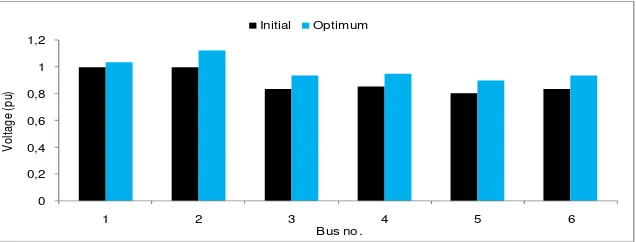
At the end of 6th iteration, the voltages at all the buses are close within the specified limits and the system losses have also been reduced to 10.99 MW, there by resulting in 13.74% reduction in the real power losses. The results obtained at the end of each VAR control iteration are presented in Tables-1 and 2. The summary results of Hard-Wale 6-bus system are shown in Table-3. The system voltage profile for initial and optimum condition is shown in Figure 1.
0 0,2 0,4 0,6 0,8 1 1,2
1 2 3 4 5 6
V
o
lta
g
e
(p
u)
Bus no. Initial Optimum
3.2. Modified IEEE30-Bus System
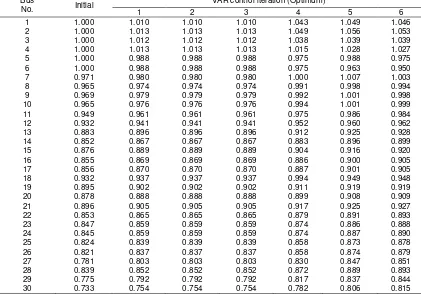
The single line diagram of modified IEEE 30-Bus system, transformers, line data and load data are adopted from [7-9]. The system has 4 numbers of transformers, 6 numbers of generator buses and 9 numbers of switchable VAR compensation buses. The proposed VAR optimization technique with Voltage alleviation objective is implemented. The controller settings of the parameters are given in Table-4. Voltage profiles of the system after implementing the voltage alleviation techniques are shown in Table-5.
Table 4. Modified IEEE 30-bus system: controller settings Controller
variables
Bus
Initial VAR control iteration (Optimum)
From To 1 2 3 4 5 6
Transfor-mer tap- Setting
9
Generator Excitation
1
Table 5. Modified IEEE 30-Bus test system: Bus Voltage magnitude (p.u) Bus
No. Initial
VAR control iteration (Optimum)
The initial load flow for this system shows that the voltages at about 17 buses are not within the acceptable operating voltage limits and the system real power losses are about 25.70 MW. The proposed algorithm has been applied to improve the situation. At the end of 6th VAR control iteration, the voltage at all the buses are close within the specified limits and the system real power losses have come down to 20.17 MW, thereby resulting in 21.52% reduction in the real power losses. The system voltage profiles of the system for initial and optimum conditions are shown in Figure 2. The summary results of modified IEEE 30-bus system are shown in Table-6. During the VAR control iterations the limits on the control variables considered are:
Transformer tap settings : ± 0.025 p.u.
Generator excitation settings : ± 0.025 p.u Switchable VAR compensation settings : ± 1.0 MVAR.
0 0,2 0,4 0,6 0,8 1 1,2
1 2 3 4 5 6 7 8 9 10 11 12 13 14 15 16 17 18 19 20 21 22 23 24 25 26 27 28 29 30
V
o
lt
a
g
e
(
p
u
)
Bus no. Initial Optimum
Figure 2. Voltage profiles of modified IEEE 30-bus system
Table 6. Summary results of modified IEEE 30-bus system
Initial Value Optimal Value
MW MVAR MW MVAR
Total Generation 266.30 238.95 260.46 171.17
Total P - Q Load 240.63 130.90 240.63 130.90
Total Power Loss 25.70 108.02 20.27 20.17
Total Reactive Compensation (MVAR) 0.00 43.00
Percentage Power Losses (%) 9.64 7.62
Reduction in Losses (%) - 15.02
Vmin (p.u) V30 = 0.733 V30 = 0.815
Vmax (p.u) V1-6 = 1.000 V2 = 1.053
4. Conclusions
References
[1] Lomi A. Reactive Power Optimization for Voltage Stability Improvement. Science and Engineering Journal. Universidade Federal De Uberlandia, Brazil. 2000: 16-21.
[2] Lomi A, Thukaram D. Selection of Static VAR Compensator Location and Size for System Voltage Stability Improvement. International Journal of Electric Power Systems and Research. Elsevier. 2000: 139-150.
[3] Kirschen DS, Van Meeteren HP.MW/Voltage Control in a Linear Programming Based Optimal Power Flow. IEEE Trans. On PAS, 1988; 3(2): 481-489.
[4] Lomi A. Power Flow Model Incorporating Generation Controls and Load Characteristic. Jurnal Sains dan Teknologi EMAS. Univ. Kristen Indonesia. 2004: 21-28.
[5] Lomi A. Planning and Operation of Reactive Power Sources for Voltage Stability Improvement and Harmonics Minimization. Dr. Eng. Dissertation. AI. 2000.
[6] Thukaram D, Kumar VSS, Khincha HP. State Estimation using LP Upper Bound Optimization. 16th National Power Systems Conference. Dec. 15th-17th, India. 2010: 347-352.
[7] Lee KY, Park YM, Ortiz JL. Optimal Real and Reactive Power Dispatch. Electric Power Research. 1984; 7: 201-219.
[8] Gupta M, Kumar R, Gupta RA. Neural network Based Indexing and Recognition of Power Quality Disturbances. TELKOMNIKA. 2011; 9(2): 227–236.