and Polymorphisms in Boar Testis and Liver Tissues with
Divergent Androstenone Levels
Asep Gunawan1,2, Sudeep Sahadevan1, Christiane Neuhoff1, Christine Große-Brinkhaus1, Ahmed Gad1,3, Luc Frieden1, Dawit Tesfaye1, Ernst Tholen1, Christian Looft1, Muhammad Jasim Uddin1,4,
Karl Schellander1, Mehmet Ulas Cinar1*
1Institute of Animal Science, University of Bonn, Bonn, Germany,2Department of Animal Production and Technology, Faculty of Animal Science, Bogor Agricultural University, Bogor, Indonesia,3Department of Animal Production, Faculty of Agricultural, Cairo University, Giza, Egypt,4Department of Medicine, Faculty of Veterinary Science, Bangladesh Agricultural University, Mymensingh, Bangladesh
Abstract
Boar taint is an unpleasant smell and taste of pork meat derived from some entire male pigs. The main causes of boar taint are the two compounds androstenone (5a-androst-16-en-3-one) and skatole (3-methylindole). It is crucial to understand the genetic mechanism of boar taint to select pigs for lower androstenone levels and thus reduce boar taint. The aim of the present study was to investigate transcriptome differences in boar testis and liver tissues with divergent androstenone levels using RNA deep sequencing (RNA-Seq). The total number of reads produced for each testis and liver sample ranged from 13,221,550 to 33,206,723 and 12,755,487 to 46,050,468, respectively. In testis samples 46 genes were differentially regulated whereas 25 genes showed differential expression in the liver. The fold change values ranged from24.68 to 2.90 in testis samples and 22.86 to 3.89 in liver samples. Differentially regulated genes in high androstenone testis and liver samples were enriched in metabolic processes such as lipid metabolism, small molecule biochemistry and molecular transport. This study provides evidence for transcriptome profile and gene polymorphisms of boars with divergent androstenone level using RNA-Seq technology. Digital gene expression analysis identified candidate genes in flavin monooxygenease family, cytochrome P450 family and hydroxysteroid dehydrogenase family. Moreover, polymorphism and association analysis revealed mutation inIRG6, MX1, IFIT2, CYP7A1, FMO5andKRT18 genes could be potential candidate markers for androstenone levels in boars. Further studies are required for proving the role of candidate genes to be used in genomic selection against boar taint in pig breeding programs.
Citation: Gunawan A, Sahadevan S, Neuhoff C, Große-Brinkhaus C, Gad A, et al. (2013) RNA Deep Sequencing Reveals Novel Candidate Genes and Polymorphisms in Boar Testis and Liver Tissues with Divergent Androstenone Levels. PLoS ONE 8(5): e63259. doi:10.1371/journal.pone.0063259
Editor:Marinus F.W. te Pas, Wageningen UR Livestock Research, Netherlands
ReceivedDecember 5, 2012;AcceptedApril 2, 2013;PublishedMay 16, 2013
Copyright:ß2013 Gunawan et al. This is an open-access article distributed under the terms of the Creative Commons Attribution License, which permits unrestricted use, distribution, and reproduction in any medium, provided the original author and source are credited.
Funding:This work was financially supported by the Federal Ministry of Food, Agriculture and Consumer Protection, Germany (BMELV), the Federal Institute of Agriculture and Food, Germany (BLE) and State of North Rhine Westphalia with the programme USL ‘‘Umweltvertra¨gliche und Standortgerechte Landwirtschaft’’. The funders had no role in study design, data collection and analysis, decision to publish, or preparation of the manuscript.
Competing Interests:The authors have declared that no competing interests exist. * E-mail: [email protected]
Introduction
Boar taint is an off-odor and off-flavor meat trait, mainly caused by high levels of androstenone, skatole and/or indole in adipose tissue [1]. The taint has been described as being similar to urine and manure and may occur in meat from uncastrated sexually mature male pigs [2]. Consumers commonly show a strong aversion to tainted meat. Currently, surgical castration of male piglets is a common practice in many countries to produce taint-free porcine meat [3]. However, castration is undesirable due to ethical and economical concerns [4] and rearing entire males instead of castrates has a number of advantages including higher efficiency, leaner carcasses and lower faecal and urinary nitrogen losses [5]. By 2018, castration of piglets is going to be banned in the European Community [6]. Consequently, there is an urgent need to develop alternative methods to prevent tainted meat. In literature, it has been mentioned that lowering the slaughter weight or choosing a definite breed can reduce the boar taint [7],
however, these could lead to some economical drawbacks. Skatole is a derivative of tryptophan produced in the hindgut of pigs by intestinal bacteria. The level of intestinal skatole production is mainly dependent on nutritional factors and no genetic control has been demonstrated so far [8]. On the other hand, for androstenone high heritability estimates (h2= 0.25 to 0.87) and differences between sire lines have been reported[9;10;11]. Consequently molecular breeding seems to be a promising way to produce pigs without boar taint.
phenomenon is mainly controlled by enzymes and regulatory proteins such as cytochrome P450 and hydroxysteroid sulfotrans-ferase family. Cytochrome P450s (CYPs) act as mono-oxygenases, with functions ranging from the synthesis to the degradation of endogenous steroid hormones [17]. Androstenone synthesis is initiated by cleavage of cholesterol to produce pregnenolone. This reaction is catalysed by the enzymeCYP11A[8]. Formation of 16-androstene steroids from pregnenolone is orchestrated by CYB5 which causes overproduction of 16-androstene steroids in testis [18;19]. Two other cytochrome P450 enzymesCYP17andCYP21 have also been investigated for the involvement in steroidogenesis [8]. 3-b-hydroxysteroid dehydrogenase (3b-HSD) enzyme encod-ed byHSD3Bgene [20] reduces androstenone tob-androstenol in pig liver microsomes [14]. The 16-androstene steroids in the liver and testis are sulfoconjugated by hydroxysteroid sulfotransferase (SULT2A) [16;21].
A number of quantitative trait loci (QTL) and genome-wide association analysis have been conducted for androstenone in the purebred and crossbred pig populations [2;22;23;24;25;26]. Gene expression analysis has been used to identify candidate genes related to the trait of interest. Several candidate genes have been proposed for divergent androstenone levels in different pig populations by global transcriptome analysis in boar testis and liver samples [27;28;29]. Functional genomics provides an insight into the molecular processes underlying phenotypic differences [30] such as androstenone levels. RNA-Seq is a recently developed next generation sequencing technology for transcriptome profiling that boosts identification of novel and low abundant transcripts [31]. RNA-Seq also provides evidence for identification of splicing events, polymorphisms, and different family isoforms of transcripts [32]. The major aim of this study was to elucidate the genes involved in androstenone metabolism in testis and liver tissues using RNA-Seq technology. For this purpose, we analyzed differential expression of genes between high and low androste-none sample groups and polymorphisms that appear on the differentially expressed genes.
Results
Analysis of RNA-Seq Data
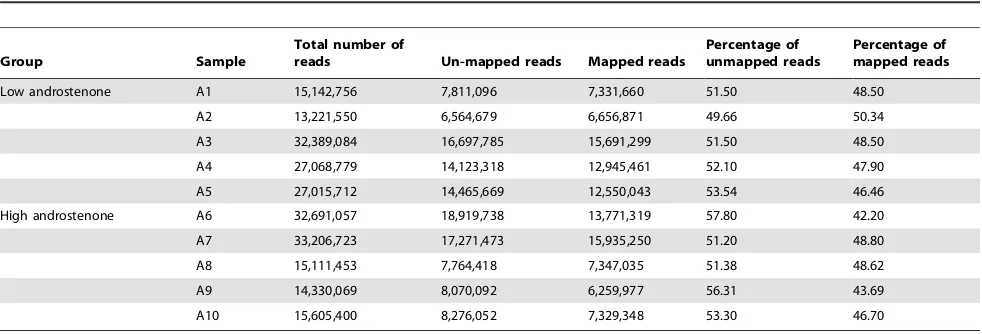
We sequenced cDNA libraries from 10 samples per tissue using Illumina HiSeq 2000. The sequencing produced clusters of sequence reads with maximum 100 base-pair (bp) length. After quality filtering the total number of reads for testis and liver samples ranged from 13.2 million (M) to 33.2 M and 12.1 M to 46.0 M, respectively. There was no significant difference in the number of reads from low and high androstenone samples (p= 0.68). Total number of reads for each tissue group and the number of reads mapped to reference sequences are shown in Table 1 and 2. In case of testis 42.20% to 50.34% of total reads were aligned to reference sequence whereas, in case of liver 40.8% to 56.63% were aligned.
Differential Gene Expression Analysis
Differential gene expression for testis and liver with divergent androstenone levels were calculated from the raw reads using the R package DESeq [33]. The significance scores were corrected for multiple testing using Benjamini-Hochberg correction. We used a negative binomial distribution based method implemented in DESeq to identify differentially expressed genes (DEGs) in testis and liver with divergent androstenone levels. The smear plots for differential expression between high and low androstenone levels in testis and liver are given in Figure S1. A GLM analysis (implemented in DESeq package) was also done on the same data
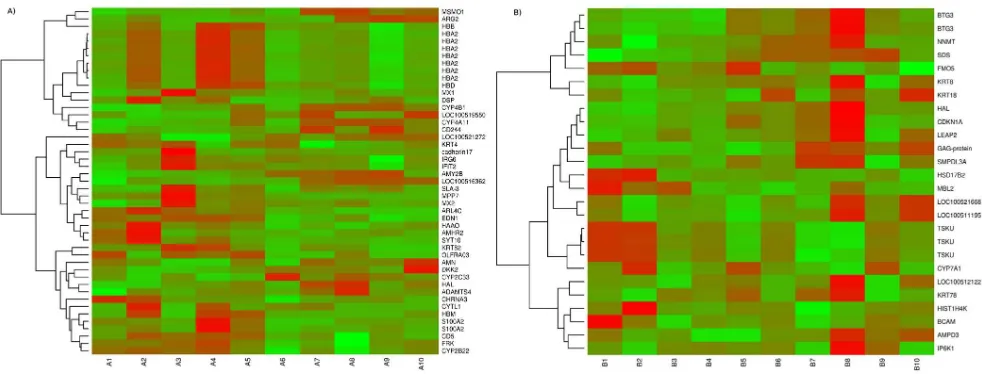
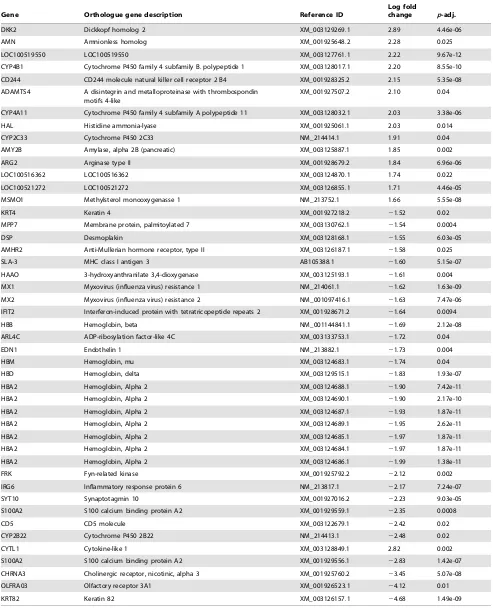
set to identify genes with a significant difference between within group deviance and between group deviances. Finally DEGs were selected based on criteria padjusted ,0.05 and fold change $1.5 from first analysis andpadjusted,0.05 in GLM analysis (Table S1). A total of 46 and 25 DEGs were selected from the differential expression analysis for testis and liver tissues respectively (Table 3 and 4). In testis tissues, 14 genes were found to be highly expressed in high androstenone group whereas, 32 genes were found to be highly expressed in low androstenone group. In the liver tissue, 9 genes were found to be highly expressed in high androstenone group whereas, 16 genes were found to be highly expressed in low androstenone group (Table 3 and 4). The range of log fold change values for DEGs was from24.68 to 2.90 for testis and from22.86 to 3.89 for liver. Heat maps (Figures 1A and 1B) illustrate the DEGs identified in high and low androstenone testis and liver tissues.
Biological Function Analysis for DEGs
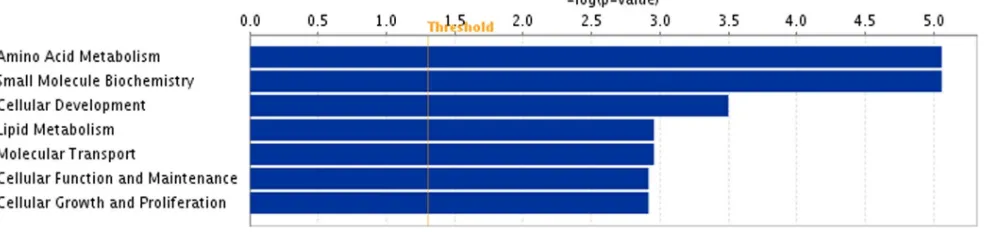
To investigate gene functions and to reveal the common processes and pathways among the selected DEGs, Ingenuity Pathway Analysis (IPA) software (Ingenuity Systems, www. ingenuity.com) was used. In testis samples, out of 46 DEGs 39 were assigned to a specific functional group based on the information from IPA (Figure 2). A large proportion (84.7%) of the DEGs from testis high androstenone group fell into Gene Ontology (GO) categories such as molecular transport, small molecule biochemistry, amino acid metabolism, embryonic development, carbohydrate metabolism, lipid metabolism and reproductive system development and function (Figure 2). The genes classified into each functional group are listed in the Table 5. For the liver androstenone samples, out of 25 DEGs, 22 could be assigned to a specific functional group based on the information from IPA (Figure 3). A large proportion (88.0%) of the DEGs from liver high androstenone group was enriched with GO functional categories such as amino acid metabolism, small molecule biochemistry, cellular development, lipid metabolism, molecular transport, cellular function and maintenance and cellular growth and proliferation (Figure 3). The genes classified into each functional group are listed in Table 6.
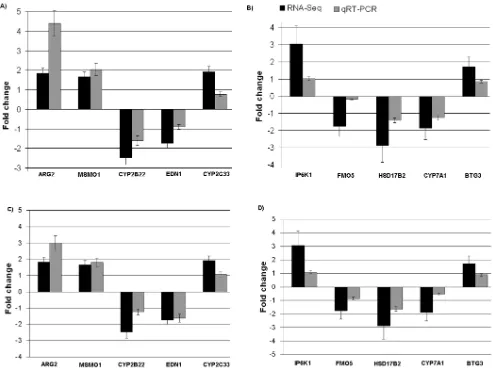
Validation of Selected DEGs with Quantitative Real Time PCR (qRT-PCR)
In order to validate the RNA-Seq results, on the basis of differential expressions and functions related to androstenone, a total of 10 genes were selected and quantified using qRT-PCR. ARG2, CYP2C33,MSMO1,EDN1andCYP2B22genes from testis samples andIP6K1, BTG3,CYP7A1, FMO5andHSD17B2genes from liver samples were selected. For this purpose, the same samples used in the deep sequencing were used. Comparison of qRT-PCR data for 10 selected genes showed complete concor-dance of expression with the RNA-Seq results (Figure 4A and 4B). To further validate the expression of selected genes more robustly, new grouping of independently high (n = 5) and low (n = 5) androstenone are done among the remaining 90 pigs. The mRNA expressions of selected genes showed similar pattern of expression in this new groups (Figure 4C and D). Gene expression values for qRT-PCR were normalized using housekeeping genesPPIAand GAPDH[34].
Gene Variation Analysis
and 8,621 in low androstenone group were global polymorphisms with reference and accession identifiers in dbSNP database. Similarly in liver high and low androstenone samples 169,181 and 164,417 potential polymorphisms were identified. There were 6,851 global polymorphisms in high androstenone liver sample and 6,436 global polymorphisms in low androstenone liver sample.
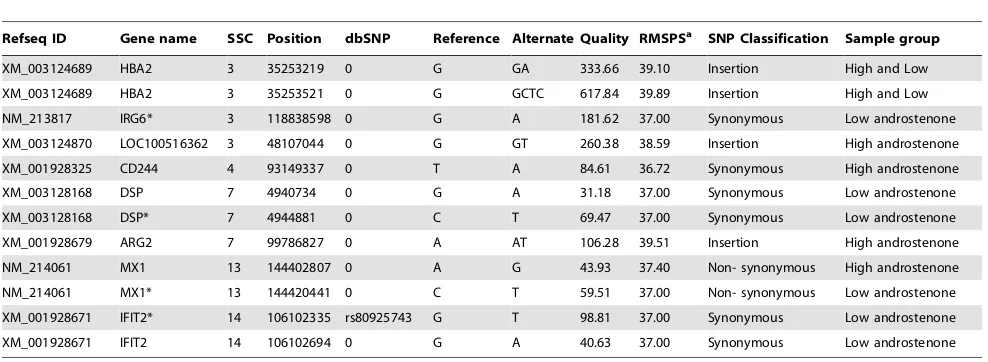
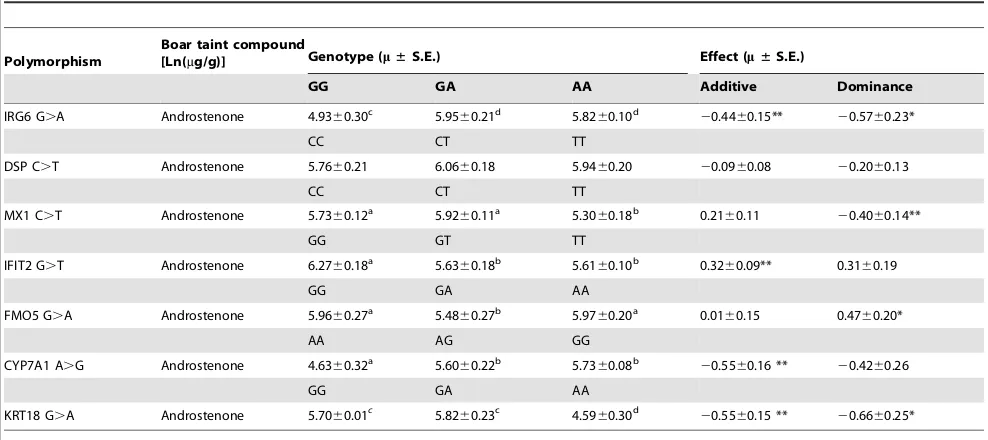
Polymorphisms identified in DEGs for testis and liver samples are given in Table 7 and Table 8. In the testis samples 12 gene polymorphisms were identified in 8 DEGs (Table 7). Additionally our results of deep sequencing in limited number of animals revealed that mutations for the genes CD244 and ARG2 were specific for high androstenone testis tissues, whereas mutations in genesIFIT2, DSP and IRG6 were specific for low androstenone testis samples. Furthermore, we have selected SNPs inIRG6, DSP, MX1andIFIT2genes to validate their segregation and association in our population (Table S3 and Table S4). Polymorphisms in IRG6 (g.118838598G.A), MX1 (g.144420441C.T) and IFIT2 (g.106102335 G.T) were associated with androstenone level (Table 9).
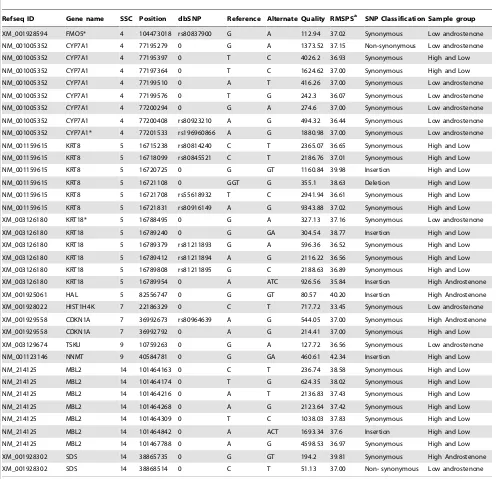
Thirty six mutations were identified in 11 DEGs in liver samples (Table 8). Variation in HALgene was specific for high androstenone liver samples whereasFMO5,HIST1H4KandTSKU gene variations were specific for low androstenone liver samples
(Table 8). Read counts for individual samples for identified polymorphisms in testis and liver tissues are given in Table S2. Additionally, we have validated SNPs in highly polymorphic genes CYP7A1, KRT18 and FMO5 and their association in our population (Table S3 and Table S4). The SNP in CYP7A1 (g.77201533 A.G), KRT18 (g.16788495 G.A) and FMO5 (g.104473018 G.A) were found to be associated with the phenotype androstenone level (Table 9).
Discussion
Analysis of RNA-Seq Data
The present study describes the transcriptome profiles of testis and liver for androstenone by using RNA-Seq. To the best of our knowledge this study provides the first comprehensive insight into the transcriptome of androstenone metabolism in testis and liver tissue by using RNA-Seq. Using the whole transcriptome sequencing technique, we were able to identify the levels of differentially expressed genes and associate these genes with divergent androstenone levels in terms of boar taint. Our findings clearly demonstrated the power of RNA-Seq and provide further insights into the transcriptome of testis and liver in androstenone at a finer resolution. Illumina sequencing data have been described as replicable with relatively little technical variation [35]. Table 1.Summary of sequence read alignments to reference genome in testis samples.
Group Sample
Total number of
reads Un-mapped reads Mapped reads
Percentage of unmapped reads
Percentage of mapped reads
Low androstenone A1 15,142,756 7,811,096 7,331,660 51.50 48.50
A2 13,221,550 6,564,679 6,656,871 49.66 50.34
A3 32,389,084 16,697,785 15,691,299 51.50 48.50
A4 27,068,779 14,123,318 12,945,461 52.10 47.90
A5 27,015,712 14,465,669 12,550,043 53.54 46.46
High androstenone A6 32,691,057 18,919,738 13,771,319 57.80 42.20
A7 33,206,723 17,271,473 15,935,250 51.20 48.80
A8 15,111,453 7,764,418 7,347,035 51.38 48.62
A9 14,330,069 8,070,092 6,259,977 56.31 43.69
A10 15,605,400 8,276,052 7,329,348 53.30 46.70
doi:10.1371/journal.pone.0063259.t001
Table 2.Summary of sequence read alignments to reference genome in liver samples.
Group Sample
Total number of
reads Un-mapped reads Mapped reads
Percentage of unmapped reads
Percentage of mapped reads
Low androstenone B1 29,549,267 15,632,809 13,916,458 53.50 46.50
B2 46,050,468 25,270,695 20,779,773 54.87 45.13
B3 16,420,055 7,659,515 8,760,540 46.64 53.36
B4 13,323,763 6,989,584 6,334,179 52.46 47.54
B5 27,085,837 11,747,225 15,338,612 43.37 56.63
High androstenone B6 28,976,693 16,123,777 12,852,916 55.64 44.36
B7 12,755,487 5,879,896 6,875,591 46.10 53.90
B8 45,203,089 18,443,608 26,759,481 59.20 40.8
B9 14,559,329 8,540,379 6,018,950 58.66 41.34
B10 14,527,329 8,062,992 6,464,337 55.51 44.49
Although 45% to 50% (Table 1 and 2) of the fragments do not map to annotated exons in our study, we were able to identify genes associated with divergent androstenone levels. Porcine annotation is incomplete, as evidenced by read mapping annotation. The percentage of annotated reads varies from 15.6% to 60.8% in similar porcine transcriptome studies [36;37;38]. The differences between mapping percentages might be due to several factors such as primer biases, GC content, dinucleotide fragmentation sites, independent cell types and laboratory protocols [39;40]. Another factor is that the current reference transcriptome assembly might not cover all transcribed mRNA and consequently low abundant transcripts or rare alternative splicing isoforms are less likely to be mapped to transcriptome assembly [38].
Differential Gene Expression and Gene Polymorphism Analysis in Testis
In this study, 46 genes were differentially regulated in testis with divergent androstenone levels (Table 3). Our findings of differen-tial gene expression are in accordance with the current under-standing of androstenone metabolism as well as the previous findings in functional studies. In our study, the most up and down regulated genesDKK2and KRT82were found to be novel genes related to androstenone metabolism. Dickkopf-related protein 2 is encoded by theDKK2gene which was identified as the highest up regulated gene in our study (Table 3).DKK2can act as either an agonist or antagonist of Wnt/beta-catenin signalling [41]. WNT signalling in the testis has not been well understood, however it has been shown to play an important role in proliferation and self-renewal of mouse and human spermatogonia [42]. Mutation in b-catenin leads to the over activity ofb-catenin in Sertoli cells caused testicular cord disruption, germ cell depletion, and inhibition of Mu¨llerian duct regression suggesting that inhibition of b-catenin signalling is essential for Sertoli cell and testicular cord mainte-nance and germ cell survival [43]. Baes et al. [44] found that breeding against androstenone may have slightly adverse effects on semen quality. In the light of these external references it could be speculated that up regulation ofDKK2gene in this study may have antagonistic effect on Wnt/beta-catenin signalling pathway which has shown to cause negative effects on sperm production.KRT82
was the highest down regulated gene in high androstenone testis tissues in our study (Table 3). The protein encoded by this gene is a member of the keratin gene family which contains at least 54 functional keratin genes in humans [45]. Keratin-related genes are known to be affected by androgen exposure, especially by Dihydrotestosterone (DHT) exposure [46]. Relation of DHT with androsterone has been shown by Rizner et al. [47]. These literature evidences show that down-regulation ofKRT82gene is the end result of high androgen metabolism in testis and not directly involved in androsterone synthesis.
There are similarities between gene expression differences found with RNA-Seq and those reported in previous microarray studies in porcine testis and liver tissues [27;28;29]. Grindflek et al. [48] and Moe et al. [29] reported cytochrome P450 superfamily genes to be differentially regulated in their investigated testis samples. In our study, other members of cytochrome P450 family genes were found to be differentially regulated in addition to genes reported by these previous studies. Our findings showed that genesCYP4B1, CYP4A11andCYP2C33were up regulated and geneCYP2B22was down regulated (Table 3). Among these genes, CYP4A11 was enriched in Gene Ontology categories molecular transport, small molecule biochemistry and lipid metabolism and gene CYP4B1 was revealed in small molecule biochemistry (Table 5). In accordance with our results, Moe et al. [29] also showed lipid metabolism to be one of the enriched GO categories for DEGs in testis samples.
In addition to transcriptome quantification, RNA-Seq technol-ogy provides valuable information regarding gene polymorphisms which could be directly correlated with the relevant phenotype. Several holistic gene expression analyses have been performed for boar taint compounds by using microarray or Real-Time PCR technology [27;28;29]. Our study extends these observations by correlating differentially regulated genes with associated polymor-phisms. Gene polymorphisms in the exonic regions might have direct effect on the expression of transcripts and connecting our identified polymorphisms from RNA deep sequencing with GWAS studies may give additional insight to variation in the androstenone levels. Results in our study revealed 12 mutations in androstenone testis samples (Table 7). On SSC3 four polymor-phism were identified, two at 35 Mb (insertion) on geneHBA2, Figure 1. Heatmap showing differentially expressed genes in (A) testis and (B) liver samples.The red blocks represent over expressed genes, and the green blocks represent under expressed genes. Legend: A1–A5 testis with low androstenone and A6–A10 testis with high androstenone, B1–B5 liver with low androstenone and B6–B10 liver with high androstenone.
Table 3.Differentially expressed genes in testis androstenone samples.
Gene Orthologue gene description Reference ID
Log fold
change p-adj.
DKK2 Dickkopf homolog 2 XM_003129269.1 2.89 4.46e-06
AMN Amnionless homolog XM_001925648.2 2.28 0.025
LOC100519550 LOC100519550 XM_003127761.1 2.22 9.67e-12
CYP4B1 Cytochrome P450 family 4 subfamily B. polypeptide 1 XM_003128017.1 2.20 8.55e-10 CD244 CD244 molecule natural killer cell receptor 2 B4 XM_001928325.2 2.15 5.35e-08 ADAMTS4 A disintegrin and metalloproteinase with thrombospondin
motifs 4-like
XM_001927507.2 2.10 0.04
CYP4A11 Cytochrome P450 family 4 subfamily A polypeptide 11 XM_003128032.1 2.03 3.38e-06
HAL Histidine ammonia-lyase XM_001925061.1 2.03 0.014
CYP2C33 Cytochrome P450 2C33 NM_214414.1 1.91 0.04
AMY2B Amylase, alpha 2B (pancreatic) XM_003125887.1 1.85 0.002
ARG2 Arginase type II XM_001928679.2 1.84 6.96e-06
LOC100516362 LOC100516362 XM_003124870.1 1.74 0.022
LOC100521272 LOC100521272 XM_003126855.1 1.71 4.46e-05
MSMO1 Methylsterol monooxygenasse 1 NM_213752.1 1.66 5.55e-08
KRT4 Keratin 4 XM_001927218.2 21.52 0.02
MPP7 Membrane protein, palmitoylated 7 XM_003130762.1 21.54 0.0004
DSP Desmoplakin XM_003128168.1 21.55 6.03e-05
AMHR2 Anti-Mullerian hormone receptor, type II XM_003126187.1 21.58 0.025
SLA-3 MHC class I antigen 3 AB105388.1 21.60 5.15e-07
HAAO 3-hydroxyanthranilate 3,4-dioxygenase XM_003125193.1 21.61 0.004
MX1 Myxovirus (influenza virus) resistance 1 NM_214061.1 21.62 1.63e-09
MX2 Myxovirus (influenza virus) resistance 2 NM_001097416.1 21.63 7.47e-06
IFIT2 Interferon-induced protein with tetratricopeptide repeats 2 XM_001928671.2 21.64 0.0094
HBB Hemoglobin, beta NM_001144841.1 21.69 2.12e-08
ARL4C ADP-ribosylation factor-like 4C XM_003133753.1 21.72 0.04
EDN1 Endothelin 1 NM_213882.1 21.73 0.004
HBM Hemoglobin, mu XM_003124683.1 21.74 0.04
HBD Hemoglobin, delta XM_003129515.1 21.83 1.93e-07
HBA2 Hemoglobin, Alpha 2 XM_003124688.1 21.90 7.42e-11
HBA2 Hemoglobin, Alpha 2 XM_003124690.1 21.90 2.17e-10
HBA2 Hemoglobin, Alpha 2 XM_003124687.1 21.93 1.87e-11
HBA2 Hemoglobin, Alpha 2 XM_003124689.1 21.95 2.62e-11
HBA2 Hemoglobin, Alpha 2 XM_003124685.1 21.97 1.87e-11
HBA2 Hemoglobin, Alpha 2 XM_003124684.1 21.97 1.87e-11
HBA2 Hemoglobin, Alpha 2 XM_003124686.1 21.99 1.38e-11
FRK Fyn-related kinase XM_001925792.2 22.12 0.002
IRG6 Inflammatory response protein 6 NM_213817.1 22.17 7.24e-07
SYT10 Synaptotagmin 10 XM_001927016.2 22.23 9.03e-05
S100A2 S100 calcium binding protein A2 XM_001929559.1 22.35 0.0008
CD5 CD5 molecule XM_003122679.1 22.42 0.02
CYP2B22 Cytochrome P450 2B22 NM_214413.1 22.48 0.02
CYTL1 Cytokine-like 1 XM_003128849.1 2.82 0.002
S100A2 S100 calcium binding protein A2 XM_001929556.1 22.83 1.42e-07
CHRNA3 Cholinergic receptor, nicotinic, alpha 3 XM_001925760.2 23.45 5.07e-08
OLFRA03 Olfactory receptor 3A1 XM_001926523.1 24.12 0.01
KRT82 Keratin 82 XM_003126157.1 24.68 1.49e-09
one at 48 Mb (SNP) on geneLOC100516362and one at 118 Mb (SNP) on geneIRG6(Table 7). Grindflek et al. [2] found two QTL regions on the same chromosome for androstenone at 38 to 40 Mb in Duroc breed by using SNP chip genotyping which is in agreement with our results. Similar to our detected SNP at
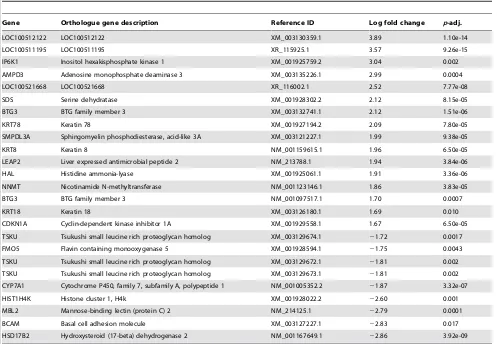
118 Mb, an androstenone QTL on SSC3 was identified between 113 Mb and 122 Mb regions in Duroc, Landrace and Yorkshire breeds [23]. We identified a SNP on SSC4 at position 93 Mb on geneCD244, however, no previous QTL region associated with boar taint related traits was reported before. Three polymorphisms Table 4.Differentially expressed genes in liver androstenone samples.
Gene Orthologue gene description Reference ID Log fold change p-adj.
LOC100512122 LOC100512122 XM_003130359.1 3.89 1.10e-14
LOC100511195 LOC100511195 XR_115925.1 3.57 9.26e-15
IP6K1 Inositol hexakisphosphate kinase 1 XM_001925759.2 3.04 0.002
AMPD3 Adenosine monophosphate deaminase 3 XM_003135226.1 2.99 0.0004
LOC100521668 LOC100521668 XR_116002.1 2.52 7.77e-08
SDS Serine dehydratase XM_001928302.2 2.12 8.15e-05
BTG3 BTG family member 3 XM_003132741.1 2.12 1.51e-06
KRT78 Keratin 78 XM_001927194.2 2.09 7.80e-05
SMPDL3A Sphingomyelin phosphodiesterase, acid-like 3A XM_003121227.1 1.99 9.38e-05
KRT8 Keratin 8 NM_001159615.1 1.96 6.50e-05
LEAP2 Liver expressed antimicrobial peptide 2 NM_213788.1 1.94 3.84e-06
HAL Histidine ammonia-lyase XM_001925061.1 1.91 3.36e-06
NNMT Nicotinamide N-methyltransferase NM_001123146.1 1.86 3.83e-05
BTG3 BTG family member 3 NM_001097517.1 1.70 0.0007
KRT18 Keratin 18 XM_003126180.1 1.69 0.010
CDKN1A Cyclin-dependent kinase inhibitor 1A XM_001929558.1 1.67 6.50e-05
TSKU Tsukushi small leucine rich proteoglycan homolog XM_003129674.1 21.72 0.0017
FMO5 Flavin containing monooxygenase 5 XM_001928594.1 21.75 0.0043
TSKU Tsukushi small leucine rich proteoglycan homolog XM_003129672.1 21.81 0.002 TSKU Tsukushi small leucine rich proteoglycan homolog XM_003129673.1 21.81 0.002 CYP7A1 Cytochrome P450, family 7, subfamily A, polypeptide 1 NM_001005352.2 21.87 3.32e-07
HIST1H4K Histone cluster 1, H4k XM_001928022.2 22.60 0.001
MBL2 Mannose-binding lectin (protein C) 2 NM_214125.1 22.79 0.0001
BCAM Basal cell adhesion molecule XM_003127227.1 22.83 0.017
HSD17B2 Hydroxysteroid (17-beta) dehydrogenase 2 NM_001167649.1 22.86 3.92e-09
doi:10.1371/journal.pone.0063259.t004
Figure 2. Functional grouping of DEGs in testis with high and low androstenone using Ingenuity Pathways Analysis (IPA) software.
The most significant functional groups (p,0.05) are presented graphically. The bars represent thep-value on a logarithmic scale for each functional group.
were identified on SSC7, two SNPs on geneDSPat 4.9 Mb and an insertion polymorphism at 99 Mb on geneARG2. SNP genotyping study by Grindflek et al. identified an androstenone related QTL region on chromosome 7 between region 80.8 Mb and 88.3 Mb [2] which is in close proximity to the polymorphism detected on geneARG2in this study. Additionally, Ren et al. [49] identified a male reproductive trait (testosterone level) related QTL on the same chromosome at 77.2 cM region. In our study, two SNPs were identified on geneMX1at position 144 Mb on SSC13, yet to the best of our knowledge no QTL regions related with boar taint or male reproductive traits has been reported in this region. On SSC14 at position 106 Mb, two SNPs were identified on gene IFIT2. Cross matching the chromosomal positions of these SNPs with data from dbSNP database showed that one of the SNPs (at position 106,102,335) has already been annotated in the SNP database (dbSNP ID: rs80925743). A QTL region for androste-none was identified on the same chromosome between 87.9 cM and 108.7 cM by Lee et al. [24] and the SNPs identified in our study fit into this previously identified androstenone QTL region.
Differential Gene Expression and Gene Polymorphism Analysis in Liver
Twenty five genes were found to be differentially regulated in liver tissue with divergent androstenone levels (Table 4). The top
two up regulated genes in our liver sample wereLOC100512122 with log fold change 3.89 andLOC100511195with log fold change 3.57. However, we were not able to identify either the gene names or function through orthologue databases or BLAST sequence similarity searches. As a result, the functions of these genes cannot be discussed in detail here.
IP6K1was the third highest up regulated in our liver samples. Inositol hexakisphosphate kinase 1 (IP6K1) is a member of the inositol phosphokinase family which encodes protein responsible for the conversion of inositol hexakisphosphate (InsP6) to dipho-sphoinositol pentakisphosphate (InsP7/PP-InsP5) [50]. Chakra-borty et al. [51] have shown that targeted deletion of IP6K1 in mice liver has increased Akt and mTOR signalling and decreased GSK3b signalling. Since this gene is highly expressed in liver, several factors including the diet of the sample population might have a larger impact on the expression of this gene. At this point, we are not able to pinpoint the effect of this gene (IP6K1) on androstenone metabolism in liver.
In our liver sample,HSD17B2was the highest down regulated gene with fold change22.86 (Table 4). Hydroxysteroid (17-beta) dehydrogenase 2 (HSD17B2) regulate the availability of testoster-one and androsteneditestoster-one in tissues by catalysing interconvertion of active and inactive forms of steroids [52]. Gene expression studies by Moe et al. [28] have also shown the down regulation of Table 5.Functional categories and corresponding DEGs in high androstenone testis tissues.
Function Number of genes p-value* Genes
Molecular transport 9 1.00E-05 to 4.96E-02 HBB, HBD, HBA1/HBA2, CYP4A11, EDN1, MARCO, AMN, CD44, CD5
Small molecule biochemistry 12 1.00E-05 to 4.95E-02 HBB, HBD, ARG2, HBA1/HBA2,CYP4B1, MX1, CYTL1, CYP4A11, MARCO, MSMO1, DSP
Amino acid metabolism 4 3.80E-04 to 3.48E-02 ARG2, EDN1, HAL, FRK
Embryonic development 4 6.80E-04 to 4.40E-02 HBB, HBD, CYTL1, EDN1
Carbohydrate metabolism 3 7.54E-04 to 4.96E-02 CD244, EDN, CYTL1
Lipid metabolism 7 7.54E-04 to 4.96E-02 CD244, EDN1, CYP4A11, HBB, MARCO, MSMO1, DSP Reproductive system development and
function
2 1.95E-03 to 4.96E-02 NQO1, TNC
Protein synthesis 3 1.03E-02 to 2.70E-02 HBA1/HBA2, HBB, ADAMTS4
Energy production 2 1.64E-03 to 2.43E-02 EDN1, MARCO
Vitamin and mineral metabolism 3 1.50E-02 to 2.37E-02 EDN1, CD244, CD5 *Numbers in thep-value column showed a range ofp-values for the genes from each category.
doi:10.1371/journal.pone.0063259.t005
Figure 3. Functional grouping of DEGs in liver with high and low androstenone using Ingenuity Pathways Analysis software.The most significant functional groups (p,0.05) are presented graphically. The bars represent thep-value on a logarithmic scale for each functional group.
HSD17B2gene in liver sample. Moreover, different members of the HSD enzyme family (HSD17B4,HSD17B11andHSD17B13) were found to be differentially regulated in Duroc and Norwegian Landrace populations [28].
Our results showed that cytochrome P450 family geneCYP7A1 is differentially regulated in liver samples. CYP7A1 is the
rate-limiting enzyme in the synthesis of bile acid from cholesterol. The conversion of cholesterol to bile acid is the major pathway for cholesterol metabolism [30].CYP7A1is a cytochrome P450 heme enzyme that oxidizes cholesterol using molecular oxygen. Down-regulation ofCYP7A1causes reduced fat catabolism in liver which may lead to higher fat accumulation and androstenone level due to Table 6.Functional categories and corresponding DEGs in high androstenone liver tissues.
Function Number of genes p-value* Genes
Amino acid metabolism 3 8.71E-06 to 3.49E-02 HAL, SDS, CDKN1A
Small molecule biochemistry 8 8.71E-06 to 2.51E-02 HAL, CYP7A1, MBL2, AMPD3, HSD17B2, IP6K1, SDS, CDKN1A
Cellular development 4 3.15E-04 to 2.49E-02 CDKN1A, KRT8, HIST1H4A, MBL2
Lipid metabolism 5 1.10E-03 to 2.41E-02 CYP7A1, MBL2, HSD17B2, IP6K1, CDKN1A, KRT8
Molecular transport 3 1.11E-03 to 4.41E-02 CYP7A1, MBL2, CDKN1A
Cell function and maintenance 4 1.20E-03 to 4.90E-02 CDKN1A, MBL2, KRT8, KRT18 Cell growth and proliferation 3 1.20E-03 to 2.90E-02 CDKN1A, MBL2, KRT8 *Numbers in thep-value column showed a range ofp-values for the genes from each category.
doi:10.1371/journal.pone.0063259.t006
Figure 4. qRT-PCR validations for ten DEGs from divergent androstenone levels in (A and C) testis and (B and D) liver samples.Fold change determined via division of high androstenone group gene expression value by low androstenone group gene expression value.
the dynamic relationship between androstenone in plasma and adipose tissue [53]. Gene expression profiles by Moe et al. [28] have also shown cytochrome P450 family genes to be differentially regulated in liver samples.
Another gene family found to be differentially expressed in our transcriptome analysis is flavin-containing monooxygenases (FMOs) gene family. The FMO family of enzymes converts lipophilic compounds into more polar metabolites and decreases activity of the compounds [54]. In the study conducted by Moe et al. [28], using microarray analysis,FMO1is reported to be up-regulated in higher androstenone pigs. In contrast, FMO5 was found to be down-regulated in high androstenone liver samples in our study. Since androstenone is a lipophilic compound, we speculate that androstenone level was negatively correlated with FMO5activity. Since androstenone is a lipophilic compound, we speculate that androstenone level was negatively correlated with FMO5activity.
Among the differentially expressed genes in liver, the gene CDKN1Awas enriched in GO categories amino acid metabolism, small molecule biochemistry, lipid metabolism and molecular transport. The differentially expressed geneCYP7A1was enriched in GO categories such as small molecule biochemistry, lipid metabolism and molecular transport. Gene Ontology functional analysis by Moe et al [28] has also shown that the GO categories lipid metabolism and amino acid metabolism were enriched.
Gene polymorphism analysis has shown that there were thirty six mutations in 11 DEGs in liver samples (Table 8). Eight SNPs were identified on SSC4 at position 77 Mb (Table 8) which were mapped to gene CYP7A1. In close adjacency to this region Quintanilla et al. [25] identified an androstenone related QTL at position 72 cM. An additional SNP was identified on SSC4 at position 104 Mb mapped to gene FMO5however, this position was not mapped as androstenone related QTL region by any previous studies. Our results have also shown that this SNP at position 104,473,018 has been already reported in dbSNP database (dbSNP ID: rs80837900) (Table 8). Six polymorphisms on SSC5 at position 16.7 Mb were mapped to geneKRT8. Out of these identified polymorphisms, four SNPs were previously mapped to dbSNP database (Table 8). Another set of 6 polymorphisms on SSC 5 at position 16.7 Mb mapped to the gene KRT18. Three SNPs among these six polymorphisms were
already identified and reported in dbSNP database (Table 8). Grindflek et al. [2] detailed an androstenone QTL region on SSC5 between 20.4 and 22.2 Mb in close proximity to our reported polymorphisms (Table 8). An insertion gene polymor-phism at position 82 Mb on the same chromosome mapped to HAL gene was also indentified in our study. On SSC 7 we identified 3 SNPs, one at position 22 Mb on geneHIST1H4Kand two at position 36 Mb mapped to geneCDKN1A. One of the SNP mapped to CDKN1A at position 36.9 Mb has already been reported in dbSNP database (dbSNP ID: rs80964639). An androstenone QTL region on SSC7 between position 33.6 and 88.3 Mb was already described by Grindflek et al. [2]. Two SNPs on CDKN1A identified in our study falls into this previously mentioned QTL region. Genome wide association study by Grindflek et al. [2] described androstenone related QTL region on SSC9 at position 7.5 to 8.0 Mb. We report an SNP on the same chromosome at position 10 Mb, close to the previously reported QTL region (Table 8). In addition, we obtained an insertion polymorphism mapped toNNMT gene at position 40 Mb. We identified two polymorphisms at 38 Mb on SDS gene in the vicinity of the androstenone QTL region on SSC14 at 37 cM [25]. Furthermore, our analysis revealed 7 additional SNPs on SSC14 at 101 Mb onMBL2gene. Lee et al. [24] described a QTL on SSC14 at position 87.9 to 108.7 cM for androstenone in the Large White6Meishan crossbred population.
Selected polymorphisms in genes IRG6, MX1, IFIT2, FMO5, CYP7A1 and KRT18 were found to be associated with the phenotype androstenone level in this study (Table 9). An association study was performed for a SNP (g.494 A.G) in the FMO5gene but no statistical relation could be detected with the off flavour score in the Berkshire x Yorkshire resource population [55]. Location ofIFIT2 gene on SSC14 incorporated the QTL affecting androstenone in Yorkshire pig [56] and subjective pork flavour in Large White and Meishan pigs [24]. MX1 is an interesting candidate gene for disease resistance in farm animals [57] but this study first identifies association with boar taint compounds. No study investigated association of CYP7A1 with boar taint compounds. Some study reported association of this gene with plasma cholesterol in pigs [58]. Boar taint is related to the adipose tissues since lean pigs have low boar taint compounds [59]. The function of highly polymorphic KRT18 is relating to Table 7.Polymorphisms detected in testis samples.
Refseq ID Gene name SSC Position dbSNP Reference Alternate Quality RMSPSa SNP Classification Sample group
XM_003124689 HBA2 3 35253219 0 G GA 333.66 39.10 Insertion High and Low
XM_003124689 HBA2 3 35253521 0 G GCTC 617.84 39.89 Insertion High and Low
NM_213817 IRG6* 3 118838598 0 G A 181.62 37.00 Synonymous Low androstenone
XM_003124870 LOC100516362 3 48107044 0 G GT 260.38 38.59 Insertion High androstenone
XM_001928325 CD244 4 93149337 0 T A 84.61 36.72 Synonymous High androstenone
XM_003128168 DSP 7 4940734 0 G A 31.18 37.00 Synonymous Low androstenone
XM_003128168 DSP* 7 4944881 0 C T 69.47 37.00 Synonymous Low androstenone
XM_001928679 ARG2 7 99786827 0 A AT 106.28 39.51 Insertion High androstenone
NM_214061 MX1 13 144402807 0 A G 43.93 37.40 Non- synonymous High androstenone
NM_214061 MX1* 13 144420441 0 C T 59.51 37.00 Non- synonymous Low androstenone
XM_001928671 IFIT2* 14 106102335 rs80925743 G T 98.81 37.00 Synonymous Low androstenone
XM_001928671 IFIT2 14 106102694 0 G A 40.63 37.00 Synonymous Low androstenone
*the SNP validated in boar population using RFLP (see Table 9). aRoot mean square phred score.
pathological processes in liver but involvement in boar taint is not quite clear. However, this gene maps close to a region on SSC5 affecting androstenone in pigs [2].
Conclusion
Here we showed whole genome expression differences for varying androstenone levels in testis and liver tissues. RNA-Seq provided high resolution map of transcriptional activities and genetic polymorphisms in these tissues. However, due to incomplete porcine annotations, only around 50% of the total reads could be mapped to annotated references. The improve-ments in pig genome annotations may lead to better coverage and
detailed understanding of genetic and functional variants such as novel transcripts, isoforms, sequence polymorphisms and non-coding RNAs. Integration of high throughput genomic and genetic data (eQTL) with proteomic and metabolomic data can provide additional new insight into common biological processes and interaction networks responsible for boar taint related traits.
On the basis of number of DEGs, our results confirm that transcriptome activity in testis is higher in comparison to liver tissue for androstenone biosynthesis. These results also show that the entire functional pathway involved in androstenone metabo-lism is not completely understood and through this study, we propose additional functional candidate genes such as,DKK2and Table 8.Polymorphisms detected in liver samples.
Refseq ID Gene name SSC Position dbSNP Reference Alternate Quality RMSPSa SNP Classification Sample group
XM_001928594 FMO5* 4 104473018 rs80837900 G A 112.94 37.02 Synonymous Low androstenone
NM_001005352 CYP7A1 4 77195279 0 G A 1373.52 37.15 Non-synonymous Low androstenone
NM_001005352 CYP7A1 4 77195397 0 T C 4026.2 36.93 Synonymous High and Low
NM_001005352 CYP7A1 4 77197364 0 T C 1624.62 37.00 Synonymous High and Low
NM_001005352 CYP7A1 4 77199510 0 A T 416.26 37.00 Synonymous Low androstenone
NM_001005352 CYP7A1 4 77199576 0 T G 242.3 36.07 Synonymous Low androstenone
NM_001005352 CYP7A1 4 77200294 0 G A 274.6 37.00 Synonymous Low androstenone
NM_001005352 CYP7A1 4 77200408 rs80923210 A G 494.32 36.44 Synonymous Low androstenone NM_001005352 CYP7A1* 4 77201533 rs196960866 A G 1880.98 37.00 Synonymous Low androstenone
NM_001159615 KRT8 5 16715238 rs80814240 C T 2365.07 36.65 Synonymous High and Low
NM_001159615 KRT8 5 16718099 rs80845521 C T 2186.76 37.01 Synonymous High and Low
NM_001159615 KRT8 5 16720725 0 G GT 1160.84 39.98 Insertion High and Low
NM_001159615 KRT8 5 16721108 0 GGT G 355.1 38.63 Deletion High and Low
NM_001159615 KRT8 5 16721708 rs55618932 T C 2941.94 36.61 Synonymous High and Low
NM_001159615 KRT8 5 16721831 rs80916149 A G 9343.88 37.02 Synonymous High and Low
XM_003126180 KRT18* 5 16788495 0 G A 327.13 37.16 Synonymous Low androstenone
XM_003126180 KRT18 5 16789240 0 G GA 304.54 38.77 Insertion High and Low
XM_003126180 KRT18 5 16789379 rs81211893 G A 596.36 36.52 Synonymous High and Low
XM_003126180 KRT18 5 16789412 rs81211894 A G 2116.22 36.56 Synonymous High and Low XM_003126180 KRT18 5 16789808 rs81211895 G C 2188.63 36.89 Synonymous High and Low
XM_003126180 KRT18 5 16789954 0 A ATC 926.56 35.84 Insertion High Androstenone
XM_001925061 HAL 5 82556747 0 G GT 80.57 40.20 Insertion High Androstenone
XM_001928022 HIST1H4K 7 22186329 0 C T 717.72 33.45 Synonymous Low androstenone
XM_001929558 CDKN1A 7 36992673 rs80964639 A G 544.05 37.00 Synonymous High Androstenone
XM_001929558 CDKN1A 7 36992792 0 A G 214.41 37.00 Synonymous High and Low
XM_003129674 TSKU 9 10759263 0 G A 127.72 36.56 Synonymous Low androstenone
NM_001123146 NNMT 9 40584781 0 G GA 460.61 42.34 Insertion High and Low
NM_214125 MBL2 14 101464163 0 C T 236.74 38.58 Synonymous High and Low
NM_214125 MBL2 14 101464174 0 T G 624.35 38.02 Synonymous High and Low
NM_214125 MBL2 14 101464216 0 A T 2136.83 37.43 Synonymous High and Low
NM_214125 MBL2 14 101464268 0 A G 2123.64 37.42 Synonymous High and Low
NM_214125 MBL2 14 101464309 0 T C 1038.03 37.83 Synonymous High and Low
NM_214125 MBL2 14 101464842 0 A ACT 1693.34 37.6 Insertion High and Low
NM_214125 MBL2 14 101467788 0 A G 4598.53 36.97 Synonymous High and Low
XM_001928302 SDS 14 38865735 0 G GT 194.2 39.81 Synonymous High Androstenone
XM_001928302 SDS 14 38868514 0 C T 51.13 37.00 Non- synonymous Low androstenone
*the SNP validated in boar population using RFLP (see Table 9). aRoot mean square phred score.
CYP2B22 in testis and IP6K1 and HSD17B2 in liver for androstenone metabolism. Importantly, most of the DEGs are in QTL positions functionally related to pathways involved in boar taint. Furthermore, various gene polymorphisms were also detected in testis and liver DEGs and associations are validated with androstenone levels. Potential polymorphisms and association were identified in DEGs such asIRG6, MX1,and IFIT2in testis andCYP7A1,FMO5andKRT18in liver. This transcriptome and polymorphisms analysis using RNA deep sequencing combining with association analysis has revealed potential candidate genes affecting boar taint compound. It is speculated that these polymorphisms could be used as biomarkers for boar taint related traits. However, further validation is required to confirm the effect of these biomarkers in other animal populations.
Materials and Methods
Animals and Phenotypes
Tissue samples and phenotypes were collected from the Duroc 6 F2 cross animals. F2 was created by crossing F1 animals (Leicoma 6German Landrace) with Large White pig breed. Duroc6F2 boars were on average 116 days old and had on average 90 kg live weight when slaughtered. All pigs were slaughtered in commercial abattoir, called Landesanstalt fu¨r Schweinezucht – LSZ Boxberg. Slaughterhouse management gave the necessary permissions for the tissue and organ collections. Animals were bred and growth, carcass and meat quality data were collected according to guidelines of the German performance test [60]. Tissue samples from testis and liver were frozen in liquid nitrogen immediately after slaughter and stored at 280uC until used for RNA extraction. Fat samples were collected from the neck and stored at220uC until used for androstenone measurements. For the quantification of androstenone an in-house gas-chroma-tography/mass spectrometry (GC-MS) method was applied as described previously [61]. Pigs having a fat androstenone level less than 0.5mg/g and greater than 1.0mg/g were defined as low and high androstenone samples, respectively. Ten boars were selected
from a pool of 100 pigs and the average androstenone value for these selected animals was 1.3660.45mg/g. Notably, these 100 boars were used for association study (Table S3 and Table S4). RNA was isolated from testis and liver of 5 pigs with extreme high (2.4860.56mg/g) and 5 pigs with extreme low levels of andros-tenone (0.2460.06mg/g). Total RNA was extracted using RNeasy Mini Kit according to manufacturer’s recommendations (Qiagen). Total RNA was treated using on-column RNase-Free DNase set (Promega) and quantified using spectrophotometer (NanoDrop, ND8000, Thermo Scientific). RNA quality was assessed using an Agilent 2100 Bioanalyser and RNA Nano 6000 Labchip kit (Agilent Technologies).
Library Construction and Sequencing
Full-length cDNA was obtained from 1mg of RNA, with the SMART cDNA Library Construction Kit (Clontech, USA), according to the manufacturer’s instructions. Libraries of ampli-fied RNA for each sample were prepared following the Illumina mRNA-Seq protocol. The library preparations were sequenced on an Illumina HiSeq 2000 as single-reads to 100 bp using 1 lane per sample on the same flow-cell (first sequencing run) at GATC Biotech AG (Konstanz, Germany). All sequences were analysed using the CASAVA v1.7 (Illumina, USA). The deep sequencing data have been deposited in NCBI SRA database and are accessible through GEO series accession number GSE44171 (http://www.ncbi.nlm.nih.gov/geo/query/acc.
cgi?acc = GSE44171).
Reference Sequences and Alignment
Two different reference sequence sets were generated from NCBI Sscrofa 9.2 assembly: (1) the reference sequence set generated for differential expression analysis comprised of RefSeq mRNA sequences (cDNA sequences) and candidate transcripts from NCBI UniGene database (Sscrofa). (2) For gene variation analysis a different reference sequence set, generated from whole genome sequence (chromosome assembly) was used. During Table 9.Genotype and association analysis of selected candidate genes with androstenone.
Polymorphism
Boar taint compound
[Ln(mg/g)] Genotype (m±S.E.) Effect (m±S.E.)
GG GA AA Additive Dominance
IRG6 G.A Androstenone 4.9360.30c 5.95
IFIT2 G.T Androstenone 6.2760.18a 5.63
60.18b 5.61
CYP7A1 A.G Androstenone 4.6360.32a 5.60
60.22b 5.73 60.08b
20.5560.16 ** 20.4260.26
GG GA AA
KRT18 G.A Androstenone 5.7060.01c
5.8260.23c 4.5960.30d 20.5560.15 ** 20.6660.25* a,b,0.05; c,d,0.01; e,f,0.001;
*p,0.05; **p,0.01.
sequencing experiment, Sscrofa NCBI 10.2 assembly was not released and Sscrofa 9.2 covered ,8.5 K unannotated SNPs (dbSNP database). The released Sscrofa 10.2 assembly consists of 566 K SNP http://www.ncbi.nlm.nih.gov/Taxonomy/Browser/ wwwtax.cgi?mode = Info&id = 9823 (Accession date 4/02/2013) with annotation information for 460 K SNP (dbSNP database). In order to make use of this enriched SNP information, we used NCBI Remap tool (http://www.ncbi.nlm.nih.gov/genome/tools/ remap) to convert Sscrofa 10.2 SNP genomic positions to Sscrofa9.2 positions. Using the whole chromosomal assembly for read mapping in gene variation analysis step allowed us to match the polymorphisms identified in this analysis with polymorphisms available for porcine genome in dbSNP database based on chromosomal positions. Raw reads were mapped to reference sets using BWA algorithm (http://bio-bwa.sourceforge.net/) with the default parameters [62].
Differential Gene Expression Analysis
The differential gene expression analysis was designed to contrast the difference in the expression of genes between high and low androstenone samples. For differential gene expression analysis with raw count data a R package DESeq was used [33]. The normalization procedure in DESeq handles the differences in the number of reads in each sample. For this purpose, DESeq first generates a fictitious reference sample, with read counts defined as the geometric mean of all the samples. The read counts for each gene in each sample is divided by this geometric mean to obtain the normalized counts. To model the null distribution of the count data, DESeq follows an error model that uses the negative binomial distribution, with variance and mean linked by local regression. The method controls type-I error and provides good detection power [33]. After analysis using DESeq, DEGs were filtered based onp-adjusted value [63] 0.05 and fold change$1.5. Additionally, the gene expression data was also analyzed using a Generalized Linear Model (GLM) function implemented in DESeq to calculate both within and between group deviances. As sanity checking and filtration step, we cross matched the results from both analysis (p-adjusted #0.05 and fold change $1.5 criteria and GLM analysis) and only those genes which appeared to be significant in both the tests (p-value#0.05), were selected for further analysis. The results of GLM analysis are given in Table S2.
Gene Variation Analysis
For gene variation analysis the mapping files generated by aligning the raw reads to reference sequence set (2) were used. All the downstream analysis was performed using Genome Analysis Toolkit (GATK) [64] and Picard Tools (http://picard.sourceforge. net/). The Genome Analysis Toolkit (GATK) was used for local realignment incorporating Sscrofa 9.2 converted SNPs which was described in the previous section. SNPs were furthermore classified as synonymous or non-synonymous using the GeneWise software (http://www.ebi.ac.uk/Tools/psa/genewise/last accessed 21.03.2013) by comparing between protein sequence and nucleotides incorporated SNP position [65]. Covariate counting and base quality score recalibration were done using the default parameters suggested by GATK toolkit. The re-aligned and recalibrated mapping files were grouped according to tissue and phenotype categories. Variant calling was performed for each group using GATK UnifiedGenotyper [64]. To find out the differentially expressed genes that also harboured sequence polymorphisms, we filtered the results from UnifiedGenotyper with chromosomal positions of DEGs and retained only those which mapped to DEG chromosomal positions. By this way, we
were able to isolate a handful of mutations that mapped to DEGs from many thousands of identified potential sequence polymor-phisms. Additionally to understand whether these identified polymorphisms segregate either in only one sample group (high androstenone or low androstenone group) or in both the groups (high and low androstenone group) we calculated the read/ coverage depth of these polymorphisms in all the samples. The results of this analysis are detailed in the results section and read coverage for individual samples are given in Table S2.
Pathways and Networks Analysis
A list of the DEGs was uploaded into the Ingenuity Pathway Analysis (IPA) software (Ingenuity Systems, www.ingenuity.com) to identify relationships between the genes of interest and to uncover common processes and pathways. The ‘Functional Analysis’ tool of the IPA software was used to identify the biological functions that were most significant to the data set [5].
Quantitative Real-Time PCR (qRT-PCR) Analysis
For qRT-PCR experiment, total RNA from testis and liver samples were isolated from the 10 boars used for deep sequencing. Additionally, RNA was isolated from the similar tissues of 10 independent boars with divergent androstenone level among the remaining 90 boars. cDNA were synthesised by reverse transcrip-tion PCR using 2mg of total RNA, SuperScript II reverse transcriptase (Invitrogen) and oligo(dT)12 primer (Invitrogen). Gene specific primers for the qRT-PCR were designed by using the Primer3 software [66]. Detailed information for primers used in this study was given in Table 10. In each run, the 96-well microtiter plate contained each cDNA sample and no-template control. The qRT-PCR was conducted with the following program: 95uC for 3 min and 40 cycles 95uC for 15 s/60uC for 45 s on the StepOne Plus qPCR system (Applied Biosystem). For each PCR reaction 10ml iTaqTM SYBRHGreen Supermix with Rox PCR core reagents (Bio-Rad), 2ml of cDNA (50 ng/ml) and an optimized amount of primers were mixed with ddH2O to a final reaction volume of 20ml per well. All samples were analysed twice (technical replication) and the geometric mean of the Ct values were further used for mRNA expression profiling. The geometric mean of two housekeeping genes GAPDH and PPIA were used for normalization of the target genes. The delta Ct (DCt) values were calculated as the difference between target gene and geometric mean of the reference genes: (DCt = Cttarget2Ct
house-keeping genes) as described in Silver et al. [67]. Final results were reported as fold change calculated from delta Ct-values. Details of primers which were used for qRT-PCR study are shown in Table 10.
Validation of SNP and Association Study
Gene Reference ID Primer sequences (59R39) Application Position* Enzyme Annealing temperature (6C) Product size (bp) RFLP-patterns
CYP2B22 NM_214413.1 F: CACCACCATCCTCCAGAACT R:
GGCAGGAACTGGATCTGGTA
qRT-PCR – – 52 120 –
ARG2 XM_001928679.2 F: GGAAGCTGGCTTGATGAAAA R:
CCACTGAGCGAGGATTCACT
qRT-PCR – – 55 128 –
MSMO1 NM_213752.1 F: CCTGGCACTATTTCCTGCAT R:
TAGGGTTTCCAGAGGGTGTG
qRT-PCR – – 55 128 –
EDN1 NM_213882.1 F: TTCAGGGAGAAACACCCAAG
R:CGAGACGGAAGAAAGCAAAG
qRT-PCR – – 55 121 –
CYP2C33 NM_214414.1 F: AGCTGTGCCTCATCCCTAGA R:
GTGTTTCTGTCCCAGGCAAT
qRT-PCR – – 56 133 –
IP6K1 XM_001925759.2 F: CTGCCAGCCTGTGTCTGTAA R:
ATGGCACCAGAATCAGAAGG
qRT-PCR – – 55 136 –
BTG3 XM_003132741.1 F: CCAGGAATGTACCGAGGAAA R:
ACAATGCATTCCAGGAGGAG
qRT-PCR – – 55 138 –
CYP7A1 NM_001005352.2 F: TTCCCGATTCATGTGTTCAA R:
ACCAGTTCCGAGATGTGGTC
qRT-PCR – – 54 104 –
FMO5 XM_001928594.1 F:GGCCTGAAGCCTAAACACAG
R:CCTGGAGCCATCCTCAAATA
qRT-PCR – – 55 147 –
HSD17B2 NM_001167649.1 F: TGCAGAACAGAGGACTGTGG R:
GCCATGCATCGTTTGTATTG
qRT-PCR – – 54 103 –
PPIA NM_214353 F: CACAAACGGTTCCCAGTTT R:
TGTCCACAGTCAGCAATGGT
qRT-PCR – – 58 171 –
GAPDH AF017079 F:ACCCAGAAGACTGTGGATGG
R:ACGCCTGCTTCACCACCTTC
qRT-PCR – – 60 247 –
IRG6 NM_213817 F: CTGGTACCTGTCACCTTTGC R:
GGGTGAAGTGGTAATTGACG
Genotyping Exon 3 HaeIII 60 232 GG: 154+78
AA: 232
DSP XM_003128168 F: AACCTGATTGATCGGGAAAC R:
GCTGACCTTCTTTTTGGTGA
Genotyping Exon 1 HpyCH4IV 55 207 CC: 109+98
TT: 207
MX1 NM_214061 F:CACTTCCAAATGGAGCAGAT
R:GACTCGCAGACTCACCTGAT
Genotyping Exon 2 AciI 55 204 CC: 125+79
TT: 204
IFIT2 XM_001928671 F:AAGAAGTTTTCCAGCCCCTA
R:TTATCCAGACGGTAGCTTGC
Genotyping Exon 3 DrdI 55 188 GG: 145+107
TT: 252
FMO5 XM_001928594 F:AAAGGTTCGACCATGAAATG R:
TATGGCAGCTGTCTCTGTGA
Genotyping Exon 3 HpyCH4III 55 223 GG: 134+89
AA: 223
CYP7A1 NM_001005352 F:TGTCCAGGAAATCAAGCAAT
R:CGTCATCAGCTGTCCTCTTT
Genotyping Exon 2 HpyCH4V 55 199 AA: 101+98
GG: 199
KRT18 NM_001159615 F: GGGTTGAGAAGGTTCTGGAT R:
CTCCTCGTGGTTCTTCTTCA
Genotyping Exon 2 HpyCH4V 55 215 GG: 149+66
AA: 215
*Position according to coding region in Sus scrofa. doi:10.1371/journal.pone.0063259.t010
RNA-Seq
Analysis
for
Boar
Androsteno
ne
Formatio
n
ONE
|
www.ploson
e.org
13
May
2013
|
Volume
8
|
Issue
5
|
Institute Inc., Cary, USA). Effects of slaughter age, husbandry system (pen) as well as genotype on boar taint compound androstenone were assessed with fixed effect model (ANOVA) using PROC GLM. For all models, fixed effects included genotype and pen (group, individual), and age of slaughter was fitted as a covariate for boar taint compound androstenone. Due to the skewed nature of the androstenone, data were transformed with natural logarithm before ANOVA to achieve normality. Least square mean values for the loci genotypes were compared by t-test and p-values were adjusted by the Tukey–Kramer correction [68;69;70].
Supporting Information
Figure S1 The smear plots for differential expression between high and low androstenone levels in testis and liver.
(TIF)
Table S1 GLM analysis results for testis and liver DEGs.
(DOC)
Table S2 Sample read counts for polymorphisms on testis and liver DEGs.
(DOC)
Table S3 Selected SNP detected by RNA-seq that were validated using RFLP.
(DOC)
Table S4 Genotype, allele frequencies and the chi-square test of selected SNPs validated using RFLP. (DOC)
Acknowledgments
Authors are indebted to Dr. Peter Gru¨n from Landesanstalt fu¨r Schweinezucht – LSZ Boxberg, Baden-Wu¨rttemberg for providing pigs for experiment. Authors are also thankful to Dr. Mark Bu¨cking from Fraunhofer Institute for Molecular Biology and Applied Ecology (IME) in Schmallenberg for the quantitative determination (measurement) of androstenone.
Author Contributions
Conceived and designed the experiments: KS MUC. Performed the experiments: A. Gunawan. Analyzed the data: SS. Contributed reagents/ materials/analysis tools: DT. Wrote the paper: A. Gunawan SS MJU. Revised manuscript: KS MJU. Supervised the overall work: MUC. Contributed to sampling: CN LF CL. Performed IPA analysis: A. Gad. Statistical analysis: ET CG-B.
References
1. Wackers F, Olson D, Rains G, Lundby F, Haugen JE (2011) Boar taint detection using parasitoid biosensors. J Food Sci 76: S41–47.
2. Grindflek E, Lien S, Hamland H, Hansen MH, Kent M, et al. (2011) Large scale genome-wide association and LDLA mapping study identifies QTLs for boar taint and related sex steroids. BMC Genomics 12: 362.
3. Haugen JE, Brunius C, Zamaratskaia G (2012) Review of analytical methods to measure boar taint compounds in porcine adipose tissue: the need for harmonised methods. Meat Sci 90: 9–19.
4. Pauly C, Spring P, O’Doherty JV, Kragten SA, Bee G (2008) Performances, meat quality and boar taint of castrates and entire male pigs fed a standard and a raw potato starch-enriched diet. Animal 2: 1707–1715.
5. Bonneau M (1998) Use of entire males for pig meat in the European Union. Meat Sci 49S1: S257–272.
6. Morlein D, Grave A, Sharifi AR, Bucking M, Wicke M (2012) Different scalding techniques do not affect boar taint. Meat Sci.
7. Aluwe M, Millet S, Bekaert KM, Tuyttens FA, Vanhaecke L, et al. (2011) Influence of breed and slaughter weight on boar taint prevalence in entire male pigs. Animal 5: 1283–1289.
8. Robic A, Larzul C, Bonneau M (2008) Genetic and metabolic aspects of androstenone and skatole deposition in pig adipose tissue: A review (Open Access publication). Genetics Selection Evolution 40: 129–143.
9. Frieden L, Looft C, Mo¨rlein D, Meier-Dinkel L, Thole E (2011) Breeding for reduced boar taint in Pietrain sired crossbred males in Germany; 2011 30 November - 1 December; Amsterdam.
10. Sellier P, Le Roy P, Fouilloux MN, Gruand J, Bonneau M (2000) Responses to restricted index selection and genetic parameters for fat androstenone level and sexual maturity status of young boars. Livestock Production Science 63: 265– 274.
11. Tajet H, Andresen O, Meuwissen THE (2006) Estimation of genetic parameters of boar taint; skatole and androstenone and their correlations with sexual maturation. Acta Veterinaria Scandinavica 48: S9.
12. Gower DB (1972) 16-Unsaturated C 19 steroids. A review of their chemistry, biochemistry and possible physiological role. J Steroid Biochem 3: 45–103. 13. Kwan TK, Orengo C, Gower DB (1985) Biosynthesis of androgens and
pheromonal steroids in neonatal porcine testicular preparations. FEBS Lett 183: 359–364.
14. Doran E, Whittington FM, Wood JD, McGivan JD (2004) Characterisation of androstenone metabolism in pig liver microsomes. Chem Biol Interact 147: 141– 149.
15. Sinclair PA, Squires EJ (2005) Testicular sulfoconjugation of the 16-androstene steroids by hydroxysteroid sulfotransferase: its effect on the concentrations of 5alpha-androstenone in plasma and fat of the mature domestic boar. J Anim Sci 83: 358–365.
16. Sinclair PA, Squires EJ, Raeside JI, Renaud R (2005) Synthesis of free and sulphoconjugated 16-androstene steroids by the Leydig cells of the mature domestic boar. J Steroid Biochem Mol Biol 96: 217–228.
17. Nelson DR (1999) Cytochrome P450 and the individuality of species. Arch Biochem Biophys 369: 1–10.
18. Davis SM, Squires EJ (1999) Association of cytochrome b5 with 16-androstene steroid synthesis in the testis and accumulation in the fat of male pigs. J Anim Sci 77: 1230–1235.
19. Katkov T, Gower DB (1970) The biosynthesis of androst-16-enes in boar testis tissue. Biochem J 117: 533–538.
20. Nicolau-Solano SI, McGivan JD, Whittington FM, Nieuwhof GJ, Wood JD, et al. (2006) Relationship between the expression of hepatic but not testicular 3beta-hydroxysteroid dehydrogenase with androstenone deposition in pig adipose tissue. J Anim Sci 84: 2809–2817.
21. Sinclair PA, Hancock S, Gilmore WJ, Squires EJ (2005) Metabolism of the 16-androstene steroids in primary cultured porcine hepatocytes. J Steroid Biochem Mol Biol 96: 79–87.
22. Duijvesteijn N, Knol EF, Merks JW, Crooijmans RP, Groenen MA, et al. (2010) A genome-wide association study on androstenone levels in pigs reveals a cluster of candidate genes on chromosome 6. BMC Genet 11: 42.
23. Gregersen V, Conley L, Sorensen K, Guldbrandtsen B, Velander I, et al. (2012) Genome-wide association scan and phased haplotype construction for quantitative trait loci affecting boar taint in three pig breeds. BMC Genomics 13: 22.
24. Lee GJ, Archibald AL, Law AS, Lloyd S, Wood J, et al. (2005) Detection of quantitative trait loci for androstenone, skatole and boar taint in a cross between Large White and Meishan pigs. Anim Genet 36: 14–22.
25. Quintanilla R, Demeure O, Bidanel JP, Milan D, Iannuccelli N, et al. (2003) Detection of quantitative trait loci for fat androstenone levels in pigs. Journal of Animal Science 81: 385–394.
26. Robic A, Feve K, Larzul C, Billon Y, van Son M, et al. (2011) Expression levels of 25 genes in liver and testis located in a QTL region for androstenone on SSC7q1.2. Anim Genet 42: 662–665.
27. Leung MC, Bowley KL, Squires EJ (2010) Examination of testicular gene expression patterns in Yorkshire pigs with high and low levels of boar taint. Anim Biotechnol 21: 77–87.
28. Moe M, Lien S, Bendixen C, Hedegaard J, Hornshoj H, et al. (2008) Gene expression profiles in liver of pigs with extreme high and low levels of androstenone. BMC Vet Res 4: 29.
29. Moe M, Meuwissen T, Lien S, Bendixen C, Wang X, et al. (2007) Gene expression profiles in testis of pigs with extreme high and low levels of androstenone. BMC Genomics 8: 405.
30. Ponsuksili S, Murani E, Brand B, Schwerin M, Wimmers K (2011) Integrating expression profiling and whole-genome association for dissection of fat traits in a porcine model. J Lipid Res 52: 668–678.
31. Wang Z, Gerstein M, Snyder M (2009) RNA-Seq: a revolutionary tool for transcriptomics. Nat Rev Genet 10: 57–63.
32. Marguerat S, Bahler J (2010) RNA-seq: from technology to biology. Cell Mol Life Sci 67: 569–579.
34. Wang L, Feng Z, Wang X, Zhang X (2009) DEGseq: an R package for identifying differentially expressed genes from RNA-seq data. Bioinformatics 26: 136–138.
35. Marioni JC, Mason CE, Mane SM, Stephens M, Gilad Y (2008) RNA-seq: an assessment of technical reproducibility and comparison with gene expression arrays. Genome Res 18: 1509–1517.
36. Bauer BK, Isom SC, Spate LD, Whitworth KM, Spollen WG, et al. (2010) Transcriptional profiling by deep sequencing identifies differences in mRNA transcript abundance in in vivo-derived versus in vitro-cultured porcine blastocyst stage embryos. Biol Reprod 83: 791–798.
37. Chen C, Ai H, Ren J, Li W, Li P, et al. (2011) A global view of porcine transcriptome in three tissues from a full-sib pair with extreme phenotypes in growth and fat deposition by paired-end RNA sequencing. BMC Genomics 12: 448.
38. Esteve-Codina A, Kofler R, Palmieri N, Bussotti G, Notredame C, et al. (2011) Exploring the gonad transcriptome of two extreme male pigs with RNA-seq. BMC Genomics 12: 552.
39. McIntyre LM, Lopiano KK, Morse AM, Amin V, Oberg AL, et al. (2011) RNA-seq: technical variability and sampling. BMC Genomics 12: 293.
40. Sendler E, Johnson GD, Krawetz SA (2011) Local and global factors affecting RNA sequencing analysis. Anal Biochem 419: 317–322.
41. Wu W, Glinka A, Delius H, Niehrs C (2000) Mutual antagonism between dickkopf1 and dickkopf2 regulates Wnt/beta-catenin signalling. Curr Biol 10: 1611–1614.
42. Golestaneh N, Beauchamp E, Fallen S, Kokkinaki M, Uren A, et al. (2009) Wnt signaling promotes proliferation and stemness regulation of spermatogonial stem/progenitor cells. Reproduction 138: 151–162.
43. Chang H, Guillou F, Taketo MM, Behringer RR (2009) Overactive beta-catenin signaling causes testicular sertoli cell tumor development in the mouse. Biol Reprod 81: 842–849.
44. Baes C, Luther H, Ampuero S, Spring P, Hofer A (2011) The effect of androstenone, skatole and indole on semen quality.
45. Schweizer J, Bowden PE, Coulombe PA, Langbein L, Lane EB, et al. (2006) New consensus nomenclature for mammalian keratins. J Cell Biol 174: 169–174. 46. Khandelwal P, Liu S, Sullivan DA (2012) Androgen regulation of gene expression in human meibomian gland and conjunctival epithelial cells. Mol Vis 18: 1055–1067.
47. Rizner TL, Lin HK, Peehl DM, Steckelbroeck S, Bauman DR, et al. (2003) Human type 3 3alpha-hydroxysteroid dehydrogenase (aldo-keto reductase 1C2) and androgen metabolism in prostate cells. Endocrinology 144: 2922–2932. 48. Grindflek E, Berget I, Moe M, Oeth P, Lien S (2010) Transcript profiling of
candidate genes in testis of pigs exhibiting large differences in androstenone levels. BMC Genet 11: 4.
49. Ren DR, Ren J, Xing YY, Guo YM, Wu YB, et al. (2009) A genome scan for quantitative trait loci affecting male reproductive traits in a White Duroc x Chinese Erhualian resource population. J Anim Sci 87: 17–23.
50. Saiardi A, Erdjument-Bromage H, Snowman AM, Tempst P, Snyder SH (1999) Synthesis of diphosphoinositol pentakisphosphate by a newly identified family of higher inositol polyphosphate kinases. Curr Biol 9: 1323–1326.
51. Chakraborty A, Koldobskiy MA, Bello NT, Maxwell M, Potter JJ, et al. Inositol pyrophosphates inhibit Akt signaling, thereby regulating insulin sensitivity and weight gain. Cell 143: 897–910.
52. Baker ME (2001) Evolution of 17beta-hydroxysteroid dehydrogenases and their role in androgen, estrogen and retinoid action. Mol Cell Endocrinol 171: 211– 215.
53. Andresen O (1974) Development of a radioimunoassay for 5alpha-adrost-16-en-3-one in pig peripheral plasma. Acta Endocrinologica 76: 377–387. 54. Cashman JR (2005) Some distinctions between flavin-containing and
cyto-chrome P450 monooxygenases. Biochem Biophys Res Commun 338: 599–604. 55. Glenn KL, Ramos AM, Rothschild MF (2007) Analysis of FMO genes and off
flavour in pork. J Anim Breed Genet 124: 35–38.
56. Gregersen VR, Conley LN, Sorensen KK, Guldbrandtsen B, Velander IH, et al. (2012) Genome-wide association scan and phased haplotype construction for quantitative trait loci affecting boar taint in three pig breeds. BMC Genomics 13: 22.
57. Morozumi T, Sumantri C, Nakajima E, Kobayashi E, Asano A, et al. (2001) Three types of polymorphisms in exon 14 in porcine Mx1 gene. Biochem Genet 39: 251–260.
58. Davis AM, Pond WG, Wheeler M, Ishimura-Oka K, Su DR, et al. (1998) Alleles of the cholesterol 7 alpha-hydroxylase (CYP7) gene in pigs selected for high or low plasma total cholesterol. Proc Soc Exp Biol Med 217: 466–470. 59. Wesoly R, Weiler U (2012) Nutritional Influences on skatole formation and
skatole metabolism in the pig. Animals 2: 221–242.
60. ZDS (2003) Richtlinie Fuer die Stationspruefung auf Mastleistung, Schlacht-koerperwert und Fleischbeschaffenheit Beim Schwein. Zentralverband der Deutschen Schweineproduktion eV, Ausschussfuer Leistungspruefung und Zuchtwertschaetzung, Bonn.
61. Fischer J, Elsinghorst PW, Bucking M, Tholen E, Petersen B, et al. (2011) Development of a candidate reference method for the simultaneous quantitation of the boar taint compounds androstenone, 3alpha-androstenol, 3beta-androstenol, skatole, and indole in pig fat by means of stable isotope dilution analysis-headspace solid-phase microextraction-gas chromatography/mass spec-trometry. Anal Chem 83: 6785–6791.
62. Li H, Durbin R (2009) Fast and accurate short read alignment with Burrows-Wheeler transform. Bioinformatics 25: 1754–1760.
63. Benjamini Y, Hochberg Y (1995) Controlling the false discovery rate: a practical and powerful approach to multiple testing. J R Stat Soc Series B 57: 289–300. 64. McKenna A, Hanna M, Banks E, Sivachenko A, Cibulskis K, et al. (2010) The Genome Analysis Toolkit: a MapReduce framework for analyzing next-generation DNA sequencing data. Genome Res 20: 1297–1303.
65. Birney E, Clamp M, Durbin R (2004) GeneWise and Genomewise. Genome Res 14: 988–995.
66. Rozen S, Skaletsky H (2000) Primer3 on the WWW for general users and for biologist programmers. Methods Mol Biol 132: 365–386.
67. Silver N, Best S, Jiang J, Thein SL (2006) Selection of housekeeping genes for gene expression studies in human reticulocytes using real-time PCR. BMC Mol Biol 7: 33.
68. Cinar MU, Kayan A, Uddin MJ, Jonas E, Tesfaye D, et al. (2012) Association and expression quantitative trait loci (eQTL) analysis of porcine AMBP, GC and PPP1R3B genes with meat quality traits. Mol Biol Rep 39: 4809–4821. 69. Kayan A, Cinar MU, Uddin MJ, Phatsara C, Wimmers K, et al. (2011)
Polymorphism and expression of the porcine Tenascin C gene associated with meat and carcass quality. Meat Sci 89: 76–83.