Trop. For. Manage. J. VI (1) : 7-23 (2000)
DETECTING BURNT FOREST DAMAGE USING DIGITAL
SPOT IMAGERY
1)Deteksi Kerusakan Hutan Terbakar Menggunakan Citra SPOT Dijital
I NENGAH SURATI JAYA2)
ABSTRAK
Mendeteksi kerusakan hutan melalui metode inventarisasi terestris dan/atau potret udara membutuhkan biaya yang mahal dan memakan waktu, khususnya untuk luasan yang besar. Dalam paper ini, penulis menguraikan kegunaan dari citra SPOT dijital untuk mendeteksi kondisi hutan paska kebakaran. Evaluasi dilakukan terhadap empat kelas kerusakan hutan yang terbakar.
Studi ini memperlihatkan bahwa citra SPOT multispektral dapat digunakan untuk mengklasifikasi hutan terbakar menjadi kelas dengan tingkat kerusakan ringan, sedang, berat dan sangat berat. Analisis spasial yang juga dilakukan dalam studi ini memperlihatkan bahwa sebagian besar areal studi termasuk kategori kebakaran berat dan sangat berat. Meskipun hutan-hutan bekas tebangan baru cenderung mengalami intensitas kerusakan yang tinggi, kebakaran yang terjadi tahun 1998 tidak hanya membakar hutan bekas tebangan baru tetapi juga hutan bekas tebangan tua dan hutan primer.
INTRODUCTION
At present, most of forest management practices need timely and good quality of data/information for forestry applications. For forest fire management, it has been proven that satellite remote sensing offers very valuable information at various aspects of fire management problems, either at pre-fire planning, during fires or at the post fire, such as detection, suppression and mapping of burnt area. After fires, remote sensing system may provide information on forest damage quickly with high accuracy. After 1998 fires in East Kalimantan, only few organizations/companies that used digital satellite imagery to evaluate post-fire condition. Many of them used conventional ground survey to estimate the extent and stand condition which are usually time consuming and costly.
Availability of data in digital format coupled with better quality of computer technology, facilitate to map forest or land cover with per-pixel classification techniques
1)
A part of this paper has been presented jointly by Dr. I Nengah Surati Jaya & Mr. Endang A. Husaeni at the 3rd International Symposium on Asian Tropical Forest Management held on September 20-23, 1999 in Samarinda, Indonesia
2)
because land/forest cover is directly related to pixel values on image. From previous experiences, it has also been proven that fine resolution of satellite data such as TM, SPOT and MESSR are useful for forest management. In this study, the author emphasized on the use of digital SPOT imagery for assessing post-fire vegetation condition.
At the present time, of several available satellite imageries, SPOT imagery offer several advantages over traditional photogrammetric. One SPOT scene covers approximately 360.000 ha, equivalent to almost hundreds of medium-scale aerial photos. The SPOT data are now available world wide on a constant cycle basis that may useful for forest monitoring. The availability of the data in digital formal also enable us to perform automated operations such as geometric correction, radiometric correction, edge/line detection, classification etc.
From February to April 1998, an extensive forest fires raged out of control through various parts of Southeast Asia including major part of East Kalimantan, Indonesia. During this period, the occurrence of fires was monitored using daily-acquired NOAA AVHRR and GMS imageries. Unfortunately, coarse spatial resolution of these two images makes them impossible to be used to detect the area of burnt forest. Finer spatial resolution of SPOT HRV data of only 20 m x 20 m, enable us to estimate post fire condition of burnt forest. In this study, SPOT data were used to zoom in the burnt area to accurately determine the nature of fires where possible.
The 1998 fires in East Kalimantan had caused serious impacts on forest and other vegetations as well as on socio-economic aspect of the community living surrounding the forest. The official estimate for the burned area in 1998 is about 507,239.5 ha causing financial losses amounting to Rp. 10.06 trillion. It was also reported that although in 1997 East Kalimantan Province was recognized as the most prepared in term of fire control, in early 1998, the fires had raged and intensified in March and April following a pattern similar to the 1982-1983 episode. It was reported that the 1998 fires were caused by large-scale land clearing. From 507,239.5 ha burnt, some of 315,132 ha (62.2%) were logging concessions. Only 1,857 ha of community agricultural lands and 10,758 ha of community plantation (estate crops) were burnt, while the rest were forested area.
In East Kalimantan, ITCI Ltd. concession area located in Southern part of East Kalimantan Province also suffered from fires. Within ITCI Ltd. concession area, the fire occurred from February to April destroying major part of the area. As we all may aware that fires remove vegetation cover, reduce ecosystem quality and species diversity as well as cause serious economic losses. Now, several logging companies face post-fire problems including implementation of rehabilitation techniques on burnt area, as well as techniques for salvage logging. Prior to develop rehabilitation and salvage logging plans, the evaluation of post-fire vegetation should be made. In order to provide timely and accurate information, the post-fire condition was evaluated using digital SPOT imagery.
The study was performed:
to detect burnt forest damage quantitatively from digital SPOT HRV imagery; to evaluate whether the SPOT HRV could discriminate all damage classes;
MATERIAL AND METHODS
Test Site and Supporting Data
The test site was ITCI Ltd. concession area, East Kalimantan, which is located between South-latitude 0°15’00” and 1°00’00”; and East-longitude 116°15’00” and 117°00’00”. Inside the test site, ground survey for data and information collection related to forest damage was conducted. All data and information obtained were then analyzed to support image processing, at the Laboratory of Forest Inventory, Faculty of Forestry, Bogor Agricultural University.
Two scenes of SPOT HRV (multispectral) imagery covering the major part of the study site were used. The scene centers are S000°30’12” and E116°42’25” (K302/J351); and S001°00’14” and 116°35’43” (K302/J502), acquired on June 5th
1998, approximately two months after fire.
Ground survey was performed two months after fire in order to achieve the study objective. To perform geometric correction and spatial analysis, the following maps were used as reference:
topographic maps with scale of 1:50,000 and 1:100,000; and cutting year and forest potential maps of 1:100,000 scale
Software and Hardware
ER Mapper 5.5 image processing software was used to perform an image analysis of the SPOT data. The classified image was then overlaid with annual-cutting block map and spatially analyzed using GIS software ArcView Ver. 3.1 and ArcInfo, installed on PC IBM Compatible, and its essential accessories.
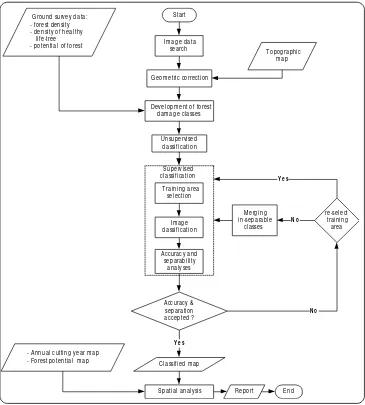
Methods
The procedure included the following steps:
Geometric correction (Image-to-map rectification);
Digitizing the annual cutting block boundary from the existing map and road from monitor screen;
Establishment of forest damage categories; Assessment of accuracy;
Image classification; and Spatial analysis.
Geometric Correction
less than 0.5. The first images (K302/J351) were rectified using 10 GCPs, which provided RMSE of 0.1 pixels, while the second images were geo-corrected using 13 GCPs with RMSE of 0.16 pixels. In order to perform image classification the two images were then mosaicked.
Establishment of Forest Damage Category and Land Cover Classes
The results of the study are expected to be used as reference in the implementation of rehabilitation techniques. The following four classes of forest damage classes performed by ITCI-Faculty of Forestry IPB (1998) were used:
Unburnt tropical forest
This class consisted of unburnt natural and logged-over tropical forests mostly located in the southern part of the study area. Mangrove forest, which dispersed in Balikpapan Bay are also included in this class. The predominant tree species are Shorea spp (meranti),
Dipterocarpus spp (keruing) and Dryobalanops spp (kapur). On specific and limited site, Agathis borneensis was also occured.
Unburnt plantation forest
This class consisted of unburnt plantation forest (timber estate) within the ITCI Hutani Manunggal Ltd. (IHM) territory and rubber plantation of other estate crop companies including community agricultural lands, homogenously distributed in the area.
Bare land
This class is a land without vegetation or very sparse vegetation cover, includes roads; base camps, log yards, gravelpit, paved surface in Eastern part of ITCI Ltd. and other forms of bare lands.
Slightly burnt forest
This class is a forest area that has predominant healthy life-trees of more than 75%
Moderately burnt forest
This is a forest area, which has healthy life-trees ranging from 50% to 75%
Severely burnt forest
This is a forest area, which has healthy life-trees ranging from 25% to 50%
Extremely burnt forest
This is a forest area, which consisted of healthy life trees less than 25%.
The conditions of forest cover classes are shown in Figure 1.
Figure 1. Ground condition of several forest damage classes (The photos were taken on April 30, 1999 by author) (a) Unburnt tropical forest, (b) Slightly burnt tropical forest, (c) Moderately burnt tropical forest (upper-left part of the image), severely burnt tropical forest (upper-right part of the image). Unburnt tropical forest (lower part of the image), (d) Extremely burnt tropical forest
(a) (b)
Figure 1. Continued (e) Burnt Land Clearing; (f) Burnt plantation forest (Acacia mangium) and (g) Unburnt plantation forest (middle part of the image)
(e) (f)
Figure 2. Photos of tree condition (a) Healthy life tree; (b) Partially burnt life-tree; (c) Marketable dead-tree and (d) Totally burnt tree
(a) (b)
To reduce misclassification during computer-assisted processing, the coverage of cloud and cloud shadow were separated as individual cover classes.
Digitizing the Annual Cutting Block
The polygon of logged over forest were digitized from the map of annual cutting block. To get more realistic information from the map, personal interview to the staff of Planning Division of ITCI Co. Ltd. pertaining the realization of logging activity was done. While roads were digitized on monitor screen, by tracing a mouse cursor along the center of each road. The digitized pixels were then saved as a vector format (Arc/info format)
Image Analysis
In this study, a hybrid of supervised and unsupervised classification was applied. The unsupervised classification using isoclass algorithm was performed by generating a number of unlabelled classes. This is particularly useful to facilitate training area selection.
Based upon data and information available from maps coupled with ground truth data, a set of training areas representing each class performed above was then generated. The training areas were selected interactively by comparing ground truth data and their appearance on screen. To reduce error during placement of the training site, the ITCI Ltd. concession area boundaries map as well as road and river maps were overlaid. In general, the training area was plotted at the middle part of homogenous area.
DISCUSSIONS
Feature Selection
To perform quantitative analysis, standard false color composite image of band XS3 as red, XS2 as green and XS1 as blue was created. This provides an immediate feature of post-fire condition. Through visual interpretation either on hardpaper or on computer screen, burnt and unburnt areas could be obviously discriminated. Light red colors correspond to unburnt vegetation either natural or plantation forests, while black with slightly red color shows burnt areas, mainly severely and extremely burnt forest. Since the emphasize was to discriminate the degree of forest damage digitally based on percentage of healthy life-tree, visual interpretation was performed to assist quantitative analysis especially during the selection of training area. In this study, since SPOT multispectral data have only three bands, feature evaluation was done using single band, two-band and three-band combinations. Of all possible combination evaluated, the study found that the best accuracy and inter-class separability were provided but using three-band combinations, i.e., band “XS1” (0.5 to 0.59 m green), band “XS2” (0.61 to 0.68 m, red) and band “XS3” (0.7 to 0.89, near infra red). As proved by Jaya and Kobayashi (1995), band combination using visible and infrared bands was recognized to be useful for detecting biomes or vegetation changes. Green band was expected to provide valuable information on green reflectance of healthy vegetation. Red band that corresponds to chlorophyll absorption of healthy green vegetation biomass present in a scene. This is particularly useful for land and water discrimination (Jensen, 1986).
Statistical analysis performed to evaluate classification accuracy and inter-class separability provides a promising result. The Kappa accuracy using all shows that, the damage degrees of burnt class were classified well, providing accuracy of 95%. The inter-class separability of damage inter-classes using full set band also showed an excellent separation, better than using two or single band combination. The study found that good classification of burnt forest could be obtained using full set band of SPOT HRV.
Forest Damage Classification
occurred between slightly, moderately, severely and extremely burnt forests classes,. Considerable confusion was only found between the severely burnt class and thr no-data class. In fact, pixel value of no-data class is null which is similar to very dark area or very deep-water body. Ground truth data collected in June 1998 (two months after fire) showed that there are many totally burnt trees within this moderately burnt area. The totally burnt tree seem to have a very low reflectance which similar to no-data and deep water. As reported by Guyot (1990), optical properties of forest canopies depend mainly on the optical properties of leaves and underlying soil. In some cases, however, they are also affected by optical properties of other parts of plants, such as bark on the branches, flowers, fruits, etc. In this study site, particularly within the severely and extremely burnt forests, of which the tree crown density is relatively low, the effect of burnt forest floor and burnt trees were dominant and mask out the effect of green biomass (chlorophyll) of healthy life trees. In the standard false color composite, these classes show black and very dark black (pixel value near to zero). Although confusion was found between extremely burnt area and water body (especially deep water), this confusion could be avoided for the pixels present within the study area. By using spatial context during visual interpretation, the deep-water body class shown as dark blue was then reidentified as totally burnt forest. In general, the results have shown that classification of the degrees of forest damage using SPOT data were accurate, with kappa accuracy value more than 90%. Inter-class separability analysis also provides a promising result, where damage classes could be separated successfully.
Using computer-assisted classification, the presence of clouds and their shadow had caused considerable confusion. Much confusion occurred between cloud and barren land. Some pixels of cloud were classified into barren land, and inversely, some barren land pixels were labeled as cloud. This confusion is likely to occur because biomass burning provided organic hygroscopic particles, which increase the available cloud condensation nuclei, then generated brighter clouds. The brighter clouds could reflect much more solar radiation in to the space that similar to the characteristic of barren land (Robock, 1988 in Chuvieco & Martin, 1994).
Relationship between the age of logged over area on forest damage
the fact that the amount of fuel burnt per hectare will affect the intensity with which an area will burn. The greater the fuel quantity per hectare the higher fire intensity will be produced, therefore the greater will be the total heat produced by the fires. Therefore, there is a large amount of heat transferred through radiation and convection to surrounding area. This radiation causes the pre-heating of the surrounding fuels and enables a surface fire to spread and may contribute to a fire jumping a fuel break. In some areas, sufficient amount of dead stems and branches may be present to allow for a fast spreading crown fire. During ground verification, the author found much more dead fuels within logged over forest than in virgin forest. The older the logged forest, the lesser amount of dead fuels (logging waste) available. During course of time, some of them may have decomposed and mineralized. Although logs, stumps, and large branches are categorized as heavy fuels, when they dry, they will develop very hot fire, and then may create spot fires, when the fuels moisture is low.
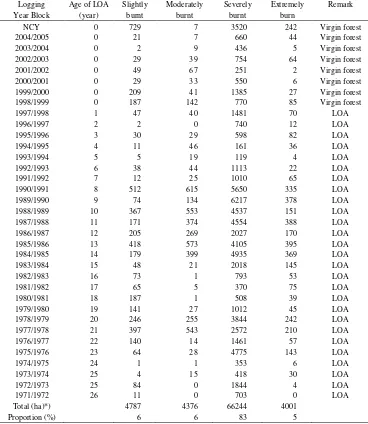
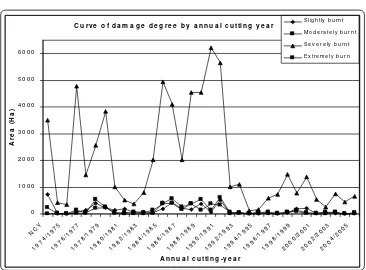
Considering the spatial relationship between the age of logged over forest and the digitally classified map obtained using full set SPOT HRV bands, the study found that severely damaged forest occurred within the areas of recently logged (84/85 ~ 90/91). As summarized in Table 1 and shown graphically in Figure 4, of four burnt forest classes evaluated, major proportion of the areas were recognized as severely burnt (83%). The highest proportion of severely burnt forest was found within 1989/1990 block area (6,217 ha). In general, large proportions of severely burnt forests were occurred between logged over forest of 1984/1985 (14 years after logged) and 1990/1991 cutting years (8 years after logged), ranging from 2,027 ha to 6,217 ha. Major part of annual cutting years of 1977/1978, 1978/1979 and 1975/1976 which logged 20, 21, and 23 years ago respectively also suffered from severe fire. From the results of spatial analysis performed by overlaying forest damage classes and wood potential distribution map, it was known that 51% of burnt forest area have burnt trees volume of approximately 35 m3 per ha. Estimated total volume of burnt trees was about 2.47 million cubic meter.
A little anomaly was found within cutting year blocks of 1978/79, 1977/78 (21 years) and 1975/76 (23 years). Within these cutting blocks, the burnt forests were as severely obtained during field visit done in April 1989, there is no logging activity conducted since the 1997/1998 cutting year. Thus, it is defined that the annual cutting years of 1997/1998 to 2004/2005 is considered as virgin forests.
experiences gained from this study are also quite promising for post fire rehabilitation and salvage logging.
CONCLUSIONS
The useful findings from this study include, the following conclusions:
1. SPOT HRV imagery could be used to detect burnt forest damage intensity successfully. Four damage classes, i.e., slightly, moderately, severely and extremely burnt forest could be recognized accurately with accuracy of more than 90%. The inter-class separability of these classes are excellent.
2. The presence of cloud shadows had caused considerable confusion in digital classification especially on extremely burnt forest class. Since automated correction of this misclassification could not be performed, visual interpretation by applying spatial context is required.
3. The study shows that most of the burnt area was severely damaged (83%). During the 98 fires, fire not only burnt out newly logged forest area, but also old logged area as well as virgin forest.
4. Analysis of spatial distribution of burnt forest, showed that geographical origin of the fires might be come from northern and eastern part of the area. Extremely and severely burnt forests were found predominantly in the northern and eastern part of the area. While unburnt forests are found in the southern and southwestern part of the study area. 5. Although no quantitative measurement conducted during the study, in general, recently logged forests have large amount of easily combustible fuel, and logging waste. Therefore, it can be concluded that the severely burnt forest tend to occur within the recently logged forest.
ACKNOWLEDGEMENTS
Grateful thank is addressed to Mr. Agus Salim and Mr. Dudy Susanto for their technical assistances during the study implementation. The author would also like to express sincere appreciation to the President Director of ITCI Ltd. and his staff for allowing the author to use their SPOT digital data.
Table 1. Areas of burnt forest classes for each cutting year
Logging Age of LOA Slightly Moderately Severely Extremely Remark
C u r v e o f d a m a g e d e g r e e b y a n n u a l c u tti n g y e a r
Figure 4. Pie chart of each forest damage degree by potential classes
LITERATURES CITED
Chuvieco, E and M.P. Martin, 1994. Global fire mapping and fire danger estimation using AVHRR images. Photogrammetric Engineering & Remote Sensing, Vol. 60 (5): 563-570
Guyot, 1990. Optical properties of vegetation canopies, Application of Remote Sensing in Agriculture (Steven, M.D. and Clark, J.A., eds.). Butterworths. London, p.19-43. Heikkilla, T.V., R. Gronqvist and M. Jurvelius, 1993. Handbook on Forest Fire Control:
Forestry Training Programme: Publication 21 National Board of Education of the Government of Finland. Helsinki.
International Timber Corporation Indonesia (ITCI) dan Fakultas Kehutanan IPB, 1998. Rencana Rehabilitasi Hutan Bekas Kebakaran di Areal HPH PT. ITCI Kalimantan Timur
Jensen, J.R., 1986. Introductory Digital Image Processing: A Remote Sensing Persepective. Prentice-Hall.
Trop. For. Manage. J. VI (1) : 7-23 (2000)
DETECTING BURNT FOREST DAMAGE USING DIGITAL
SPOT IMAGERY
1)Deteksi Kerusakan Hutan Terbakar Menggunakan Citra SPOT Dijital
I NENGAH SURATI JAYA2)
ABSTRAK
Mendeteksi kerusakan hutan melalui metode inventarisasi terestris dan/atau potret udara membutuhkan biaya yang mahal dan memakan waktu, khususnya untuk luasan yang besar. Dalam paper ini, penulis menguraikan kegunaan dari citra SPOT dijital untuk mendeteksi kondisi hutan paska kebakaran. Evaluasi dilakukan terhadap empat kelas kerusakan hutan yang terbakar.
Studi ini memperlihatkan bahwa citra SPOT multispektral dapat digunakan untuk mengklasifikasi hutan terbakar menjadi kelas dengan tingkat kerusakan ringan, sedang, berat dan sangat berat. Analisis spasial yang juga dilakukan dalam studi ini memperlihatkan bahwa sebagian besar areal studi termasuk kategori kebakaran berat dan sangat berat. Meskipun hutan-hutan bekas tebangan baru cenderung mengalami intensitas kerusakan yang tinggi, kebakaran yang terjadi tahun 1998 tidak hanya membakar hutan bekas tebangan baru tetapi juga hutan bekas tebangan tua dan hutan primer.
INTRODUCTION
At present, most of forest management practices need timely and good quality of data/information for forestry applications. For forest fire management, it has been proven that satellite remote sensing offers very valuable information at various aspects of fire management problems, either at pre-fire planning, during fires or at the post fire, such as detection, suppression and mapping of burnt area. After fires, remote sensing system may provide information on forest damage quickly with high accuracy. After 1998 fires in East Kalimantan, only few organizations/companies that used digital satellite imagery to evaluate post-fire condition. Many of them used conventional ground survey to estimate the extent and stand condition which are usually time consuming and costly.
Availability of data in digital format coupled with better quality of computer technology, facilitate to map forest or land cover with per-pixel classification techniques
1)
A part of this paper has been presented jointly by Dr. I Nengah Surati Jaya & Mr. Endang A. Husaeni at the 3rd International Symposium on Asian Tropical Forest Management held on September 20-23, 1999 in Samarinda, Indonesia
2)
because land/forest cover is directly related to pixel values on image. From previous experiences, it has also been proven that fine resolution of satellite data such as TM, SPOT and MESSR are useful for forest management. In this study, the author emphasized on the use of digital SPOT imagery for assessing post-fire vegetation condition.
At the present time, of several available satellite imageries, SPOT imagery offer several advantages over traditional photogrammetric. One SPOT scene covers approximately 360.000 ha, equivalent to almost hundreds of medium-scale aerial photos. The SPOT data are now available world wide on a constant cycle basis that may useful for forest monitoring. The availability of the data in digital formal also enable us to perform automated operations such as geometric correction, radiometric correction, edge/line detection, classification etc.
From February to April 1998, an extensive forest fires raged out of control through various parts of Southeast Asia including major part of East Kalimantan, Indonesia. During this period, the occurrence of fires was monitored using daily-acquired NOAA AVHRR and GMS imageries. Unfortunately, coarse spatial resolution of these two images makes them impossible to be used to detect the area of burnt forest. Finer spatial resolution of SPOT HRV data of only 20 m x 20 m, enable us to estimate post fire condition of burnt forest. In this study, SPOT data were used to zoom in the burnt area to accurately determine the nature of fires where possible.
The 1998 fires in East Kalimantan had caused serious impacts on forest and other vegetations as well as on socio-economic aspect of the community living surrounding the forest. The official estimate for the burned area in 1998 is about 507,239.5 ha causing financial losses amounting to Rp. 10.06 trillion. It was also reported that although in 1997 East Kalimantan Province was recognized as the most prepared in term of fire control, in early 1998, the fires had raged and intensified in March and April following a pattern similar to the 1982-1983 episode. It was reported that the 1998 fires were caused by large-scale land clearing. From 507,239.5 ha burnt, some of 315,132 ha (62.2%) were logging concessions. Only 1,857 ha of community agricultural lands and 10,758 ha of community plantation (estate crops) were burnt, while the rest were forested area.
In East Kalimantan, ITCI Ltd. concession area located in Southern part of East Kalimantan Province also suffered from fires. Within ITCI Ltd. concession area, the fire occurred from February to April destroying major part of the area. As we all may aware that fires remove vegetation cover, reduce ecosystem quality and species diversity as well as cause serious economic losses. Now, several logging companies face post-fire problems including implementation of rehabilitation techniques on burnt area, as well as techniques for salvage logging. Prior to develop rehabilitation and salvage logging plans, the evaluation of post-fire vegetation should be made. In order to provide timely and accurate information, the post-fire condition was evaluated using digital SPOT imagery.
The study was performed:
to detect burnt forest damage quantitatively from digital SPOT HRV imagery; to evaluate whether the SPOT HRV could discriminate all damage classes;
MATERIAL AND METHODS
Test Site and Supporting Data
The test site was ITCI Ltd. concession area, East Kalimantan, which is located between South-latitude 0°15’00” and 1°00’00”; and East-longitude 116°15’00” and 117°00’00”. Inside the test site, ground survey for data and information collection related to forest damage was conducted. All data and information obtained were then analyzed to support image processing, at the Laboratory of Forest Inventory, Faculty of Forestry, Bogor Agricultural University.
Two scenes of SPOT HRV (multispectral) imagery covering the major part of the study site were used. The scene centers are S000°30’12” and E116°42’25” (K302/J351); and S001°00’14” and 116°35’43” (K302/J502), acquired on June 5th
1998, approximately two months after fire.
Ground survey was performed two months after fire in order to achieve the study objective. To perform geometric correction and spatial analysis, the following maps were used as reference:
topographic maps with scale of 1:50,000 and 1:100,000; and cutting year and forest potential maps of 1:100,000 scale
Software and Hardware
ER Mapper 5.5 image processing software was used to perform an image analysis of the SPOT data. The classified image was then overlaid with annual-cutting block map and spatially analyzed using GIS software ArcView Ver. 3.1 and ArcInfo, installed on PC IBM Compatible, and its essential accessories.
Methods
The procedure included the following steps:
Geometric correction (Image-to-map rectification);
Digitizing the annual cutting block boundary from the existing map and road from monitor screen;
Establishment of forest damage categories; Assessment of accuracy;
Image classification; and Spatial analysis.
Geometric Correction
less than 0.5. The first images (K302/J351) were rectified using 10 GCPs, which provided RMSE of 0.1 pixels, while the second images were geo-corrected using 13 GCPs with RMSE of 0.16 pixels. In order to perform image classification the two images were then mosaicked.
Establishment of Forest Damage Category and Land Cover Classes
The results of the study are expected to be used as reference in the implementation of rehabilitation techniques. The following four classes of forest damage classes performed by ITCI-Faculty of Forestry IPB (1998) were used:
Unburnt tropical forest
This class consisted of unburnt natural and logged-over tropical forests mostly located in the southern part of the study area. Mangrove forest, which dispersed in Balikpapan Bay are also included in this class. The predominant tree species are Shorea spp (meranti),
Dipterocarpus spp (keruing) and Dryobalanops spp (kapur). On specific and limited site, Agathis borneensis was also occured.
Unburnt plantation forest
This class consisted of unburnt plantation forest (timber estate) within the ITCI Hutani Manunggal Ltd. (IHM) territory and rubber plantation of other estate crop companies including community agricultural lands, homogenously distributed in the area.
Bare land
This class is a land without vegetation or very sparse vegetation cover, includes roads; base camps, log yards, gravelpit, paved surface in Eastern part of ITCI Ltd. and other forms of bare lands.
Slightly burnt forest
This class is a forest area that has predominant healthy life-trees of more than 75%
Moderately burnt forest
This is a forest area, which has healthy life-trees ranging from 50% to 75%
Severely burnt forest
This is a forest area, which has healthy life-trees ranging from 25% to 50%
Extremely burnt forest
This is a forest area, which consisted of healthy life trees less than 25%.
The conditions of forest cover classes are shown in Figure 1.
Figure 1. Ground condition of several forest damage classes (The photos were taken on April 30, 1999 by author) (a) Unburnt tropical forest, (b) Slightly burnt tropical forest, (c) Moderately burnt tropical forest (upper-left part of the image), severely burnt tropical forest (upper-right part of the image). Unburnt tropical forest (lower part of the image), (d) Extremely burnt tropical forest
(a) (b)
Figure 1. Continued (e) Burnt Land Clearing; (f) Burnt plantation forest (Acacia mangium) and (g) Unburnt plantation forest (middle part of the image)
(e) (f)
Figure 2. Photos of tree condition (a) Healthy life tree; (b) Partially burnt life-tree; (c) Marketable dead-tree and (d) Totally burnt tree
(a) (b)
To reduce misclassification during computer-assisted processing, the coverage of cloud and cloud shadow were separated as individual cover classes.
Digitizing the Annual Cutting Block
The polygon of logged over forest were digitized from the map of annual cutting block. To get more realistic information from the map, personal interview to the staff of Planning Division of ITCI Co. Ltd. pertaining the realization of logging activity was done. While roads were digitized on monitor screen, by tracing a mouse cursor along the center of each road. The digitized pixels were then saved as a vector format (Arc/info format)
Image Analysis
In this study, a hybrid of supervised and unsupervised classification was applied. The unsupervised classification using isoclass algorithm was performed by generating a number of unlabelled classes. This is particularly useful to facilitate training area selection.
Based upon data and information available from maps coupled with ground truth data, a set of training areas representing each class performed above was then generated. The training areas were selected interactively by comparing ground truth data and their appearance on screen. To reduce error during placement of the training site, the ITCI Ltd. concession area boundaries map as well as road and river maps were overlaid. In general, the training area was plotted at the middle part of homogenous area.
DISCUSSIONS
Feature Selection
To perform quantitative analysis, standard false color composite image of band XS3 as red, XS2 as green and XS1 as blue was created. This provides an immediate feature of post-fire condition. Through visual interpretation either on hardpaper or on computer screen, burnt and unburnt areas could be obviously discriminated. Light red colors correspond to unburnt vegetation either natural or plantation forests, while black with slightly red color shows burnt areas, mainly severely and extremely burnt forest. Since the emphasize was to discriminate the degree of forest damage digitally based on percentage of healthy life-tree, visual interpretation was performed to assist quantitative analysis especially during the selection of training area. In this study, since SPOT multispectral data have only three bands, feature evaluation was done using single band, two-band and three-band combinations. Of all possible combination evaluated, the study found that the best accuracy and inter-class separability were provided but using three-band combinations, i.e., band “XS1” (0.5 to 0.59 m green), band “XS2” (0.61 to 0.68 m, red) and band “XS3” (0.7 to 0.89, near infra red). As proved by Jaya and Kobayashi (1995), band combination using visible and infrared bands was recognized to be useful for detecting biomes or vegetation changes. Green band was expected to provide valuable information on green reflectance of healthy vegetation. Red band that corresponds to chlorophyll absorption of healthy green vegetation biomass present in a scene. This is particularly useful for land and water discrimination (Jensen, 1986).
Statistical analysis performed to evaluate classification accuracy and inter-class separability provides a promising result. The Kappa accuracy using all shows that, the damage degrees of burnt class were classified well, providing accuracy of 95%. The inter-class separability of damage inter-classes using full set band also showed an excellent separation, better than using two or single band combination. The study found that good classification of burnt forest could be obtained using full set band of SPOT HRV.
Forest Damage Classification