Comparison of the anthropometric measurements and health risks in people
with normal weight according to the body mass index-for-age charts
Ignatio Rika Haryono, Nawanto A Prastowo
Department of Physiology, School of Medicine, Atmajaya Catholic University, Jakarta, Indonesia
Abstrak
Tujuan Meskipun indeks massa tubuh (IMT) pada persentil 5-84 dianggap sebagai berat badan normal untuk anak dan remaja menurut kurva IMT dari Centers for Disease Control & Prevention (CDC), tetapi penelitian oleh Guo et al menunjukkan bahwa IMT pada persentil 75 telah memiliki risiko menjadi obesitas dewasa. Penelitian ini bertujuan untuk membandingkan parameter antropometri, pemeriksaan laboratorium, dan risiko kesehatan pada subyek dengan IMT normal untuk mengetahui kelompok IMT ideal menurut kurva IMT dari CDC.
Metode Sebagai kelompok rujukan adalah IMT normal (IMT 18,5-24,9) menurut klasiikasi dewasa dari World Health Organization (WHO). Kelompok IMT normal menurut kurva IMT dari CDC dibagi dalam 4 subkelompok yaitu kelompok persentil 5-24, 24-49, 50-74, dan 75-84.
Hasil & Simpulan Dari hasil perbandingan tersebut, kelompok IMT persentil 50-74 pada laki-laki dan persentil 75-84 pada perempuan memiliki ukuran antropometrik dan hasil pemeriksaan laboratorium lebih tinggi dari kelompok rujukan. Meskipun demikian risiko kesehatan kelompok tersebut tidak berbeda bermakna dibandingkan dengan kelompok rujukan. (Med J Indones 2009; 18: 41-7)
Abstract
Aim Body mass index (BMI) at 5th-84th percentiles according to the BMI-for-age charts from Center for Diseases Control and Prevention (CDC) is considered as normal BMI for children and adolescents. However, Guo et al found that BMI at 75th-84th percentiles already had a possibility to be adult overweight and obese. This study aimed to
determine anthropometric measurements, laboratory indings, and health risk differences to ind an ideal BMI group
according to the BMI charts.
Methods Normal BMI according to adult classiication from the World Health Organization (BMI at 18.5-24.9) is
used as a reference group.
Results & Conclusion Our study showed BMI value at 50th-74th percentiles in boys and at 75th-84th percentiles in girls had higher anthropometric measurements and laboratory indings than the reference group. However, the health risks of those BMI percentiles did not signiicant different compared with the reference group.(Med J Indones 2009; 18: 41-7)
Keywords: normoweight, adolescent, BMI-for-age charts, anthropometric measurements, health risks
Normal body weight for children aged 2-20 years old is deined as the body mass index (BMI) value between percentile 5th and 85th according to the BMI-for-age charts from Centers for Disease Control & Prevention (CDC).1 However, Guo et al found that children with BMI value at 75th percentile, which is classiied as normal, had already a risk of being overweight and obese in adulthood.2 This result indicated that BMI at 75th percentile may have increased parameters indicating overweight or obesity which were not evaluated in that study.
Overweight and obesity are usually characterized by higher anthropometric measurements such as BMI, waist circumference (WC), waist to hip ratio (WHR),
subcutaneous fat, and body fat3 and increased risks for some diseases such as coronary heart disease4, diabetes type 2, dyslipidemia, hypertension, and metabolic syndrome.5-8
Body mass index at 75th percentile may have higher value of obesity parameters than of BMI at lower levels do. We intended to compare obesity parameters of higher BMI with those of lower BMI within normal percentile group according to CDC charts. Normal BMI according to the BMI classiication for adults from World Health Organization (WHO) was determined as reference group (BMI at 18.5-24.9 kg/m2).9 The purpose of this
normal BMI according to CDC charts compared with the reference group. Our hypothesis was that BMI at 75th percentile group had higher anthropometric measurements, laboratory indings, and health risk compared with the reference group.
METHODS
This study was conducted in Medical School of Atmajaya Catholic University. There were 170 students participated in this study. All subjects were new students of Medical School of Atmajaya, aged 17-20 years old. For practical reason, we determined BMI at 5th percentile as the lower limit of BMI value because the line indicating 5thn percentile is not available in BMI-for-age charts. Subjects with BMI at less than 5th percentiles, or BMI at 85th percentiles or more were excluded. After exclusion, there were 104 subjects consisted of 45 boys and 59 girls. The ethnicities of the subjects were 89.4% Chinese and 10.6% Indonesian native.
Anthropometrics measurements included BMI, WC, WHR, abdominal subcutaneous fat (ASF), and body fat. Body weight and height were measured while the subjects were without shoes and in minimal clothes. Weight was measured by using an electronic scale to the nearest 0.1 kg. Height was measured by using a Frankfurt position at a 90O angle against a
wall-mounted metal tape to the nearest 0.1 cm. The BMI was determined from these measures. Waist circumferences (HC) were measured by using a measuring tape to the nearest 0.1 cm at a horizontal line in the middle of the lowest rib and iliac crest at minimal inspiration. The hip circumference was measured at a horizontal line through the widest part of the buttocks. The waist to hip ratio was obtained by dividing WC with HC. Subcutaneous fat (SF) were measured on 3-sites using skinfold caliper (chest, abdominal, and thigh in boys, and triceps, suprailiac, and thigh in girls). An ASF measurement was added for girls to see abdominal SF thickness. Body fat percentage (%BF) was calculated using a Siri-Pollock equation from these 3-sites SF. The blood pressure was the average value from three measurements in seated position using a standard manual mercury sphygmomanometer.10
Blood sample was obtained after a minimum 8-hour night fast for the measurements of plasma glucose, serum cholesterol, triglyceride, and lipoprotein. Plasma
glucose levels were examined using a hexokinase enzymatic method. Cholesterol and triglyceride levels were measured enzymatically in a series of coupled reactions hydrolyzing cholesterol ester and triglyceride to cholesterol and glycerol.11
Subjects with normal BMI were grouped into 2 groups according to the BMI-for-age charts from CDC and according to the BMI classiication for adults (furthermore, it’s termed as reference group). Each subject could be in both of the BMI group. The normal BMI group according to the BMI-for-age charts from CDC was subdivided again into four subgroups (5th-24th, 25th-49th, 50th-74th, and 75th-84 percentiles). The normal value of WC and WHR were less than 94 cm and 0.95 in boys and less than 80 cm and 0.86 in girls according to the recommendation by World Health Organization for Asian ethnicity.9
Hypertension was deined according to JNC VII as systolic blood pressure at 140 mmHg or more, or diastolic pressure at 90 mmHg or more, or the use of antihypertensive.12 Type 2 diabetes, dyslipidemia, hypertriglyceride, and metabolic syndrome was deined according to the National Cholesterol Education Program (NCEP) Adult Treatment Panel III (ATP III).13 Type 2 diabetes was considered if the subjects had a fasting glucose level of greater than 125 mg/dL or if their physician diagnosed them. Dyslipidemia was deined as total hypercholesterolemia (total cholesterol level > 240 mg/dL), high low-density lipoprotein (LDL) level ( > 160 mg/dL), low high-density lipoprotein (HDL) level (< 40 mg/dL), and hypertriglyceridemia (> 200 mg/dL). Metabolic syndrome was deined according to this following criteria: triglyceride at 150 mg/dL or more, HDL less than 40 mg/dL in men or less than 50 mg/dL in women, blood pressure of at least 135/85 mmHg, and fasting glucose of at least 110 mg/dL.
RESULTS
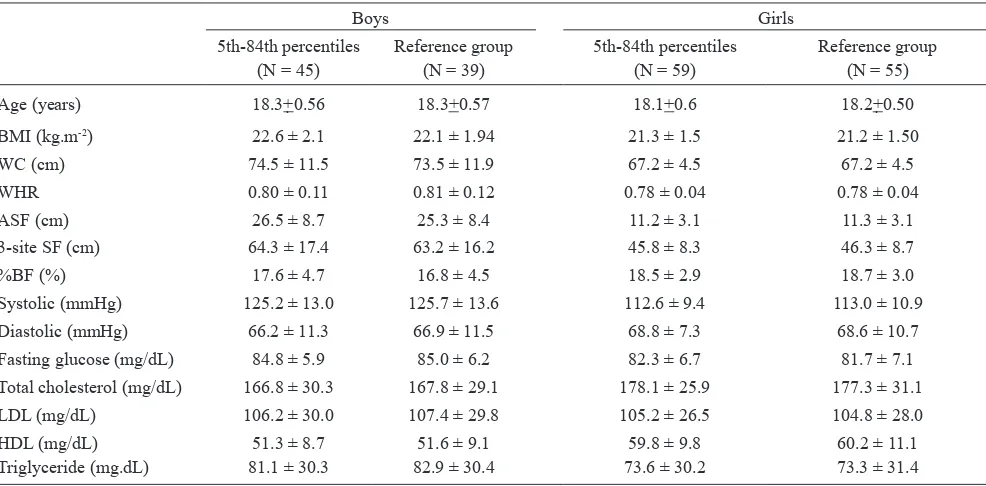
Comparison of anthropometrics and metabolic variables between normoweight and the reference group, in boys and in girls, is shown in Table 1. There are no different variables among 2 groups.
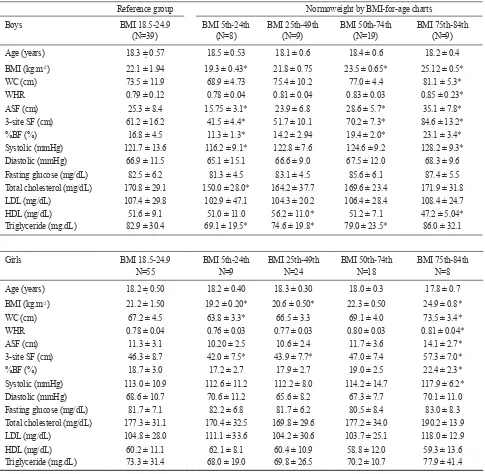
Table 2 shows the comparison of anthropometric and metabolic variables between four BMI subgroups and the reference group. Except for HDL level, variable values similar or lower than variable value of reference group are considered as normal. Therefore BMI subgroup at 5th-24th and 25th-49th percentiles in boys are considered normal BMI and BMI subgroup at 5th-24th, 25th-49th, and 50th-74th in girls are considered normal BMI.
Table 3 shows the correlation between anthropometric variables and metabolic variables. In girls, only ASF has a positive correlation with SBP whereas in boys, BMI, ASF, 3-site SF, and %BF have positive correlation with TG. ASF in boys also correlate positively with SBP and fasting glucose. All correlations of those variables are weak (r<0.40).
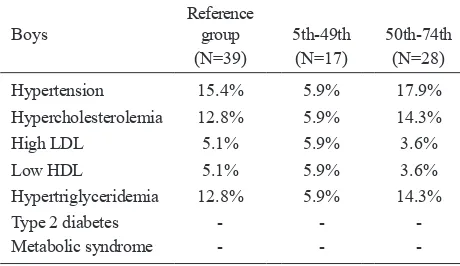
Prevalence of obesity-related metabolic diseases is shown in table 4. Hypertension, hypercholesterolemia, and hypertriglyceridemia are present whereas type 2
diabetes and metabolic syndrome are absent. In boys, the prevalence of the diseases in normal BMI are lower than in reference group whereas in higher BMI is almost similar. In girls, the prevalence of the diseases in normal BMI are almost similar with the reference group whereas in higher BMI is much higher. We compared the prevalence of the diseases in normal and high BMI vs reference group using X2 analysis as well as normal vs high BMI group. The result shows no signiicant difference in prevalence of the diseases in normal and high BMI vs reference group, and normal vs high BMI group.
DISCUSSION
There were some limitations of this study. We used reference values for adults in interpreting anthropometrics measurements and metabolic parameters because the reference values for adolescents were not available yet. This reference values might be too high for adolescents that could affect diagnostic conirmation and moreover the magnitude of the prevalence of the metabolic diseases. Another limitation was the number of the subjects that might be too small in each subgroup of the BMI according to the BMI-for-age charts that could affect statistical results.
Table 1. Comparison of the anthropometric and metabolic variables in boys and in girls with normal BMI according to the BMI-for-age
vs reference group
Boys Girls
5th-84th percentiles Reference group 5th-84th percentiles Reference group (N = 45) (N = 39) (N = 59) (N = 55) Age (years) 18.3+0.56 18.3+0.57 18.1+0.6 18.2+0.50 BMI (kg.m-2) 22.6 ± 2.1 22.1 ± 1.94 21.3 ± 1.5 21.2 ± 1.50
WC (cm) 74.5 ± 11.5 73.5 ± 11.9 67.2 ± 4.5 67.2 ± 4.5
WHR 0.80 ± 0.11 0.81 ± 0.12 0.78 ± 0.04 0.78 ± 0.04
ASF (cm) 26.5 ± 8.7 25.3 ± 8.4 11.2 ± 3.1 11.3 ± 3.1 3-site SF (cm) 64.3 ± 17.4 63.2 ± 16.2 45.8 ± 8.3 46.3 ± 8.7
%BF (%) 17.6 ± 4.7 16.8 ± 4.5 18.5 ± 2.9 18.7 ± 3.0
Systolic (mmHg) 125.2 ± 13.0 125.7 ± 13.6 112.6 ± 9.4 113.0 ± 10.9 Diastolic (mmHg) 66.2 ± 11.3 66.9 ± 11.5 68.8 ± 7.3 68.6 ± 10.7
Fasting glucose (mg/dL) 84.8 ± 5.9 85.0 ± 6.2 82.3 ± 6.7 81.7 ± 7.1
Total cholesterol (mg/dL) 166.8 ± 30.3 167.8 ± 29.1 178.1 ± 25.9 177.3 ± 31.1
LDL (mg/dL) 106.2 ± 30.0 107.4 ± 29.8 105.2 ± 26.5 104.8 ± 28.0
HDL (mg/dL) 51.3 ± 8.7 51.6 ± 9.1 59.8 ± 9.8 60.2 ± 11.1
The results of our study support a part of our hypothesis. BMI at 75th percentile had anthropometric measurement and laboratory inding higher than but the health risks was not different with the reference group. Based on this inding, BMI at 5th-49th in boys and at 5th-74th percentile in girls could be considered as
healthy weight in adolescents. Increased anthropometric measurements appear for the irst time in boys at lower BMI subgroup and in fewer amounts than in girls (Table 2). This indicates obesity may come earlier and develops gradually in boys whereas it comes later but develops fully at once in girls.
Table 2. Comparison of the anthropometric and metabolic variables in boys and in girls with subgroup of normal BMI according to the BMI-for-age vs reference group
Reference group Normoweight by BMI-for-age charts
Boys BMI 18.5-24.9 BMI 5th-24th BMI 25th-49th BMI 50th-74th BMI 75th-84th
(N=39) (N=8) (N=9) (N=19) (N=9)
Age (years) 18.3 ± 0.57 18.5 ± 0.53 18.1 ± 0.6 18.4 ± 0.6 18.2 ± 0.4
BMI (kg.m-2) 22.1 ± 1.94 19.3 ± 0.43* 21.8 ± 0.75 23.5 ± 0.65* 25.12 ± 0.5*
WC (cm) 73.5 ± 11.9 68.9 ± 4.73 75.4 ± 10.2 77.0 ± 4.4 81.1 ± 5.3*
WHR 0.79 ± 0.12 0.78 ± 0.04 0.81 ± 0.04 0.83 ± 0.03 0.85 ± 0.23*
ASF (cm) 25.3 ± 8.4 15.75 ± 3.1* 23.9 ± 6.8 28.6 ± 5.7* 35.1 ± 7.8*
3-site SF (cm) 61.2 ± 16.2 41.5 ± 4.4* 51.7 ± 10.1 70.2 ± 7.3* 84.6 ± 13.2*
%BF (%) 16.8 ± 4.5 11.3 ± 1.3* 14.2 ± 2.94 19.4 ± 2.0* 23.1 ± 3.4*
Systolic (mmHg) 121.7 ± 13.6 116.2 ± 9.1* 122.8 ± 7.6 124.6 ± 9.2 128.2 ± 9.3*
Diastolic (mmHg) 66.9 ± 11.5 65.1 ± 15.1 66.6 ± 9.0 67.5 ± 12.0 68.3 ± 9.6
Fasting glucose (mg/dL) 82.5 ± 6.2 81.3 ± 4.5 83.1 ± 4.5 85.6 ± 6.1 87.4 ± 5.5
Total cholesterol (mg/dL) 170.8 ± 29.1 150.0 ± 28.0* 164.2 ± 37.7 169.6 ± 23.4 171.9 ± 31.8
LDL (mg/dL) 107.4 ± 29.8 102.9 ± 47.1 104.3 ± 20.2 106.4 ± 28.4 108.4 ± 24.7
HDL (mg/dL) 51.6 ± 9.1 51.0 ± 11.0 56.2 ± 11.0* 51.2 ± 7.1 47.2 ± 5.04*
Triglyceride (mg.dL) 82.9 ± 30.4 69.1 ± 19.5* 74.6 ± 19.8* 79.0 ± 23.5* 86.0 ± 32.1
Girls BMI 18.5-24.9 BMI 5th-24th BMI 25th-49th BMI 50th-74th BMI 75th-84th
N=55 N=9 N=24 N=18 N=8
Age (years) 18.2 ± 0.50 18.2 ± 0.40 18.3 ± 0.30 18.0 ± 0.3 17.8 ± 0.7
BMI (kg.m-2) 21.2 ± 1.50 19.2 ± 0.20* 20.6 ± 0.50* 22.3 ± 0.50 24.9 ± 0.8*
WC (cm) 67.2 ± 4.5 63.8 ± 3.3* 66.5 ± 3.3 69.1 ± 4.0 73.5 ± 3.4*
WHR 0.78 ± 0.04 0.76 ± 0.03 0.77 ± 0.03 0.80 ± 0.03 0.81 ± 0.04*
ASF (cm) 11.3 ± 3.1 10.20 ± 2.5 10.6 ± 2.4 11.7 ± 3.6 14.1 ± 2.7*
3-site SF (cm) 46.3 ± 8.7 42.0 ± 7.5* 43.9 ± 7.7* 47.0 ± 7.4 57.3 ± 7.0*
%BF (%) 18.7 ± 3.0 17.2 ± 2.7 17.9 ± 2.7 19.0 ± 2.5 22.4 ± 2.3*
Systolic (mmHg) 113.0 ± 10.9 112.6 ± 11.2 112.2 ± 8.0 114.2 ± 14.7 117.9 ± 6.2*
Diastolic (mmHg) 68.6 ± 10.7 70.6 ± 11.2 65.6 ± 8.2 67.3 ± 7.7 70.1 ± 11.0
Fasting glucose (mg/dL) 81.7 ± 7.1 82.2 ± 6.8 81.7 ± 6.2 80.5 ± 8.4 83.0 ± 8.3
Total cholesterol (mg/dL) 177.3 ± 31.1 170.4 ± 32.5 169.8 ± 29.6 177.2 ± 34.0 190.2 ± 13.9
LDL (mg/dL) 104.8 ± 28.0 111.1 ± 33.6 104.2 ± 30.6 103.7 ± 25.1 118.0 ± 12.9
HDL (mg/dL) 60.2 ± 11.1 62.1 ± 8.1 60.4 ± 10.9 58.8 ± 12.0 59.3 ± 13.6
Triglyceride (mg.dL) 73.3 ± 31.4 68.0 ± 19.0 69.8 ± 26.5 70.2 ± 10.7 77.9 ± 41.4
Our inding showed that the ideal BMI of the subjects seemed to be at lower percentile grade than the CDC reference (Table 2). There are some possible explanations to answer this inding. First, the adiposity and anthropometric measurements are inluenced by the race or the ethnicity. The Asian ethnicity has more fat tissue for a given BMI than Caucasian, Hispanic, and African.14,15 Moreover, although the most-recent BMI-for-age charts were published in 2000, they were made by collecting data from 1963 to 1995 based on national surveys of US children.3 The eating habit, lifestyle, and the ethnicity might not be appropriate with our subjects nowadays. This could put our subjects in normal BMI group but with high adiposity level.
Second, weight gain in children and adolescents, despite increased lean body mass, increased relatively larger fat mass particularly after 2 years of age. However, the results of our study are contradictive with another study in regard of gender inluence.16,17 Boys are considered
to have more lean mass and less fat mass than girls do. In this study, boys seem to be fatter than girls because they experience obesity at lower BMI group. This might be caused by markedly increased subcutaneous abdominal fat coming earlier in boys than in girls. Body mass index is one of the anthropometric measurements which increase higher than the reference group both in girls and in boys in this study. This conirms the importance of the use of BMI in diagnosing overweight and obesity. Body mass index measurement is simply and easily obtained and correlated strongly with body fat percentage particularly at high and extreme BMI levels.17 Indeed, high BMI level is associated with coronary heart diseases4, type 2 diabetes, dyslipidemia,
and metabolic syndrome.5,6,7,8 In our study, BMI has a positive correlation with TG only in boys. This is not surprising regarding BMI in our subjects is within normal. However, the use of the BMI alone to assess overweight and obesity as well as the risk of some diseases is less reliable. Using BMI only as a single predictor for assessing obesity and health risk is not recommended because BMI does not always represents adiposity level, the independent predictor of health risk.18 Therefore, we need to include some possible factors, such as WC, WHR, ASF, to assess obesity-related health risks. Some previous studies showed that the fat distribution rather than total body fat was a determinant factor for obesity-related diseases.19,20,21
Fat distribution on abdominal, is known as abdominal obesity or visceral adiposity, has been increased sharply among children recently.22 The WC and WHR are indicators of abdominal obesity that explains visceral adipose tissue (VAT) or intraabdominal fat accumulation.19,20 Visceral abdominal tissue is more hazardous and more related with type 2 diabetes, CHD, dyslipidemia, hypertension, and metabolic syndrome23 because it’s more sensitive to lipolytic stimuli to release free fatty acids (FFA). High level of FFA will inhibit glucose uptake and oxidation by muscle and other organs that could lead to insulin resistance. Study by Sam et al found VAT was associated with higher very low-density lipoprotein (VLDL) and low-density lipoprotein (LDL) particle numbers, and smaller high-density lipoprotein (HDL) particles which are responsible for CHD.24 However, WC and WHR do not correlate with any metabolic variables in this study (Table 3).
Table 3. Correlation between anthropometric and metabolic variables in boys and in girls
BMI WC WHR ASF 3-site SF %BF
♂ ♀ ♂ ♀ ♂ ♀ ♂ ♀ ♂ ♀ ♂ ♀
SBP 0.22 0.12 0.24 0.01 0.09 0.13 0.27* 0.27* 0.23 0.05 0.23 0.05
DBP 0.22 0.03 0.16 0.00 0.05 0.02 0.14 0.05 0.17 0.05 0.17 0.05
Fasting glucose 0.17 0.06 0.25 0.05 0.11 0.00 0.26* 0.00 0.21 0.07 0.20 0.07
Total cholesterol 0.17 0.03 0.17 0.05 0.10 0.06 0.11 0.00 0.14 0.06 0.12 0.07
LDL 0.14 0.09 0.15 0.13 0.08 0.12 0.13 0.05 0.12 0.12 0.11 0.13
HDL -0.06 -0.1 -0.0 -0.1 -0.0 -0.1 -0.20 -0.13 -0.11 -0.1 -0.11 -0.1
TG 0.33# 0.02 0.20 0.02 0.08 0.04 0.26* 0.15 0.30* 0.09 0.28* 0.10
Subcutaneous fat, particularly (ASF), have been considered as a good predictors of body fatness and obesity-related health risk. Study by Nooyens et al showed that skinfold thickness, as a measurement of subcutaneous fat, predicted fatness in adolescent better than BMI did.18 Study by Maffeis found that ASF, and not VAT, was correlated with insulin sensitivity in prepubertal children.25 Our study also reveals that ASF correlates with more metabolic variables than the other anthropometric variables do (Table 3). In girls, ASF has a positive correlation with systolic blood pressure (SBP) only, whereas in boys, ASF has positive correlation with SBP, fasting glucose, and TG. The greater ASF value in boys might determine its correlation with more metabolic variables and correlation between 3-site SF and %BF with TG.
In general, anthropometric measurements and laboratory indings value in this study were not increased markedly above normal values. Number of subjects experiencing obesity-related diseases is also not too many. These may result only a few signiicant correlation between anthropometric and metabolic variables and no signiicant health risk between high and low BMI group. However, increasing obesity-related diseases in high BMI group, particularly in girls (Table 4), indicate a higher prevalence in higher BMI group.
In conclusion, this study has shown that BMI at 75th percentile has anthropometric measurements and laboratory indings greater than the reference group does without a difference in health risk. We recommend performing further studies to determine a cutoff value of anthropometric measurements for adolescent and also to conirm the inding of this study with a greater number of participants at more various level of age in adolescents.
Table 4. Prevalence of obesity-related diseases in boys and in girls
Boys
Statistic analysis to compare prevalence of the diseases between normal and high BMI vs reference group, and normal vs high BMI group using χ2 shows no signiicant
different.
Acknowledgment
We would like thanks all medical students of Atmajaya University for willingness to participate; Glory MD, Julia MD, and all colleagues for technical assistant, and Atmajaya School of Medicine for supporting grants.
index values in childhood and adolescents. Am J Clin Nutr. 2002;76:653-58.
Krebs NF, Himes JH, Jacobson D, Nicklas TA, Guilday P,
3.
Styne D. Assessment of child and adolescent overweight
and obesity. Pediatr. 2007;120 (Suppl):S193-228.
Baker JL, Olsen LW, Sørensen TIA. Childhood body mass 4.
index and the risk of coronary heart diseases in adulthood.
N Engl J Med. 2007;357:2329-37.
National Task Force on the Prevention and Treatment of 5.
Obesity. Overweight, obesity, and health risk. Arch Intern Med. 2000;160:898-904.
Weiss R, Dziura J, Burgert TS, Tamborlane WV, Taksali 6.
SE, Yeckel CW, et al. Obesity and the metabolic syndrome in children and adolescents. N Engl J Med.
2004;350:2362-74.
Grundy SM, Cleeman JI, Daniels SR, Donato KA, Eckel
7.
RH, Franklin BA, et al. Diagnosis and management of
the metabolic syndrome. An American Heart Association/ National Heart, Lung, and Blood Institute Scientiic Statement. Circulation. 2005;112:2735-52.
Janssen I, Katzmarzyk PT, Ross R. Waist circumference
8.
and not body mass index explains obesity-related health
risk. Am J Clin Nutr. 2004;79:379-84.
WHO: Obesity: preventing and managing the global 9.
Lohman TG, Roche AF, Martorell R. Anthropometric 10.
standardization reference manual. 2nd ed. Champaign, Ill:
Human Kinetics; 1991.
Harris MI, Flegal KM, Cowie CC, et al. Prevalence of
11.
diabetes, impaired fasting glucose, and impaired glucose tolerance in US adults: the Third National Health and
Nutrition Examination Survey, 1988-1994. Diabetes Care. 1998;21:518-24.
Chobanian AV, Bakris GL, Black HR, Cushman WC, Green 12.
LA. Izzo JL, et al. Seventh Report of the Joint National
Committee on Prevention, Detection, Evaluation, and
Treatment of High Blood Pressure. Joint National Committee VII: Complete report. Hypertension. 2003;42:1206-52.
Expert Panel on Detection, Evaluation, and Treatment of
13.
High Blood Cholesterol in Adults. Executive summary of the third report of the National Cholesterol Education Program (NCEP) Exprt Panel on Detection, Evaluation, and Treatment of High Blood Cholesterol in Adults (Adult
Treatment Panel III). JAMA. 2001;285:2486-97.
Gill TP. Cardiovascular risk in the Asia-Paciic region from 14.
a nutrition and metabolic point of view: abdominal obesity.
Asia Paciic J Clin Nutr. 2001;10:85-89.
Wildman RP, Donfeng G, Reynolds, Xianfeng D, Jiang 15.
H. Appropriate body mass index and waist circumference
cutoffs categorization of overweight and central adiposity among Chinese adults. Am J Clin Nutr. 2004;80(5):1129-36. Maynard LM, Wisemandle W, Roche AF, Chumlea WC, 16.
Guo SS, Siervogel RM. Childhood body composition in
relation to body mass index. Pediatr. 2001;107:344-50. Taylor RW, Jones IE, Williams SM, Goulding A. Body fat 17.
percentage measured by dual-energy x-ray absorptiometry corresponding to recently recommended body mass index cutoffs for overweight and obesity in children and adolescents
aged 3-18 y. Am J Clin Nutr. 2002;76(6):1416-21.
Nooyens ACJ, Koppes LLJ, Visscher TLS, Twisk JWR, 18.
Kemper HCG, Schuit AJ, et al. Adolescent skinfold
thickness is a better predictor of high body fatness in adults than is body mass index: the Amsterdam Growth & Health
Longitudinal Study. Am J Clin Nutr. 2007;85(6):1533-39. Janssen I, Katzmarzyk PT, Ross R. Waist circumference 19.
and not body mass index explains obesity-related health
risk. Am J Clin Nutr. 2004;79(3):379-84.
Vega GL, Adams-Huet B, Peshock R, Willet DW, Shah B, 20.
Grundy SM. Inluence of body fat content and distribution on variation in metabolic risk. J Clin Endocrinol Metab. 2006;91(11):4459-66.
de Koning L, Merchant AT, Pogue J, Anand SS. Waist 21.
circumference and waist-to-hip ratio as predictors of cardio-vascular events: mete-regression analysis of prospective
studies. Europ Heart J. 2007;28(7):850-56.
McCarthy HD, Ellis SM, Cole TJ. Central overweight and 22.
obesity in British youth aged 11-16 years: cross-sectional study surveys of waist circumference. BMJ. 2003;326:624-629.
Fox CS, Massaro JM, Hoffmann U, Pou KM, Maurovich-23.
Horvat P, Liu CY, et al. Abdominal visceral and subcutaneous adipose tissue compartments. Circulation. 2007;116:39-48.
Sam S, Haffner S, Davidson MH, D’Agostino RB,
24.
Feinstein S, Kondos G, et al. Relationship of abdominal visceral and subcutaneous adipose tissue with lipoprotein
particle number and size in type 2 diabetes. Diabetes.
2008;57:2022-27.
Maffeis C, Manfredi R, Trombetta M, Sordelli S, Storti
25.
M, Benuzzi T, et al. Insulin sensitivity is correlated with subcutaneous but not visceral body fat in overweight and