DOI: 10.12928/TELKOMNIKA.v14i1.2750 741
Fault Diagnosis of Power Network Based on GIS
Platform and Bayesian Networks
Yunfang Xie*, Yuhong Zhou, Weina Liu
College of Mechanical and Electrical Engineering, Agricultural University of Hebei, Baoding 071001, Hebei, China
*Corresponding author, e-mail: [email protected]
Abstract
In order to determine the location of the fault components of the power network quickly and give troubleshooting solutions, this paper obtains a simplify structure of relay protection and circuit-breaker as key equipment by analyzing the power network topology of GIS platform and uses the Bayesian networks fault diagnosis algorithm and finally designs the power network fault diagnosis module based on GIS platform. Fault diagnosis algorithm based on Bayesian networks is a new method for power network fault diagnosis which deals with the power network fault diagnosis with incomplete alarm signals caused by the protection device’s and the circuit breaker’s malfunction or refusal to move, device failure of communication and other reasons in the use of Bayesian networks method. This method establishes the transmission line fault diagnosis model by using Noisy-Or, Noisy-And node model and similar BP neural network back propagation algorithm, and obtains the fault trust degree of each component by using the formula, and finally determines the fault according to the fault trust degree. The practical engineering application shows that the search speed and accuracy of fault diagnosis are improved by applying the fault diagnosis module based on GIS platform and Bayesian network.
Keywords: Bayesian Networks, Fault Diagnosis, Power Network
Copyright © 2016 Universitas Ahmad Dahlan. All rights reserved.
1. Introduction
At present, the main power network fault location is based on the scheduling model. This model lacks the necessary simulation and does not provide the line load transfer scheme, so the control of the line is based on the natural on/off power. The circuit-breaker control state and line relationship is not quantified, and the problem solving is lack of relevant mathematical model, so that the efficiency of fault diagnosis algorithm is not high, and there is no information about the structure of the overhead line, and the structure of the power network is lack of visual image [1]. Based on the GIS platform which can provide the topology of the actual line, the power network diagnosis system solves the above problems. The GIS platform expresses the logical connection of the tower, the circuit-breaker and the overhead line, so it provides a simulation environment. On this basis and using the map information of road and construction, we can make the fault point positioning more accurate and intuitive.
propagation algorithm, the transmission line fault diagnosis model is established. The fault trust degree of each component is obtained by using the formula, and the fault is determined according to the fault trust degree.
This paper discus that the power network establishes the simplified topology whose key equipment is the relay protection and circuit-breaker on the basis of the GIS platform from the point of view of engineering application. Then, using Bayesian networks fault diagnosis algorithm, the power network can quickly and accurately determine the location of the fault point, and the operation ticket of line scene can automatically generated.
2. Power Network Fault Diagnosis Based on GIS Platform
Because the multi power supply circuit has the characteristics of complex structure, multi loop and difficult control, so the research on fault characteristics of power network based on grid topology structure [7]. As the fault information comes from the position of the circuit-breaker, the connection relationship and the electrical quantity, the structural fault analysis is different from the power grid analysis of other electric power application software. The characteristic analysis (theoretical loss calculation, flow calculation etc.) of the general power grid focus on the connection between the connections of primary devices. The Power network fault diagnosis is an analysis of the local power network, which only analyzes the connection between the electrical equipment and the power network in the fault area. At the same time, we must establish a connection between variety of secondary equipment (including relay protection and automatic device) and primary devices and a variety of equipment [8]. Therefore, the research method based on the GIS platform can be chosen to realize fault analysis better. The network management of the power network based on GIS platform provides the topology of the actual line. A scene simulation environment based on GIS platform is provided about logical connection between the tower, circuit-breaker, and overhead line.
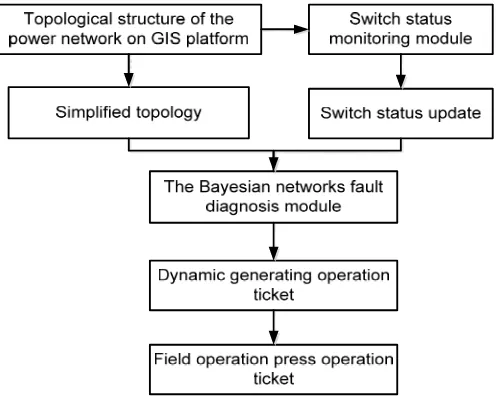
GIS platform has realized the integrated management of power network data. When the actual circuit faults occur, the detection of the circuit-breaker state is the basis of the fault diagnosis. In this paper, the circuit-breaker state monitoring terminal of 4G communication module is introduced, and the module sends a command to the monitoring center to identify the status of the current line when the circuit-breaker is disconnected. The circuit-breaker state is achieving synchronous and real-time display on the GIS platform. Under the premise, the topology of multi power supply circuit is studied, and the simplified topology of the relay protection and circuit-breaker as the key equipment is established. Finally, the line fault location is determined by using the Bayesian networks fault diagnosis algorithm. Figure 1 shows the specific program flow chart.
3. The Bayesian networks fault diagnosis algorithm 3.1. Noisy-Or model
Noisy-Or node in Bayesian networks is a generalization of logic "or". The Noisy-Or model is similar to logic "or", when all the premises of Nj are false, the events represented by Nj are also taken as false. But the different from logic "or" is that if a premise of Nj is true, it does not mean that the Nj value is true. Ni that is any prerequisite of Nj can be seen as having a probability qij that is associated with it and has a blocking effect. The value of Nj is true when Ni is the only prerequisite, then the probability that Nj is true is 1-qij. Set cij=1-qij is the conditional probabilities from node Ni to node Nj. Then the degree of belief when Node Nj is true can be calculated using the formula 1.
i
i ij
j Ture c Bel N True
N
Bel( ) 1 (1 ( )) (1)
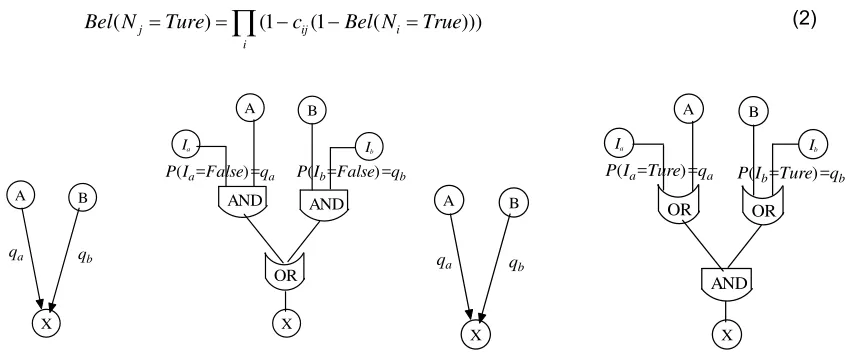
Among them, Nj is the jth Noisy-Or node in the network; Ni is Nj's the ith direct prerequisite, also known as the parent node; Bel indicates the degree of belief. The conceptual view of the Noisy-Or node is shown in Figure 2.
3.2. Noisy- And model
Noisy- And node in Bayesian networks is a generalization of logic "and". The Noisy- And model is similar to logic "and", when all the premises of Nj are true, the events represented by Nj are also taken as true. But the different from logic "and" is that if a premise of Nj is false, it does not mean that the Nj value is false. Ni that is any prerequisite of Nj can be seen as having a probability qij that is associated with it and has a blocking effect. The value of Nj is false when Ni is the only prerequisite, then the probability that Nj is false is 1-qij. Set cij=1-qij is the conditional probabilities from node Ni to node Nj. Then the degree of belief when Node Nj is true can be calculated using the formula 2. The conceptual view of the Noisy- And node is shown in Figure 3.
i
i ij
j Ture c Bel N True
N
Bel( ) (1 (1 ( ))) (2)
Figure 2. Conceptual view of Noisy-Or node
A B
X
qa qb
A B
Ia
P(Ia=Ture)=qa
X
OR
AND
P(Ib=Ture)=qb Ib
OR
Figure 3. Conceptual view of Noisy-And node
3.3. Parameter Learning Algorithm for Fault Model
Reference to the standard back propagation algorithm for training multilayer feedforward neural networks and using the gradient descent method, the mean square error between the actual value and the calculated value of the target variable is minimized, so that the parameter of the Bayesian network is modified. The gradient algorithm formula of Bayesian networks parameter adjustment is shown below [9]:
A B
X
qa qb
A B
Ia
AND
P(Ia=False)=qa
X
OR AND
Among them, cij is the conditional probability from the node Ni to node Nj, and its value range is [0,1]; η is the learning rate; δj is the error of node Nj. For the output node, δj is defined
Bel
j
is the predictive value of belief when Nj is true that is the jth target variable. For hidden layer nodes, the error from the node Nk to the parent node Nj can be calculated by the formula 5.In addition to the Noisy-Or and Noisy-And nodes, the network can also contain a logical "non" node. Logic "non" node's degree of belief can be calculated according to the formula 6:
)
Among them, Nj is a "non" node, Ni is the only parent node.
3.4. Diagnostic Methods
Using real time information of circuit breaker, the topology of the system before and after fault is identified by the method of real-time tie line analysis. Then find the difference between the two topologies, that is power supply interrupted region. The fault components must be in the outage area. After determining the outage area,protection and circuit breaker information of each component is brought into the fault diagnosis model which is modified by the parameter learning. And the fault trust degree of each component is inferred by using the formula 1 and 2. The component when its fault trust degree is above 0.7 is a deterministic fault component. And when its fault trust degree between 0.1~0.7, it is suspicious of faulty components. And when its fault trust degree below 0.1, it is a non fault component.
4. Case analysis
B1
L1
CB1 CB2
B2 L2
CB3 CB4
B3
CB5 CB6
B4
B5
CB7 CB8
L3
L4
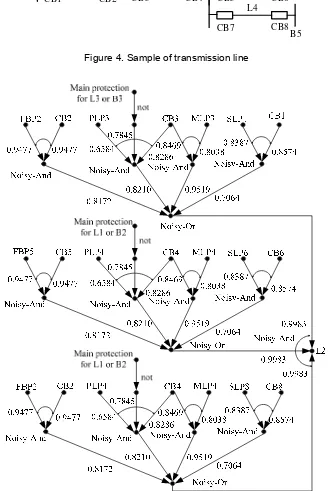
Figure 4. Sample of transmission line
Figure 5. The fault diagnosis model of transmission line
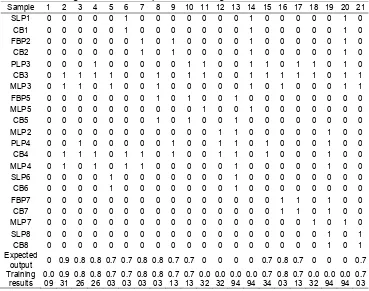
Table 1. Training results and samples of fault diagnosis model of transmission line
In this paper, by analyzing the power network data of GIS platform, a simplified structure of relay protection and circuit-breaker as key equipment obtained by reconstruction and simplify. On the basis of the simplified structure, the location of the fault component is determined by using the Bayesian networks fault diagnosis algorithm. Finally, the system automatically generates the operation ticket of line scene, which can guide the staff to quickly eliminate the fault, shorten the power outage time and improve the reliability of power supply. Examples show that the fault diagnosis model has the characteristics of strong versatility, fast reasoning, high learning efficiency and high fault tolerance. And the fault trust degree of each component is obtained by using the formula, and the fault is determined according to the fault trust degree. Practical engineering application shows that the developed fault diagnosis models are correct and efficient.
Acknowledgements
This work was supported by Baoding Science and Technology Research and Development Project (11ZG029, 11ZN015, 14ZG004, 12ZG027)
References
[1] Qi-feng Long, Gang Chen, Xiao-qun Ding. New Method of Power Network Topology Analysis Based on Object-Oriented Technology. Proceedings of the CSU-EPSA. 2005; 17(1): 73-77.
[2] CIGRE TF. Practical Use of Expert Systems in Planning and Operation of Power Systems. ELECTRA. 1993; (2): 31-68.
[3] Jongepier AG. Neural Networks Applied to Alarm Processing. Proceeding of 3rd Symposium on Expert Systems Application to Power System. 1991: 615-621.
[5] Haiying Dong, Xiaonan Li. Fault Diagnosis for Substation with Redundant Protection Configuration Based on Time-Sequence Fuzzy Petri-Net. TELKOMNIKA Telecommunication Computing Electronics and Control. 2013; 11(2): 231-240.
[6] Mithun M. Bhaskar, Sydulu Maheswarapu. A Hybrid Genetic Algorithm Approach for Optimal Power Flow. TELKOMNIKA Telecommunication Computing Electronics and Control. 2011; 9(2): 211-216. [7] Shuang Zhao, Jian-wen Ren. Design and realization of a fault diagnostic system for electric power
system. East China Electric Power. 2003; 32(11): 19-21.
[8] Wei Zhu, Daqing Mu. Two Methods of Power Network Topology Analysis. Journal of Changsha University of Electric Power (Natural Science). 2001; 16(2): 13-25.