ABSTRACT
ABSTRAK
DEDICATION
ACKNOWLEDGEMENTS
TABLE OF CONTENTS
Abstract………..………...………i
Abstrak………....ii
Dedication………..iii
Acknowledgement………..iv
Table of Contents………..v
List of Figures………..viii
List of Tables………...x
List Of Abbreviations, Symbols, Specialized Nomenclature……….xi
List of Appendices……….xii
1. INTRODUCTION………...1
1.1Background……….………1
1.2Problem statement…………..……….3
1.3Objectives………..……….3
1.4Scope………...…………..……….4
2. LITERATURE REVIEW……….………5
2.1 Introduction………...5
2.2 Service system…..…………..……….6
2.2.1 Characteristics of service systems…..………6
2.2.2 Measure of service efficiency...………7
2.3 Queuing theory………...8
2.3.1 Probability distribution………....10
2.3.1.1 Uniform distribution………11
2.3.1.2 Normal Distribution………...12
2.3.1.3 Bernoulli distribution……….14
2.3.1.4 Poisson distribution………...14
2.3.1.5 Exponential distribution………16
2.3.1.6 Weibull distribution………...17
2.3.2 The psychology of queues……….……….21
2.3.3 Suggestions for managing queues………..23
2.4 Simulation……….25
2.4.1 Definition of simulation………...25
2.4.2 Background of simulation………...25
2.4.3 Introduction to a few types of simulation software……….28
2.4.3.1 ProModel………...28
2.4.3.2 Arena……….29
2.4.3.3 Witness………..30
2.4.3.4 SDESA………...31
2.4.4 The steps to conduct simulation………..33
2.4.5 The advantages of using simulation………33
2.4.6 The limitations of using simulation……….34
2.5 Conclusion………35
3. METHODOLOGY.………36
3.1 Introduction………..36
3.2 Data collection at post office………37
3.3 System simulation and analysing using ProModel………...40
3.3.1 Steps to build up the model……….41
3.3.2 Steps to simulate the model……….49
3.4 Measure of service efficiency……….………..50
3.5 Model validation………...51
3.6 System improvement by varying the parameters………..51
3.7 The flow chart of working procedures………..52
3.8 Conclusion………54
4. RESULT AND ANALYSIS………55
4.1 Introduction………..55
4.2 Number of customer for 25 days…..………56
4.3 Number of give up departing customer………….………...59
4.4 Probability distribution for the five categories...………..61
4.5 Simulation result from ProModel..………...63
4.6.1 Break time for different counters……….69
4.6.2 Shift and break time before improvement..……….70
4.6.3 Shift and break time after improvement….……….71
4.7 Questionnaire summary………..………..72
4.8 Conclusion………74
5. DISCUSSION & SUGGESTION…...………75
6. RECOMMENDATONS FOR FUTURE WORK & CONCLUSION………78
6.1 Recommendations for future work….………..78
6.2 Conclusion………..…..………79
REFERENCES………..………..81
APPENDICES A Record of raw data ……….…...83
B Example of analysis of raw data ………...85
C Percentage of customer for the five categories ………..………...88
D Waiting duration for 25 days ……….…...89
E Service list of Ayer Keroh Post Office ………..…………...91
F Questionnaire for the customer ………..……...93
G Customers’ comments on Ayer Keroh Post Office ...………...94
LIST OF FIGURES
2.1 Service facility capacity 9
2.2 Continuous uniform distribution 12
2.3 Normal distribution 13
2.4 The plots of the Poisson probability density function for four values of
15
2.5 The Poisson cumulative distribution function with the same values of as the PDF plots
15
2.6 Probability density function of an exponential random variable for different value of
17
2.7 Weibull probability density function with different values of gamma 18 2.8 The Weibull cumulative distribution function with the same values
of as the probability density function
19
2.9 Pearson 6 distribution with different parameters 20
3.1 Table to record the data of waiting time and service time 37 3.2 The arrival of customer into the queue 38
3.3 The waiting area of post office 38
3.4 The waiting customers and the customers who were being served 39 3.5 The imitation of the layout of the post office counter system 40
3.6 Build menu 41
3.7 Layout of the model 42
3.8 Graphics window 43
3.9 Locations window 43
3.10 The windows to build up entities 44
3.11 Window to edit the entity 45
3.12 Windows to build up Processing 45
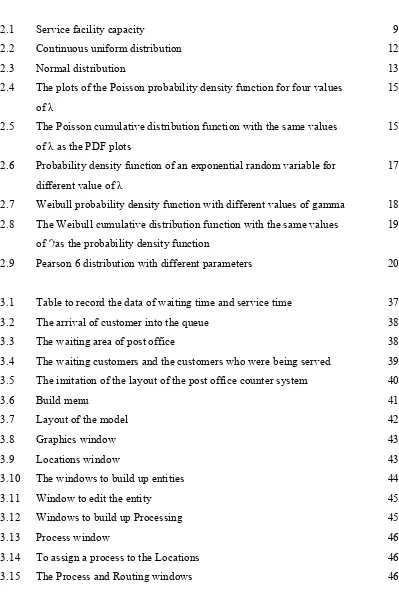
3.13 Process window 46
3.14 To assign a process to the Locations 46
[image:13.612.124.523.147.741.2]3.16 Tools window 47
3.17 Add routing for the same location 47
3.18 Arrivals windows 48
3.19 Simulation menu 49
3.20 Simulation window 49
3.21 Simulation menu 50
3.22 Simulation stop message window 50
3.23a The flow chart of procedures to conduct PSM I 52 3.23b The flow chart of procedures to conduct PSM II 53
4.1 Daily number of customer 56
4.2 Daily number of customer 57
4.3 Daily number of customer arranged according to day 58
4.4a-4.4j
Probability distribution suggested for the service time pattern of the 5 models
LIST OF TABLES
4.1 Number of give up departing customer 59 4.2 Simulation result for Monday-Peak-Season category 63 4.3 Simulation result for Monday-Normal-Season category 64 4.4 Simulation result for Saturday category 65 4.5 Simulation result for Peak-Season category 66 4.6 Simulation result for Normal-Season category 67 4.7 Break time of different counters before improvement and after
improvement
69
4.8 Shift and break table for categories of Peak, Monday-Normal, Saturday, Normal-Season and Peak-Season (before improvement)
70
4.9 Shift and break table for categories of Peak, Monday-Normal, Saturday, Normal-Season and Peak-Season (after improvement)
71
4.10 Satisfactory level of customers 72
LIST OF ABBREVIATIONS, SYMBOLS, SPECIALIZED
NOMENCLATURE
CPM - Critical Path Method FCFS - First Come First Serve PMB - Pos Malaysia Berhad
PDF - Probability Density Function
LIST OF APPENDICES
A Record of raw data 83
B Example of analysis of raw data 85
C Percentage of customer for the five categories 88
D Waiting duration for 25 days 89
E Service list of Ayer Keroh Post Office 91
F Questionnaire for the customer 93
CHAPTER 1
INTRODUCTION
1.1 Background
In general, post office is the place where we can buy stamp and post letter.
However, post offices in different countries or in different areas may provide various
kinds of extra service.
Post offices in Malaysia are under the governance of Pos Malaysia Berhad
(PMB). Pos Malaysia encompasses more than 674 Post Offices, over 305 Mini Post
Offices and more than
291 independent Postal Agents throughout
the nation. Their services are divided into four main categories which are
PosMel,
PosLaju, PosNiaga
and
PosLogistik
.
Particular in Malacca, there are 21 post offices. The head quarter of the
Malacca state post offices (Malacca General Post Office) is located at Bukit Baru.
According to the head of
Posniaga
Department of Malacca branch, the peak season
for the counter service starts from around 23
rdof a month until around 6
thof another
month. This is because the pay days of the government and private sectors and the
due date for bill-paying also drop within this duration. The peak hour of a day during
the peak season starts around 8.30 a.m. and ends around 3.00 p.m.; whereas, during
the normal day, the peak hour will usually start from 9.30 a.m. until 2.00 p.m. To
ensure the customers able to get response within a short duration, 75% of the
counters are always opened. Thus, the servers start work, rest, and end work at time
different from each other.
Malacca General Post Office consists of more than 20 counters which
responsible on various kinds of service. It uses digital numbering system in its queue
2
be seen in front of the counters. After taking a numbering ticket, the customers may
sit and wait at the waiting area, or they may go out for a while and come back again.
Malacca General Post Office and another 7 post offices among the 21 post
offices in Malacca apply certain system to measure the efficiency of the counter
service. The 5 types of data below are taken into consideration to calculate the
efficiency of the counter service.
a. the total number of customers in a particular day.
b. the total number of customers who are able to get service within 10
minutes after they take the ticket.
c. the average waiting time.
d. the longest waiting time.
e. percentage of achieved target.
*Data (a) – (d) are taken from the record of the digital-numbering system.
*Result (e) is the ratio of (b) and (a). [(value (b) / value (a)) x 100%]
*The target for Malacca branch post offices is to response to customers
within 10 minutes and achieves 90% of the target which means 90% of the
customers are desired to be responded within 10 minutes.
Ayer Keroh Post Office, one of the Malacca post offices, runs with 4 general
service counters. Different from the Malacca General Post Office, Ayer Keroh Post
Office does not use digital numbering system but apply the physically queue up
system. A waiting line can be seen in front of the counters. The customers have to
stay at the waiting line. If they leave the queue, when they want to come back to the
queue, they have to start queuing up from the last position again. Until present stage,
Ayer Keroh Post Office is not one of the Malacca post offices which apply the
1.2 Problem
Statement
In one day operation, post office may have certain duration which is the peak
hour where many customers wait to be responded. Also, within a month, there are
peak days in which more customers require for services than the normal day. In these
peak hour or peak days, if insufficient counters are opened for services, the waiting
line will be too long and cause the dissatisfaction of the customer. On the other hand,
if too many counters are opened for the services during the normal hours or normal
days, it will cause a waste of man power. As a result, the effectiveness in controlling
the number of counter becomes rather important.
Particular in Ayer Keroh Post Office, since it does not apply digital
numbering system in its queuing system, the controlling of the number of counter
give even more significant effect on the waiting line. When inadequate counters are
provided, the customers have to wait for such a long duration in the waiting line; yet
they cannot leave the waiting line since they will be treated as new customers and
have to queue up from the last position when they come back to the queue. The
inefficiency of counter service may cause the customers “balk” from the system
which means the customers leave the queue system entirely.
1.3 Objectives
1.
To simulate the counter service of post office
.
2.
To measure the efficiency of counter service of post office.
3.
To minimise the waiting time of the customers in post office.
4
1.4 Scope
1.
Only the services of the four counters which manage the general tasks
of post office are taken into consideration.
2.
Only the customers who queue up in the waiting line are counted in
the total number of customers in waiting line, whereas the customers
wait outside the line are not taken into account.
3.
The data are taken for only one month duration, which is from 22
ndNovember 2007 to 22
ndDecember 2007.
4.
The only simulation software used to conduct this case study is
ProModel.
5.
The factors which are taken into account to optimise the number of
service counters and minimise the waiting time of customer are the
waiting time in queue and service time at the counters, cost factor is
CHAPTER 2
LITERATURE REVIEW
2.1 Introduction
This chapter will discuss the meaning of service system and list down its
characteristics. Also, two methods on measuring the service efficiency, provided by
Martinich (1997) and Stevenson (2002), will be discussed. Other than that, this
chapter will give explanation on queuing theory. To know the distribution type for
the data set is essential in simulation, thus this chapter explains a few types of
distribution that are usually used in this particular case (post office service system).
To manage the queue effectively, a manager needs not only the changing on the
physical layout or shift and break time, the psychology of queues can be another
important factor in managing queue. Some explanation is given in this chapter on the
psychology of queues. Some suggestions for managing queues are also included in
this chapter. Furthermore, this chapter will discuss on simulation. Various types of
simulation, such as ProModel, Arena, Witness and SDESA are introduced in this
chapter. The steps to carry out a simulation have been discussed and the advantages
6
2.2 Service
Systems
Chung (2004) defined system as a collection of interacting components that
receives input and provides output for some purposes. Desmet, Looy and Dierdonck
(1998) defined service as “all those economic activities that are intangible and imply
an interaction to be realised between service and consumer”. While Harrell, Ghosh
and Bowden (2004) stated that service system is a processing system where one or
more services are provided to customers where entities (customers, orders, work, etc)
are routed through a series of service stations and waiting areas.
2.2.1 Characteristics of Service Systems
Services possess four unique characteristics which distinguish it from
manufacturing product. It is said that service is intangible (not a thing) and
perishable (cannot be inventoried). Other than that, service provides heterogeneous
output (output is vary) and involves simultaneous production and consumption
(service is produced and consumed at the same time). A main aspect of service
system which makes in different from manufacturing process is that it deals with
customer processing and the resource performing the service is human where human
have much more complex and unpredictable behaviour than parts and machines.
Since consumption and production of services occur simultaneously,
fluctuations in demand for service are hard to cope with. Usually, customers arrive
randomly and place immediate orders on the service. The customers have to wait in
line if the service capacity is fully utilized at the time he arrives. “Queue” is then
formed by these varying arrival rates and service requirements. The perception of
waiting is always more important to the customer than the actual waiting time
2.2.2 Measure of Service Efficiency
Martinich (1997) had provided a method on how to measure the queuing
system efficiency. When studying queuing systems, we will differentiate between
waiting time of the customers in queue and waiting time in the system. The time in
the queue refers to the time a customer spends waiting until he is being served; the
time in the system is the time the customer spends in the queue plus the time being
served. Similarly, the number of customers in the system is the number in the queue
added up with the number being served. There are four primary measures of waiting:
W
q= average time customers spend waiting in the queue
W
s= average time customers spend in the system
L
q= average number of customers waiting in the queue
L
s= average number of customers in the system
All the measures above are long-term average. An individual may experience
no waiting in the queue, but the average for all customers may be substantial.
Usually, these measures are assumed to be steady-state averages. The queuing
system is said to be in steady-state when the rate of departures from the system
equals the rate of the arrivals.
The performance measures W
q,W
s,L
qand
Ls, are affected by the numerical
parameters:
=
average rate of arrivals in customers / unit time
= average rate at which a server can serve customers in customers / unit
time
s =
number of servers in the system
= utilisation factor (customer arrivals / unit time divided by total service
capacity)
P
n= the probability or fraction of time that exactly n customers are in the
system
P
≥n= the probability or fraction of time that at least n customers are in the