BOGOR AGRICULTURAL UNIVERSITY STUDENT’S
CHARACTERISTICS BASED ON THEIR NATIONAL
EXAMINATION SCORE AND GPA
NOOR HIDAYATUZZAKIAH
DEPARTMENT OF STATISTICS
FACULTY OF MATHEMATICS AND NATURAL SCIENCES BOGOR AGRICULTURAL UNIVERSITY
PERNYATAAN MENGENAI SKRIPSI DAN
SUMBER INFORMASI SERTA PELIMPAHAN HAK CIPTA*
Dengan ini saya menyatakan bahwa skripsi berjudul Bogor Agricultural University Student’s Characteristics Based on Their National Examination Score and GPA adalah benar karya saya dengan arahan dari komisi pembimbing dan belum diajukan dalam bentuk apa pun kepada perguruan tinggi mana pun. Sumber informasi yang berasal atau dikutip dari karya yang diterbitkan maupun tidak diterbitkan dari penulis lain telah disebutkan dalam teks dan dicantumkan dalam Daftar Pustaka di bagian akhir skripsi ini.
Dengan ini saya melimpahkan hak cipta dari karya tulis saya kepada Institut Pertanian Bogor.
ABSTRACT
NOOR HIDAYATUZZAKIAH. Bogor Agricultural University Student’s Characteristics Based on Their National Examination Score and GPA. Supervised by ASEP SAEFUDDIN dan FARIT M AFENDI.
National Examination (UN) has been established as a standard to pass high school since 2002 with a purpose to improve the quality of education in Indonesia and measure student’s compentency during high school. It indicated an assumption that good UN score would provide good achievement in college as well. Student’s achievement at university is indicated by GPA (Grade Point Average). Theoretically, UN score and GPA should have high positive correlation. However, this is not automatically true. In 2010, more than 30% student who had high UN score got GPA TPB less than 2.50. This percentage tends to decrease in 2011 and 2012. By using pearson correlation test, there was a significance correlation between UN score and GPA TPB even the coefficient was weak and positif. Based on Multiple correspondence analysis in the last three years, characteristics of student who had high UN score and high GPA TPB were from faculty FATETA, FMIPA, FEM, and FEMA, from department with high popularity level such as ITP, STK, AGB, ILKOM, GIZI, TIN, SIL, and EKSYAR, and came from Banten, DKI Jakarta, and West Java. Whereas the characteristics students who had high UN score but got low GPA TPB were from veterinary faculty, enrolled IPB through UTMI, and had higher education and higher income family background.
Scientific Paper
to complete the requirement for graduation of Bachelor Degree in Statistics
at
Department of Statistics
BOGOR AGRICULTURAL UNIVERSITY STUDENT’S
CHARACTERISTICS BASED ON THEIR NATIONAL
EXAMINATION SCORE AND GPA
NOOR HIDAYATUZZAKIAH
DEPARTMENT OF STATISTICS
FACULTY OF MATHEMATICS AND NATURAL SCIENCES BOGOR AGRICULTURAL UNIVERSITY
Title : Bogor Agricultural University Student’s Characteristics Based on Their National Examination Score and GPA
Name : Noor Hidayatuzzakiah NIM : G14100105
Approved by
Prof Dr Asep Saefuddin, MSc Advisor I
Acknowledge by
Dr Farit M Afendi, MSi Advisor II
Dr Anang Kurnia, MSi Head of Department
ACKNOWLEDGEMENTS
Alhamdulillahi rabbil ‘alamin, many thanks to Allah subhanahu wa ta’ala for His bless so I can finish my research with the title “Bogor Agricultural University Student’s Characteristics Based on Their National Examination Score and GPA”.
The author realize that this paper would not have been complete without support from many people, that’s why the author would like to express her sincere thank to those who have helped:
1. Prof Dr Ir Asep Saefuddin,MSc and Dr Farit M Afendi,MSi as advisory committee for their kindness, warm advices, and helpful guidence during writing this paper.
2. Noormansyah and Maryam as her parent, and her sisters, Noor Indah Ekawati, Noor Ni’mati Khairunnisa, and Salma Noor Khalifatuzzahra, who always give unstoppable love, affection, spirit, and pray to the author all this time.
3. STK47 who always cheering her up with their spirit, support, jokes, and unimportant chat in group
4. The author’s closest friends, Gita as the roommate for four years in IPB, and Defika as the roommate in the last 3 month in IPB, for their support and everything.
5. The author’s high school friends, #istseleb, for being available anytime. Hopefully this paper can be useful for those who read it.
CONTENT
LIST OF TABLE ix
LIST OF FIGURE ix
LIST OF APPENDIX ix
INTRODUCTION 1
Background 1
Objective 2
METHODOLOGY 2
Data Source 2
Methods 2
RESULT AND DISCUSSION 3
Student’s Profile 3
Data Exploration 4
Correlation and Association Between UN Score and GPA TPB 7 Characteristics Student Based on UN Score and GPA TPB 8
CONCLUSION 12
REFERENCES 13
APPENDIX 14
LIST OF TABLE
1 Descriptive of UN score and GPA TPB 4
2 Range for UN score and GPA TPB 4
3 The list of subjects in TPB IPB 6
4 Percentage of UN score’s classes to GPA TPB’s classes 7
5 Correlation between UN score and GPA TPB 8
6 Chi-square test between classes of UN score and GPA TPB 8
7 Charactristics of students year 2010 9
8 Characteristics of students year 2011 and 2012 11
LIST OF FIGURE
1 Classification scheme of UN score and GPA TPB 3 2 Percentage of UN score and GPA TPB in 2010, 2011, 2012 5 3 Percentage of group (Y). (a) 2010. (b) 2011&2012 7 4 Plot of multiple correspondence analysis for student year 2010 10 5 Plot of multiple correpondence analysis for students year 2011&2012 12
LIST OF APPENDIX
1 List of variables and the categories 14
2 Percentage of each variables 15
3 Non-trivial eigenvalues for students year 2010 16 4 Column contribution of multiple correspondence analysis from
student year 2010 18
5 Non-trivial eigenvalues for students year 2011&2012 19 6 Column contribution of multiple correspondence analysis from
1
INTRODUCTION
In the history of education in Indonesia, national exam has been held since 1965 namely Ujian Negara and then changed into Ujian Sekolah in 1972, and then renamed to EBTANAS (Evaluasi Belajar Tahap Akhir Nasional) in 1980, then changed its name again to UAN (Ujian Akhir Nasional) in 2002, and renamed again to UN (Ujian Nasional) since 2005 until now. EBTANAS is the national exam’s format that has the longest period, which is 20 years. Cut-off score to pass EBTANAS is using formulations with involving grades odd and even semesters and pure UN score (Nilai Ebtanas Murni). Since 2002, when renamed to UAN, cut-off score to pass UAN is change into only pure UAN score. Then, in 2005 up to now, when UAN changed into UN, there is few changes formula to pass UN. In 2013, cut-off score was based on the proportion of student’s UN score and School exam score, which is 60:40.
Background
Mohammad Nuh as the minister of Kemendikbud said that National Exam (UN) is an effort to control the quality of education. The aim of quality control is to ensure continuous quality improvement. So UN is used for mapping as well coaching and improvement of education quality (Sidiknas 2013). Besides, some education observers also stated that UN is a test to prove the ability of students nationally. Therefore, UN is not only about material education, but also mental education for students.
Sudharto P Hadi as the head of Diponegoro University said that UN score is more proper than report score for SNMPTN Undangan selection because report score from each high school have different standards (Himawan 2012). However, the issues of ‘cheating’ in UN have been heard since few years ago in almost all over Indonesia. It cause doubt on the UN score, whether UN score still can consider as a standard to measure student’s competence or not, whether UN score can represent student’s performance at university level or not.
First year study in IPB, namely TPB (Tingkat Persiapan Bersama), is the starting point for all new students from various high schools. Subjects in TPB are a repetition from high school’s subjects, so that students first performance can be describe through GPA in TPB. Theoretically, good UN score will be followed by good GPA in TPB, but in fact, there are many students who have high UN score but low in GPA, or students who have low UN score but high in GPA.
2
Objective
The objective of this research are analysing the relationship between UN score and GPA and analysing the characteristics of student in IPB based on their UN score and GPA according to their demographics, high school status, and major at IPB.
METHODOLOGY
Data Source
This study used data from student affair directorate (Dit. AP) Bogor Agricultural University. Population is all students year 2010, 2011, and 2012 at TPB. The response variables are UN score and GPA, and the explanatory variables are :
1. Gender
2. High school status 3. Enrollment scheme
The method used in this research are:
1. Cleaning the data by checking data’s completeness. Observation with incomplete data was excluded in this process.
2. Explore the data using descriptive statistical analysis to determine respondent’s descriptions.
3. Check correlation between UN score and GPA TPB. 4. Classify UN score and GPA TPB into three classes
a. UN score divide into three classes, which are high, middle, and low. GPA also divide into three classes, which are high, middle, and low. To divide the range is using formula �̅±1
2�. Half of standard deviation is ideal to
divide the range for this data, because the width of each range is not too large or small so the total observations of each range is almost balance.
3
Figure 1 Classification scheme of UN score and GPA TPB
5. Check association between classes in UN score and classes in GPA TPB using chi-square test.
6. Implement Multiple correspondence analysis to describe the characteristics of each clusters.
a. Define indicator matrix (Z). Let Q be the number of variables. The dimension of matrix Z is nxp, where n is the number of observations, p is the number of total categories. Each variable contain pq
categories, so the total of categories is p (p=∑Qq=1pq ). Matrix Z
contain binary number, where 1 if the observation belongs to the corresponding category of each variable, and otherwise is 0.
b. Define burt matrix (�)��. Burt matrix is defined by ZTZ.
c. Calculate mass column total m,wherem= 1 n×QZ
T1 .
d. Define diagonal matrix ��� where the main diagonal is the element of m.
e. The solution of multiple correspondence analysis according to Kaciak and Louviere (1990) is calculating the eigenvalues (ei) and eigenvectors (wi) of S, �= ��−�/�����−�/�, then calculating the principal coordinate, �� =�����/�, where �= [�� ��] =�−�/��.
RESULT AND DISCUSSION
Student’s Profile
Overall, students year 2010, 2011, 2012 characteristic’s was almost the same. In terms of demographics, the number of female students in IPB exceeds the male with percentage over 55%. More than 40% of IPB students came from West Java, more than 8% from DKI Jakarta, more than 7% from Banten, around 18% came from Central Java, Yogyakarta and East Java, about 17% came from Sumatra, and the rest came from Kalimantan, Bali, Sulawesi, and around Eastern Indonesia. In term of family background, more than 40% of students had a father who reached college level, more than 30% at high school level, and the rest was below high school or blank. While mother's education level, about 35% at college level, 35% at high school level, and the rest was below high school or blank. Father’s occupation was dominated by civil servants/state/military/etc that was
4
more than 50%, as a private employee/entrepreneur/professional was around 16%, as a farmer/fisherman/laborer was around 17%, and the rest was work in other professions or blank. Most of parents income of IPB student’s were in range Rp2.500.000 until Rp5.000.000 per month, followed by range from 1,000,000 to Rp2.500.000 per month. The remaining are about 17% under Rp1,000,000 per month and about 28% higher than Rp5.000.000 per month.
IPB provided 5 schemes of enrollment, which were SNMPTN Undangan (USMI), SNMPTN Tulis (SBMPTN), International Achievement (PIN), local scholarship (BUD), and UTMI. The largest quota for new students was USMI, so that more than 60% of students IPB enrolled through USMI, then followed by SBMPTN about 17%, UTMI about 9%, and the rest was through BUD and PIN. The percentage of students who enrolled through USMI was reduced from 2010 to 2011 and 2012, so the percentage of students who enrolled through other schemes was increasing. The exact percentage was listed in Appendix 2.
Data Exploration
The average of GPA TPB in the last three years (2010, 2011, and 2012) increased every year. As seen in Table 1, in 2010 the average of GPA TPB was 2.71, in 2011 the average of GPA TPB was 2.93 and in 2012 the average of GPA TPB was 3.075. In contrast to UN score, year 2011 had the largest UN score than 2010 and 2012. In brief, the average and the standard deviation of UN score from 2010 to 2012 were 50.13 and 3.89 respectively, while the average and the standard deviation of GPA TPB were 2.91 and 0.63 respectively.
Table 1 Descriptive of UN score and GPA TPB
2010 2011 2012 TOTAL
UN SCORE Mean 49.36 51.12 49.99 50.13
St.Dev 3.58 3.89 3.99 3.89
GPA TPB Mean 2.71 2.93 3.08 2.91
St.Dev 0.63 0.62 0.59 0.63
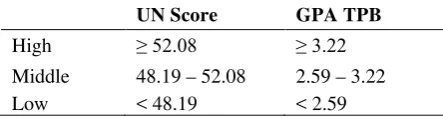
The distribution both UN score and GPA TPB was skewed to the left, means that the average of UN score and GPA TPB was less than the median of each score. UN score was classified into three classes, which were high, middle, and low. High if UN score more than the average plus half of standard deviation, low if UN score less than the average minus half of standard deviation, and middle was between them. This was applied to classified GPA TPB too. The score’s range was listed below in Table 2.
Table 2 Range for UN score and GPA TPB
UN Score GPA TPB
High ≥ 52.08 ≥ 3.22
Middle 48.19 – 52.08 2.59 – 3.22
Low < 48.19 < 2.59
5
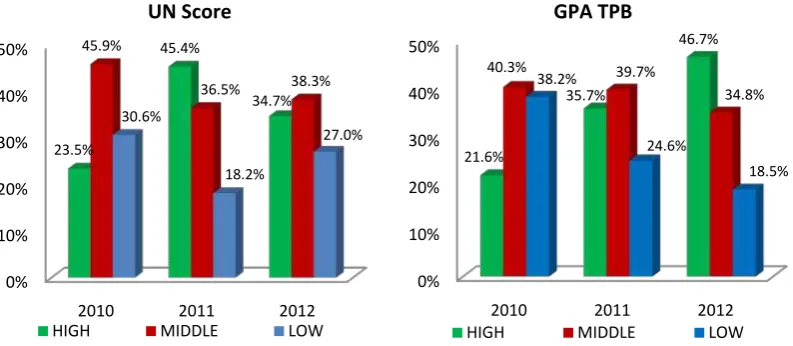
students in 2010, and 38.3% from total students in 2012, but in 2011 mostly in high class which was 45.4% from total students in 2011. Student year 2010 had the most percentage of students in low class (UN score less than 48.19) which was 30.6%, whereas students year 2011 had the least percentage of students in low class which was 18.2%.
Figure 2 Percentage of UN score and GPA TPB in 2010, 2011, 2012
Based on the second graph on Figure 2, students year 2010 and 2011 mostly in middle class (GPA TPB between 2.59 and 3.22) which were 40.3% from total students in 2010, and 39.7% from students in 2011. but in 2012 students mostly in high class which was 46.7%. From 2010 until 2012, the percentage of student who had high GPA TPB was increased, and student who had low GPA TPB was decreased.
UN score and GPA TPB was expected had a positive correlation or association, so the percentage of students who had high UN score must be pretty similar with the percentage of students who got high GPA TPB, and so on. Based on Figure 2, in 2010 the percentage of students who had high UN score was quite similar with the percentage of students who got high GPA TPB, and so did the middle and low classes. In 2011, the percentage of students who had high UN score (45.4%) was higher than the percentage of students who got high GPA TPB (35.7%). The percentage of students who had low UN score (18.2%) was lower than the percentage of students who got low GPA TPB (24.6%). While in 2012 the percentage of students who had high UN score (34.7%) was lower than the percentage of students who got high GPA TPB (46.7%). The difference percentage was caused by the changing system in UN and TPB.
The requirement to pass high school in 2012 was different with 2010 and 2011. To pass high school in 2010 and 2011, the average of total 6 subjects in UN must be more than 55, the minimum score was 40 for maximal two subjects, and the minimun score was 42.5 for other subjects. While to pass high school in 2012, Ujian Akhir Sekolah (UAS) was included into the calculation for final score. The proportion for final score was; UAS score 40% and UN score 60%. The minimum
6
final score to pass high school was 55, with the minimum score for each subject was 40. The percentage of students who had high UN score was decreasing in 2011 to 2012. It did not mean that the quality of students also decreasing, but it could be because of the system’s changing.
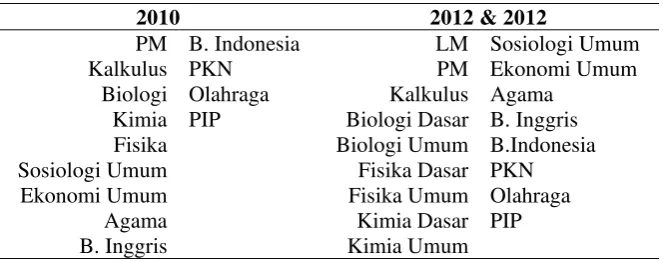
IPB was implement new curriculum at TPB and new scoring system started in 2011. The new curriculum for TPB was the reduction of some subjects for some certain major. The difference could be seen in Table 3. The new curriculum was offering subjects that the students need as the basic knowledgement, while the old curriculum was giving all TPB’s subjects to all students from various major. This could be one of many reasons why the student’s GPA TPB was increasing from 2010 to 2011 and 2012. Started in 2011, IPB not only changing the curriculum of TPB, but also changing the scoring system from 5 range score (A, B, C, D, E) to 7 range score (A, AB, B, BC, C, D, E). The difference of the scoring system could be possibly increasing the final score or GPA, and it could be another reason why the percentage of students who got high GPA TPB was ncreasing every year.
Table 3 The list of subjects in TPB IPB 2010 2012 & 2012
PM B. Indonesia LM Sosiologi Umum
Kalkulus PKN PM Ekonomi Umum
Biologi Olahraga Kalkulus Agama
Kimia PIP Biologi Dasar B. Inggris
Fisika Biologi Umum B.Indonesia
Sosiologi Umum Fisika Dasar PKN
Ekonomi Umum Fisika Umum Olahraga
Agama Kimia Dasar PIP
B. Inggris Kimia Umum
There was a different result (the increament of GPA TPB) when the new curriculum of TPB was applied, so the students in year 2011 and 2012 was combined in the next analysis as an observation who had different treatment with students in 2010.
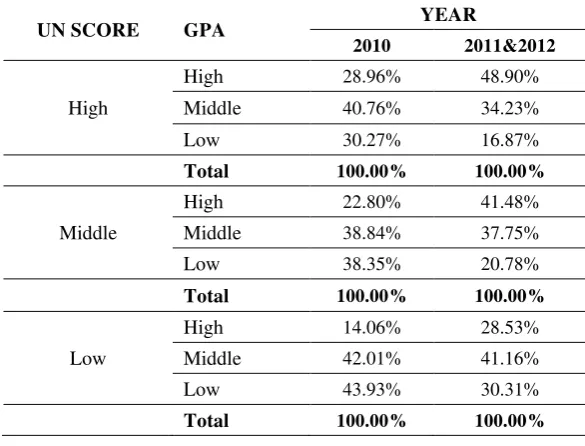
Table 4 was explaining the percentage of GPA TPB to each classes in UN score. Students in year 2010 who had a high UN score mostly got middle GPA TPB which was 40.76% only 28.96% of them got high GPA TPB, and around 30% of them got low GPA TPB. While the students who had low UN score was mostly got low GPA TPB, and there was 14.06% who got high GPA TPB. In year 2011 and 2012, the students who had high UN score mostly got high GPA TPB around 48.90% and only 16.78% of them got low GPA TPB. The students who had low UN score was mostly got middle GPA TPB and almost 30% of them got high GPA TPB. This was proving that the new curriculum and new scoring system could increase the GPA in TPB.
7
was increasing in 2011&2012 became 19.43%. Students who had high UN score but got low GPA TPB was decreased 0.41% from 2010 to 2011&2012. Overall, the quality of students in IPB gets better every year based on their achievement in high school and first year in college.
Table 4 Percentage of UN score’s classes to GPA TPB’s classes
UN SCORE GPA YEAR
Figure 3 Percentage of group (Y). (a) 2010. (b) 2011&2012
Correlation and Association Between UN Score and GPA TPB
8
Table 5 Correlation between UN score and GPA TPB
2010 2011 & 2012
Pearson Correlation 0.173 0.206
Sig. (2-tailed) .000 .000
N 3574 7102
Coefficient correlation between UN score and GPA TPB was low and positive, this mean that the correlation between UN score and GPA TPB was weak, and increament of UN score was followed by the increament of GPA in TPB. Significance (2-tailed) test of each year were less than alpha (0.05), so the null hypothesis was rejected, and it means that there was a correlation between UN score and GPA TPB, even the cofficient correlation was low. This was because the size of observation (n) was big, so the t-statistics became bigger and tend to reject null hypothesis.
After classifying UN score and GPA TPB into high, middle, and low as explained before, the association between classes in UN score and classes in GPA TPB could be seen by using Chi-Square test, with the null hypothesis was no association.
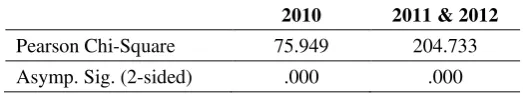
Table 6 Chi-square test between classes of UN score and GPA TPB
2010 2011 & 2012
Pearson Chi-Square 75.949 204.733
Asymp. Sig. (2-sided) .000 .000
Significance (2-sided) test of each year were less than alpha (0.05), so the null hypothesis was rejected, and it means that there was an association between classes in UN score and classes in GPA TPB. The association between UN score and GPA could be seen in Table 4. Students who got high GPA TPB tends to had high UN score rather than had middle or low UN score, while students who got low GPA TPB tends to had low UN score rather than had high or middle GPA TPB.
Characteristics Student Based on UN Score and GPA TPB
Student Year 2010
Chi-square test was used to knew the association between group (Y1-Y9) to other variables. The result was all variable had association with group except mother’s occupation because the significance value was more than alpha (0.05). Because mother’s occupation did not have association with group, so it was excluded from multiple correspondence analysis.
9
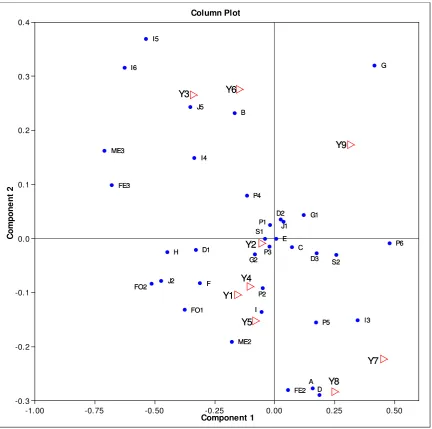
Categories that located far from the origin such as FE4, ME4, FO4, and, S3 indicated that only a few students in 2010 who did not fill father’s and mother’s former education (FE4 and ME4), and father’s occupation (FO4) on the registration form, and only slightly of those coming from foreign high school (S3). The first axis or component 1 was like classified groups based on GPA TPB. Above component 1 was for groups with low GPA TPB while below component 1 was for groups with high and middle GPA TPB. The second axis or component 2 was like classified groups based on UN score. In the right component 2 was for groups with low UN score, while in the left component 2 was for groups with high and middle UN score.
Variable group (Y1-Y9) was best described by the first and second principal axis with the same absolute contribution, 1.7%. Y1, Y2, Y4, and Y5 were located adjacent as shown in Figure 4, on the left component 2 and below component 1. Y1, Y2, Y4, and Y5 were a group who had high and middle UN score and got high and middle GPA TPB. Y3 and Y6 were located adjacent in the left of component 2 and above component 1. Y7 and Y8 were located adjacent in the right component 2 and below component 1. Y9 was located at the right component 2 and above component 1.
The characteristics of each group could be seen in Table 7. Y9 was located far from other categories, so group Y9 did not have tendency to a certain categories.
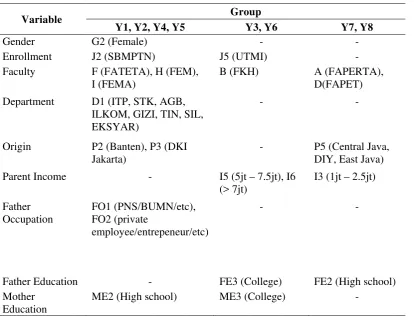
Table 7 Charactristics of students year 2010
Variable Group
Department D1 (ITP, STK, AGB,
ILKOM, GIZI, TIN, SIL, EKSYAR)
Father Education - FE3 (College) FE2 (High school)
Mother Education
10
Figure 4 Plot of multiple correspondence analysis for student year 2010
Student Year 2011 and 2012
The result of chi-square test was all variable had association with group except mother’s occupation because the significance value was more than alpha (0.05). Because the significance value of mother’s occupation did not have association with group, so it excluded from multiple correspondence analysis.
11
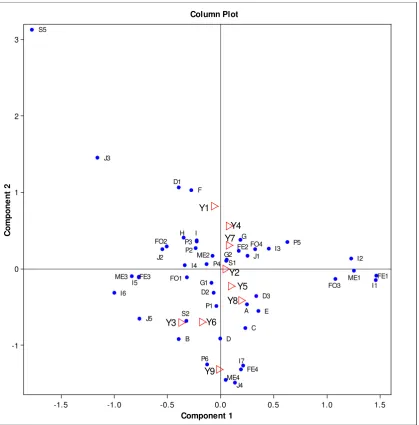
The formation of plot MCA graph in Figure 5 was like classifying groups based on GPA TPB only. The first axis or component 1 was like divided groups into two, above component 1 and below component 1. Above component 1 was for groups who had high GPA TPB, and below component 1 was for groups who had middle and low GPA TPB.
Group Y1-Y9 was well explained by the second principal axis. The result of ortoghonal projection in Figure 5, Y1, Y4, and Y7 were in the same quadran, Y2, Y5, Y8, Y3, Y6, and Y9 were in the same quadran. But if we see closely at Figure 6, Y3, Y6, Y9 were located far away from Y2, Y5, and Y8, means that Y3, Y6, Y9 had a different characteristics with Y2, Y5, Y8. The characteristics of each group was explained in Table 8.
Table 8 Characteristics of students year 2011 and 2012
Variable Group
Department D1 (ITP, STK, AGB,
ILKOM, GIZI, TIN, SIL, EKSYAR)
Jakarta), P4 (West Java)
- P1 (Sumatra), P6
Father Education FE2 (High school) FE1 (below High
school)
FE3 (college)
Mother Education
ME2 (High school) ME1 (below
High school)
ME3 (college)
12
Figure 5 Plot of multiple correpondence analysis for students year 2011&2012
CONCLUSION
UN score and GPA TPB had a low positive correlation and had association after calssified into several classes. From the last three years, the average of GPA TPB’s students in IPB had increase every year. It could be seen by the percentage of students who had high UN score and high GPA TPB (Y1), students who had middle UN score and high GPA TPB (Y4), and students who had low UN score and high GPA TPB (Y7) also increase every year. Students who had high UN score but low GPA TPB, and had low UN score and low GPA TPB was decrease every year. This means that students in IPB gets better every year. Characteristics of students who had high both UN score and GPA TPB were from faculty FATETA, FMIPA, FEM, and FEMA, from department which had high popularity level such as ITP, STK, AGB, ILKOM, GIZI, TIN, SIL, and EKSYAR, and
13
enrolled IPB through SNMPTN Tulis. While characteristics of students who had high UN score but got low GPA TPB were from faculty of veterinary, enrolled IPB through UTM and local scholarship, and had high family background.
REFERENCES
Greenacre M. 2006. Multiple Correspondence Analysis. Los Angeles (US): SAGE Publications, Inc.
Greenacre M. 2007. Correspondence Analysis in Practice Second Edition. Boca Raton (US): Taylor and Francis Group, LLC.
Himawan, Susilo. 2012. 2013, UN jadi syarat SNMPTN Undangan [Internet]. [May 14 2012]; [downloaded 2014 March 4].
http://kampus.okezone.com/read/2012/05/14/373/628964/2013-un-jadi-syarat-snmptn-undangan/large
Hwang H, Tomiuk MA, Takane Y. 2008. Correspondence Analysis, Multiple Correspondence Analysis and Recent Developments [Internet]. [February 10 2008]. hlm: 15-20; [downloaded 2014 Februari 19].
Kaciak E, Louviere J. 1990. Multiple Correspondence Analysis of Multiple Choice Experiment Data. Journal of Marketing Research. 27(1): 455-465. Lebart L, Morineau A, Warwick KM. 1984.Multiple Descriptive Statistical
Analysis. New York (US): John Willey & Sons.
Roux LB, Rouanet H. Multiple Correspondence Analysis. Los Angeles (US): SAGE Publications, Inc.
Sidiknas. 2013. UN, Upaya Pengendalian Mutu Pendidikan [Internet]. [30 Oktober 2013]; [downloaded 2014 March 4].
www.kemdiknas.go.id/kemdikbud/node/1828
14
APPENDIX
Appendix 1 List of variables and the categories
NO VARIABLE CODE CATEGORY S2 Private school
S3 Foreign school
7 STUDENT'S ORIGIN P1 Sumatra P2 Banten P3 DKI Jakarta P4 West Java
P5 Central Java, DIY, East Java
15
Appendix 1 List of variables and the categories
NO VARIABLE CODE CATEGORY
9 FATHER OCCUPATION FO1 Civil servant
FO2 Private employee, Self-employed, Professional
FO3 Labor, Farmer, Fisherman
FO4 Other and Blank
10 MOTHER OCCUPATION MO1 Working
MO2 Not Working
11 FATHER EDUCATION FE1 Under Senior High School FE2 Senior High School FE3 College
F34 Blank
12 MOTHER EDUCATION ME1 Under Senior High School ME2 Senior High School ME3 College
M34 Blank
Appendix 2 Percentage of each variables
VARIABLE CATEGORY YEAR
16
Appendix 2 Percentage of each variables
VARIABLE CATEGORY YEAR
2010 2011 2012
Appendix 3 Non-trivial eigenvalues for students year 2010
No. Inertia Proportion Cumulative Histogram
17
Appendix 3 Non-trivial eigenvalues for students year 2010
No. Inertia Proportion Cumulative Histogram
21 0.0891 0.0218 0.6259 ***********
22 0.0886 0.0217 0.6475 ***********
23 0.0874 0.0214 0.6689 ***********
24 0.0863 0.0211 0.69 ***********
25 0.0844 0.0206 0.7106 **********
26 0.084 0.0205 0.7311 **********
27 0.0829 0.0203 0.7514 **********
28 0.079 0.0193 0.7707 **********
29 0.0779 0.019 0.7898 **********
30 0.0769 0.0188 0.8086 *********
31 0.0733 0.0179 0.8265 *********
32 0.0697 0.017 0.8435 ********
33 0.0664 0.0162 0.8597 ********
34 0.0652 0.0159 0.8757 ********
35 0.0627 0.0153 0.891 ********
36 0.0602 0.0147 0.9057 *******
37 0.0582 0.0142 0.9199 *******
38 0.056 0.0137 0.9336 *******
39 0.0538 0.0132 0.9468 ******
40 0.0529 0.0129 0.9597 ******
41 0.0482 0.0118 0.9715 ******
42 0.0385 0.0094 0.9809 ****
43 0.0371 0.0091 0.99 ****
44 0.0318 0.0078 0.9977 ****
45 0.0092 0.0023 1 *
18
Appendix 4 Column contribution of multiple correspondence analysis from student year 2010
Component 1 Component 2
Mass Inertia Coord Corr Contr Coord Corr Contr
Gender
G1 0.037 0.013 0.121 0.01 0.002 0.044 0.001 0
G2 0.054 0.009 -0.083 0.01 0.002 -0.03 0.001 0
Faculty
A 0.011 0.019 0.157 0.003 0.001 -0.277 0.011 0.004
B 0.004 0.021 -0.167 0.001 0.001 0.232 0.003 0.001
C 0.009 0.02 0.07 0.001 0 -0.017 0 0
D 0.004 0.021 0.185 0.002 0.001 -0.29 0.004 0.002
E 0.011 0.02 0.005 0 0 -0.001 0 0
F 0.01 0.02 -0.312 0.013 0.004 -0.083 0.001 0
G 0.018 0.018 0.416 0.043 0.013 0.32 0.026 0.008
H 0.014 0.019 -0.448 0.037 0.012 -0.025 0 0
I 0.008 0.02 -0.054 0 0 -0.136 0.002 0.001
Department
D1 0.02 0.017 -0.329 0.031 0.009 -0.021 0 0
D2 0.038 0.013 0.025 0 0 0.035 0.001 0
D3 0.033 0.014 0.175 0.017 0.004 -0.028 0 0
Enrollment Scheme
J1 0.064 0.007 0.036 0.003 0 0.031 0.002 0
J2 0.013 0.019 -0.473 0.037 0.012 -0.078 0.001 0
J3 0 0.022 -0.951 0 0 -0.585 0 0
J4 0.005 0.021 1.334 0.107 0.039 -0.599 0.022 0.008
J5 0.009 0.02 -0.351 0.013 0.005 0.243 0.006 0.002
School Status
S1 0.079 0.003 -0.04 0.01 0.001 -0.001 0 0
S2 0.012 0.019 0.255 0.01 0.003 -0.031 0 0
S3 0 0.022 0.492 0.001 0 1.869 0.009 0.004
Group
Y1 0.006 0.021 -0.159 0.002 0.001 -0.104 0.001 0
Y2 0.009 0.02 -0.057 0 0 -0.009 0 0
Y3 0.006 0.021 -0.343 0.009 0.003 0.266 0.005 0.002
Y4 0.01 0.02 -0.106 0.001 0 -0.089 0.001 0
Y5 0.016 0.018 -0.083 0.001 0 -0.153 0.005 0.002
Y6 0.016 0.018 -0.15 0.005 0.002 0.276 0.016 0.006
Y7 0.004 0.021 0.449 0.009 0.003 -0.224 0.002 0.001
Y8 0.012 0.019 0.246 0.009 0.003 -0.283 0.012 0.004
19
Appendix 4 Column contribution of multiple correspondence analysis from student year 2010
Component 1 Component 2
Mass Inertia Coord Corr Contr Coord Corr Contr
Origin
P1 0.017 0.018 -0.02 0 0 0.025 0 0
P2 0.006 0.021 -0.05 0 0 -0.092 0.001 0
P3 0.008 0.02 -0.023 0 0 -0.015 0 0
P4 0.038 0.013 -0.116 0.01 0.002 0.079 0.004 0.001
P5 0.017 0.018 0.172 0.007 0.002 -0.155 0.006 0.002
P6 0.005 0.021 0.478 0.013 0.005 -0.009 0 0
Parent Income
I1 0.005 0.021 1.84 0.182 0.067 -0.848 0.039 0.015
I2 0.01 0.02 0.969 0.117 0.041 -0.698 0.061 0.022
I3 0.017 0.018 0.345 0.027 0.009 -0.151 0.005 0.002
I4 0.033 0.014 -0.335 0.065 0.016 0.149 0.013 0.003
I5 0.015 0.019 -0.536 0.055 0.018 0.369 0.026 0.009
I6 0.011 0.02 -0.626 0.053 0.018 0.316 0.014 0.005
I7 0.001 0.022 2.369 0.046 0.018 -0.446 0.002 0.001
Father Education
FE1 0.012 0.019 1.404 0.308 0.104 -1.193 0.223 0.08
FE2 0.029 0.015 0.055 0.001 0 -0.281 0.037 0.01
FE3 0.043 0.012 -0.679 0.422 0.086 0.098 0.009 0.002
FE4 0.006 0.021 1.725 0.217 0.079 2.999 0.656 0.254
Father Occupation
FO1 0.05 0.01 -0.376 0.171 0.03 -0.132 0.021 0.004
FO2 0.014 0.019 -0.514 0.048 0.016 -0.084 0.001 0
FO3 0.014 0.019 0.946 0.157 0.052 -0.96 0.161 0.057
FO4 0.014 0.019 0.956 0.161 0.054 1.519 0.408 0.144
Mother Education
ME1 0.017 0.018 1.164 0.316 0.1 -1.015 0.24 0.081
ME2 0.033 0.014 -0.179 0.018 0.005 -0.191 0.021 0.006
ME3 0.034 0.014 -0.71 0.307 0.074 0.162 0.016 0.004
ME4 0.006 0.021 1.697 0.207 0.075 2.987 0.642 0.249
Appendix 5 Non-trivial eigenvalues for students year 2011&2012
No Inertia Proportion Cumulative Histogram
1 0.2492 0.0609 0.0609 ******************************
2 0.1642 0.0401 0.1011 *******************
3 0.1485 0.0363 0.1374 *****************
20
Appendix 5 Non-trivial eigenvalues for students year 2011&2012
No Inertia Proportion Cumulative Histogram
5 0.1322 0.0323 0.2047 ***************
6 0.1292 0.0316 0.2363 ***************
7 0.1219 0.0298 0.2661 **************
8 0.1079 0.0264 0.2924 ************
9 0.1075 0.0263 0.3187 ************
10 0.1012 0.0247 0.3434 ************
11 0.1003 0.0245 0.368 ************
12 0.0986 0.0241 0.392 ***********
13 0.0973 0.0238 0.4158 ***********
14 0.0966 0.0236 0.4394 ***********
15 0.0951 0.0232 0.4627 ***********
16 0.0947 0.0232 0.4858 ***********
17 0.0943 0.0231 0.5089 ***********
18 0.0934 0.0228 0.5317 ***********
19 0.0932 0.0228 0.5545 ***********
20 0.0913 0.0223 0.5768 **********
21 0.0908 0.0222 0.599 **********
22 0.0903 0.0221 0.6211 **********
23 0.0893 0.0218 0.643 **********
24 0.0884 0.0216 0.6646 **********
25 0.0878 0.0215 0.686 **********
26 0.0855 0.0209 0.7069 **********
27 0.0852 0.0208 0.7278 **********
28 0.084 0.0205 0.7483 **********
29 0.0815 0.0199 0.7682 *********
30 0.0811 0.0198 0.788 *********
31 0.079 0.0193 0.8073 *********
32 0.0787 0.0192 0.8266 *********
33 0.0753 0.0184 0.845 *********
34 0.071 0.0174 0.8623 ********
35 0.0668 0.0163 0.8787 ********
36 0.065 0.0159 0.8946 *******
37 0.0616 0.0151 0.9096 *******
38 0.0591 0.0144 0.9241 *******
39 0.0579 0.0142 0.9382 ******
40 0.0539 0.0132 0.9514 ******
41 0.051 0.0125 0.9638 ******
42 0.0471 0.0115 0.9754 *****
43 0.0371 0.0091 0.9844 ****
44 0.0348 0.0085 0.9929 ****
45 0.0289 0.0071 1 ***
21
Appendix 6 Column contribution of multiple correspondence analysis from student year 2011&2012
Component 1 Component 2
Name Mass Inert Coord Corr Contr Coord Corr Contr
Gender
G1 0.036 0.013 -0.087 0.005 0.001 -0.185 0.022 0.008
G2 0.055 0.009 0.057 0.005 0.001 0.122 0.022 0.005
Faculty
A 0.011 0.02 0.245 0.008 0.003 -0.47 0.029 0.014
B 0.004 0.021 -0.392 0.008 0.003 -0.92 0.044 0.023
C 0.01 0.02 0.229 0.007 0.002 -0.774 0.076 0.038
D 0.005 0.021 -0.005 0 0 -0.916 0.046 0.024
E 0.01 0.02 0.354 0.015 0.005 -0.556 0.038 0.019
F 0.012 0.019 -0.275 0.011 0.004 1.029 0.154 0.075
G 0.017 0.018 0.184 0.008 0.002 0.375 0.032 0.015
H 0.013 0.019 -0.346 0.021 0.006 0.404 0.028 0.013
I 0.009 0.02 -0.224 0.006 0.002 0.355 0.014 0.007
Department
D1 0.022 0.017 -0.393 0.049 0.013 1.065 0.358 0.151
D2 0.036 0.013 -0.066 0.003 0.001 -0.318 0.067 0.022
D3 0.033 0.014 0.332 0.063 0.015 -0.356 0.072 0.025
Enrollment Scheme
J1 0.06 0.008 0.252 0.122 0.015 0.167 0.054 0.01
J2 0.016 0.018 -0.547 0.066 0.02 0.254 0.014 0.006
J3 0 0.022 -1.156 0.001 0 1.45 0.001 0.001
J4 0.006 0.021 0.135 0.001 0 -1.491 0.147 0.076
J5 0.009 0.02 -0.763 0.063 0.021 -0.653 0.046 0.023
School Status
S1 0.078 0.003 0.052 0.017 0.001 0.107 0.072 0.005
S2 0.012 0.019 -0.324 0.017 0.005 -0.68 0.073 0.035
S5 0 0.022 -1.772 0.001 0 3.128 0.003 0.002
Group
Y1 0.018 0.018 -0.068 0.001 0 0.817 0.161 0.072
Y2 0.012 0.019 0.043 0 0 -0.008 0 0
Y3 0.006 0.021 -0.373 0.01 0.003 -0.701 0.035 0.018
Y4 0.014 0.019 0.074 0.001 0 0.558 0.057 0.027
Y5 0.013 0.019 0.094 0.001 0 -0.229 0.009 0.004
Y6 0.007 0.02 -0.179 0.003 0.001 -0.699 0.041 0.021
Y7 0.006 0.021 0.075 0 0 0.309 0.007 0.003
Y8 0.009 0.02 0.192 0.004 0.001 -0.417 0.018 0.009
22
Appendix 6 Column contribution of multiple correspondence analysis from student year 2011&2012
Component 1 Component 2
Name Mass Inert Coord Corr Contr Coord Corr Contr
Origin
P1 0.016 0.018 -0.039 0 0 -0.485 0.048 0.022
P2 0.007 0.021 -0.236 0.004 0.001 0.267 0.006 0.003
P3 0.008 0.02 -0.226 0.005 0.002 0.371 0.013 0.007
P4 0.041 0.012 -0.131 0.014 0.003 0.06 0.003 0.001
P5 0.016 0.018 0.627 0.082 0.025 0.348 0.025 0.012
P6 0.004 0.021 -0.128 0.001 0 -1.251 0.073 0.039
Parent Income
I1 0.007 0.021 1.459 0.166 0.056 -0.146 0.002 0.001
I2 0.011 0.019 1.226 0.217 0.069 0.133 0.003 0.001
I3 0.019 0.018 0.451 0.053 0.015 0.262 0.018 0.008
I4 0.026 0.016 -0.336 0.046 0.012 0.044 0.001 0
I5 0.014 0.019 -0.769 0.109 0.034 -0.111 0.002 0.001
I6 0.013 0.019 -1.001 0.162 0.051 -0.318 0.016 0.008
I7 0.001 0.022 0.211 0 0 -1.268 0.015 0.008
Father Education
FE1 0.017 0.018 1.463 0.497 0.147 -0.093 0.002 0.001
FE2 0.032 0.014 0.171 0.016 0.004 0.234 0.03 0.011
FE3 0.04 0.012 -0.77 0.467 0.095 -0.105 0.009 0.003
FE4 0.001 0.022 0.188 0.001 0 -1.316 0.026 0.014
Father Occupation
FO1 0.046 0.011 -0.317 0.103 0.019 -0.115 0.014 0.004
FO2 0.016 0.018 -0.506 0.054 0.016 0.294 0.018 0.008
FO3 0.017 0.018 1.079 0.277 0.082 -0.133 0.004 0.002
FO4 0.012 0.019 0.322 0.015 0.005 0.257 0.01 0.005
Mother Education
ME1 0.023 0.016 1.25 0.542 0.147 -0.024 0 0
ME2 0.034 0.014 -0.077 0.004 0.001 0.167 0.017 0.006
ME3 0.032 0.014 -0.837 0.379 0.09 -0.102 0.006 0.002
23
BIOGRAPHY
Noor Hidayatuzzakiah was born in Serang as the second child of four children from Noormansyah and Maryam on April 19th 1992. She lived and grew up in the same city before chasing her bachelor degree in IPB through SNMPTN. She was graduated from SMPN 1 Kota Cilegon in 2007 and SMAN 1 Kota Serang in 2010.
Statistics is her major and her minor is financial mathematics and actuary. During her college time, she joined many events as a committe in Statistika Ria, Pesta Sains Nasional, International Scholarship and Ecucation Expo, and etc. She also experinced organization in Gamma Sigma Beta as a staff in Department of Science in 2011/2012 and became the chief of Department Science in 2012/2013. She is participating as a lecturer assistant in Elementary Statistics subjects in academic year 2012/2013 and 2013/2014. Not only teaching as lecturer assistant, she also teachs as a private teacher in Katalis for elementary statistics subject and calculus.