International Conference on “Multidisciplinary Trends In Academic Research” (MTAR, 29 – 30 September 2014) MTAR © 2014 Global Illuminators, Bangkok, Thailand
---Study of the performance of XBee modules’ communication in clear
line of sight with different mounting elevations in viral advertisement
system
---Mohd Rusdy Yaacob
Universiti Teknikal Malaysia Melaka - Melaka
[email protected]
Abstract
:
This paper presents a study on the effect of distance between XBee modules to the signal strength and data packet size for three different mounting elevations. The study has been conducted by using two units of XBee modules which each represents a receiver and a transmitter. The transmitter is mounted in three different elevations which are 0.5, 1.5 and 2.5 meter from the ground while the receiver is fixed at the same elevation. When the transmitter continuously transmits the wireless signal carrying its particular address, the receiver will detect the signal address once the range of communication of both receiver and transmitter intersects. The results obtained are the signal strength, in percentage, and data size, in byte, with respect to the distance between receiver and transmitter for different mounting elevations of transmitter. These data are then converted into graph that illustrates the signal strength-distance and data packet size-distance characteristics for each mounting elevation. Finally, the best mounting elevation is to be identified based on the result obtained.Key words
:
XBee, signal strength, data packet.1.
Introduction
In the development of advertisement system, the importance of having wireless technology is significantly increasing especially in the scenario where the information is dynamically changing over the time. This is because wireless advertisement allows the flexibility in sending and displaying the information as well as modifying it when necessary. Despite it also solves the environmental issue from the usage of papers which are going to be dumped later on.
There are several types of protocol that can be used for a viral advertisement system. The one that could be very common nowadays is Zigbee protocol. The information is wirelessly transmitted within the range of the XBee device. The size of the advertisement can be transmitted at a certain period of time, as well as the signal strength the module can transmit are still questionable to be figured out. This is because how far the information is being sent out will result in different effect. Hence this study is done to provide a better understanding in term of explaining the behavior of data size and signal strength over the distance the data is transferred. However, the study will be just focusing on the communication within a clear line of sight without obstacles.
consumption, data rate, cost and time delay [1]. However the data packet size of information and signal strength of XBee modules over a distance did not come into consideration.
Another research was done by researchers from Akita, Japan regarding the flexible bus system using Zigbee as the communication medium. In their research, experiments were done to study the detection range as well as data transfer involved while the data being transferred was solely the bus routes and number of passengers [2]. Therefore, it is proven that Zigbee can be used in bus transportation system. This is a good motivation for a new research on the viral advertisement system which utilizes bus as the information carrier to spread out the advertisement.
In this paper, we will further discuss on the measuring principle in Section 2. Section 3 describes the experimental setup used for the data size measurement and finally in Section 4, we will thoroughly discuss the results obtained from the experiments
2.
Measuring Principle
I. XBee Module
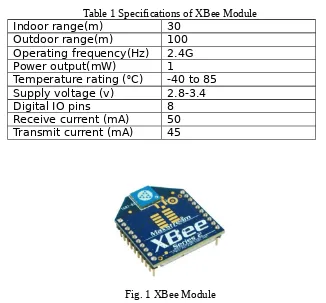
Xbee is using 2.4GHz bandwidth and use peer-to-peer mesh topologies suitable with the ZigBee system. It has multiple antenna options and low power sleep modes. The range of the signal can reach 100 m radius in the line of sight and 3 m through obstacles which is almost the same as size of a restaurant. The module will be connected to PIC16F877A where the data transmitted or received will be processed inside the PIC. Other characteristics are showed below in Table 1 and the outlook of the XBee module is shown in Fig. 1
Table 1 Specifications of XBee Module Indoor range(m) 30
Outdoor range(m) 100 Operating frequency(Hz) 2.4G Power output(mW) 1
Temperature rating (0C) -40 to 85
Supply voltage (v) 2.8-3.4 Digital IO pins 8 Receive current (mA) 50 Transmit current (mA) 45
Fig. 1 XBee Module
Table 2 XBee addressing for Transparent Mode
Address MY DL
XBee1 1111 2222
XBee2 2222 1111
For the analysis of the system, transparent mode will be used because the experiment only involves two points and it supports the Zigbee point-to-point communication principle which is further discussed in the next part.
II. Zigbee Point-to-point Communication
A viral advertisement system for this project is accomplished by employing the point-to-point communication using Zigbee. In general, a point-to-point communication refers to the communication connection between only two networking nodes. Information transmitted by one node can be received by the other node, which is contrasted with a point-to-multipoint or broadcast communication where many nodes can receive the information.
In this viral advertisement system, the information transmitted and received is the advertisement ID itself. A bus plays the role as the information carrier that carries the advertisement ID and transmits it to the respective bus top. Note that the advertisement ID was sent from the mall to the bus beforehand. The scenario is illustrated in Fig. 2. In this case, the point-to-point communication is employed between the bus and the mall as well as the bus and the bus stop.
Fig. 2 Viral advertisement system Fig. 3 Point-to-point communication between bus and bus stop
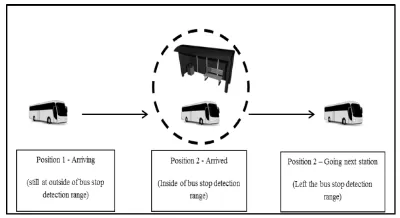
To further explain on the point-to-point communication, let us consider Scenario 2 from Fig. 2 only. It involves the communication between bus and bus stop as depicted in Fig. 3. The bus is now carrying the advertisement ID and approaching the bus stop but still in Position 1 which is outside the communication range. Once the bus entering the range as in Position 2, it will transmit the advertisement ID to the bus stop which is also equipped with computer and LCD monitor to display the information from the advertisement. The next experimental setup will only cover the measurement of data size transferred from bus to stop only in order to study the effect of distance on the maximum data size.
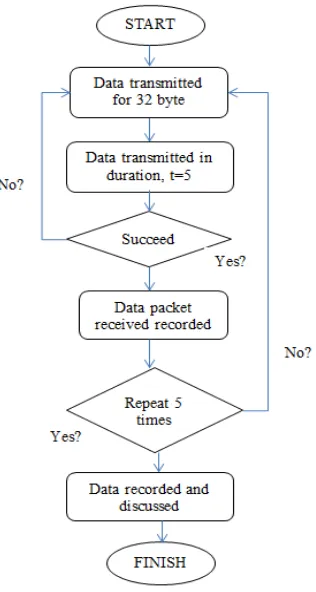
Fig. 4 Flowchart of connection between bus and bus station modules
3.
Experimental Setup
Two experiments were done to study the signal strength and data packet size that can be transferred in a certain period of time. As mentioned before, the measurement only covers the data transmitted from bus to bus stop only which is sufficient to study the data transfer behavior between two nodes. It is estimated that the time for a bus to pass a bus stop is 2 second without stop. For this reason, the data will be only sent within 2 second. Meanwhile each packet data consists of 32 bytes in size because it is the estimate size for a simple advertisement. For the signal strength test, data would be sent from transmitter to the receiver a byte per time depending on the signal strength where the data would be fast transferred if the strength was good. Limitation of the data transferred would be 200 bytes. These two experiments were done on a straight road by which the transmitter and the receiver are set in a line without any obstacle. Fig. 5 and Fig 6 illustrate the flowchart for each experiment.
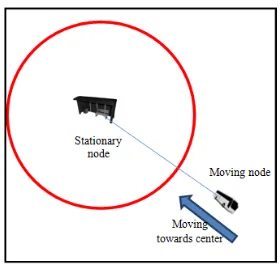
Fig. 7 Moving node and stationary node
As known earlier, there are two nodes involved in this experiment which are the moving node (bus) and the stationary node (bus stop) as depicted in Fig. 7. The moving node will move towards the stationary node. The moving node will transmit the data and stationary node will loopback data received from moving node.
In these experiments, X-CTU software is used to monitor the data in two different computers. First computer is used with the transmitter while the other one with the receiver. That means each bus and bus stop is equipped with a computer having the X-CTU software for monitoring. The values of signal strength and data packet size transferred can be obtained from the X-CTU interface as depicted in Fig. 8 and Fig. 9 respectively. The readings were taken for different distance between the bus and the bus stop. For each distance, the mounting elevations of the XBee module at the bus stop were set to be at 0.5 meter, 1.5 meter and 2.5 meter from the ground. Each point of elevation test was done to identify the best height for mounting the module at the bus stop.
4.
Results and Analysis
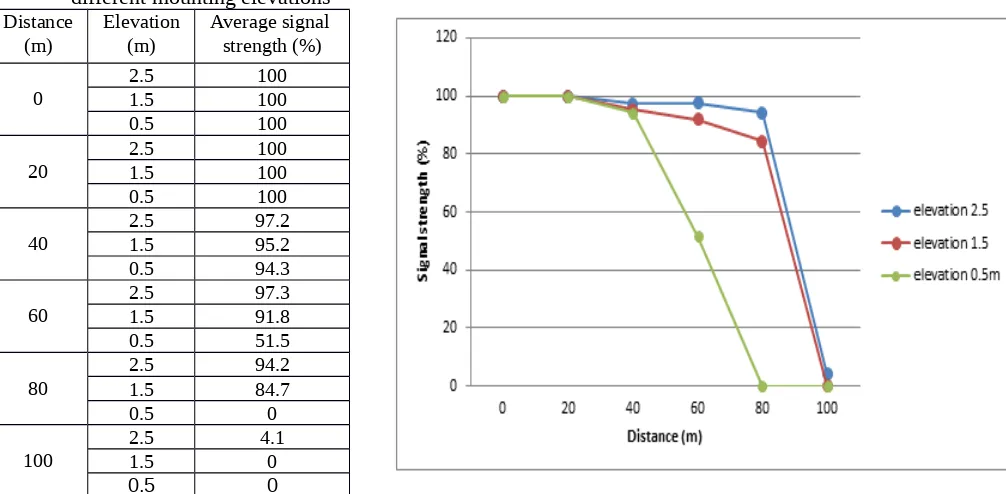
Note that the experiment was done on the real road with a car used to represent the bus. The position where the bus stop located is fixed at the same point. To have more precise result, the data is measured in five trials for each distance and mounting elevation. The results for signal strength measurement are tabulated in Table 3 for different mounting elevations with respect to the distance between XBee modules and finally converted into a graph as depicted in Fig. 10.
Table 3 Signal strength vs. distance for
different mounting elevations
Fig. 10 Graph of signal strength vs. distance for different mounting elevations
Fig. 10 shows that the signal strength was consistent for each mounting elevation until 20m distance. Beyond this distance, the result started to vary for every height elevation and it showed for the 0.5m elevation, signal strength dropped significantly as the distance between XBee modules getting further and completely lost at the distance of 80m. For 1.5m elevation, the signal dropped slightly beyond 20m before completely lost at the distance of 100m while for the 2.5m elevation the data still can be sent at almost 100% before starting to drop at distance nearly 90m and lost at 100m. The result shows that XBee can be used in clear line of sight with the highest elevation h=2.5 m as the ideal height to mount the XBee transmitter module. It also proved the maximum distance of the transmission can achieved in a line of sight which is 100m, agreed with the XBee specification [3].
Table 4 Data packet size vs. distance for different mounting elevations
0.5 0 Fig. 11 Graph of data packet size vs. distance for different
The results for data packet size measurement are tabulated in Table 4 for different mounting elevations with respect to the distance between XBee modules and finally converted into a graph as depicted in Fig. 11. The experiment had almost similar result wirh the previous one. The data packet size had significant drop earlier for 0.5m elevation at 40m distance and followed by 1.5m elevation at 60m distance. When the distance reached 100m, only XBee module at 2.5m elevation still received the packet data whereas others received none. This data packet size experiment was almost proportional to the signal strength experiment, so the data packet size should reach the receiver same as where there was signal strength between transmitter and the receiver. The result shows that at the maximum distance reached, the data still can be received by the receiver. Hence again the ideal height for mounting the XBee transmitter module is at 2.5m elevation.
As the distance increase, size of data received drops. It is hard to receive the maximum data in 2 second for a longer range. The data propagates more slowly due to long distance and energy of electromagnetic wave depleted as it propagates longer. Zigbee uses radio frequency to transmit and receive. Photons in the wave consist of energy that allows the radio wave to move, but the photon only has certain amount of energy. It only can propagate as long as the energy is sufficient [4]. This describes the general behavior of the graph in Fig. 11.
Among the three elevations, 2.5 meter seems to be the best position for the module to be mounted at the bus stop. The curve is almost stable showing that there is less disturbance effect from surrounding (vehicles on the road) when the module is mounted higher.
References
[1] Study On Zigbee Technology, Muthu Ramya. C,Shanmugaraj. M, Prabakaran. R, Anna University of Technology, Tiruchirappalli (India), 2011.
[2] The Flexible Bus System Using Zigbee as a Communication Medium, Razi Iqbal, Yukimatsu, Tatsuya Ichikawa, Akita(Japan), 2011.
[3] Cytron Technologies [Online] Viewed 2011 September 20. Available: http://www.cytron.com