M.R. Yaacob1,*, T.W. Loon1 and N.S.N. Anwar1 1Faculty of Electrical, UTeM
*Corresponding email: [email protected]
Abstract
This paper presents a study on the effect of reflective objects with different colors to the output voltage-distance characteristics of Sharp GP2D120 IR Sensor, which operates by employing the principle of single point triangulation. The study was conducted by using plastic materials with four different colors, in which the distance for each of them was measured by a Sharp GP2D120 IR Sensor mounted on a constructed experimental setup. The results obtained shows the output-voltage-distance characteristics which indicates that; a white color object is having the highest level of reflectivity, followed by gray, transparent and black color objects.
1. INTRODUCTION
In the development of industrial field, the importance of measuring the short distance to the surface of measured objects is significantly increasing, especially to the surface that needs no physical touch. This is because a non-contact measurement system provides the benefits in the sense of lower inspection cost as well as minimum inspection time.
There are various types of surface object that might be involved in such kind of measurement. The one that could be very common are the objects having different colors which demand a proper study on how does each of them affects the output voltage-distance characteristic. This is because different object’s color is said to be having different level of reflectivity.
Previous researches have been done which employ the principle of optical triangulation in measuring the distance of non-contact objects. Researchers from Dresden Technical University have come out with their research project regarding height measurements on water surfaces using the optical triangulation method [1]. This paper highlights the mirror-like reflection properties of clear water but no study was done on the reflectivity of objects with different colors.
Another research was done by researchers from Tata Steel, Kolkata which employed the optical triangulation method to measure distances and orientations of objects and surfaces [2]. The results of
this experiment provide the thickness value of floppy disks which were stacked onto each other. However the floppy disk used came only in one color. The effect of different colors on reflectivity was not being investigated. Anyhow, these researches still proved that the principle of optical triangulation is valid to be used as one of the non-contact methods for distance measurement of an object.
Based on these observations, a study needs to be done to investigate the effect of reflective objects with different colors to the output-voltage-distance characteristics, when applying the optical triangulation method. Hence, this study was done to provide a better understanding for industrial people in term of explaining on any misbehavior that occurs during the distance measurement of objects in industry, due to different level of reflectivity.
In Section 2, we will further discuss on the single point optical triangulation principle which was employed by the Sharp GP2D120 IR Sensor for the distance measurement. Section 3 describes the experimental setup used for the measurement and finally in Section 4, we discuss the results obtained from the experiment.
2. MEASURING PRINCIPLE
Effect of Reflective Objects of Different Colors to
the Output Voltage-Distance Characteristics of
I. Single Point Optical Triangulation
Single point optical triangulation is an easy method of measuring distances to objects without touching them and requires little operator knowledge or supervision [3]. It can detect the measured object and provide the information quickly and easily, due to its high accuracy in a short distance range. Thus, the time delay during receiving and transmission of the sensor’s signal can be reduced.
In a complete single optical triangulation system, there are a light source, a lens for light transmission and a linear light sensitive sensor for receiving the light source transmission and produce output signal analysis. The geometry of its operating principle is illustrated in Fig. 1.
Fig. 1 Geometry of Single Point Optical Triangulation
When a light source illuminates a point on an object, an image of this light spot is formed on the sensor surface. As the object moved, the image will also move along the sensor. As long as the baseline length and angles are known, the distance of the object from the instrument can be determined by measuring the location of the light spot image.
II. Infrared Light
Our eyes let us to distinguish the light of different wavelength as different colors when we see something by visible light. The shortest wavelength appears as violet while the longest wavelengths appear as red. Since infrared has a longer wavelength (a longer frequency) than that of red light, the term infrared is then originated through this scientific fact.
The primary source of infrared radiation is heat or thermal radiation. Therefore any object which has a temperature will radiate in the infrared. Even objects that we might think of as being very cold, such as an
ice cube, emit infrared. This is due to the fact that, when an object is not hot enough to radiate visible light, it will emit most of its energy in the infrared region. The warmer the object, the more infrared radiation it emits.
It is well known that infrared is just like visible light since it has the same properties as visible light. Therefore infrared can be focused and reflected like a visible light. It can also be “aligned” like regular light and therefore polarized. With this significance advantage, infrared can be the most preferred type of light source to be used in the experiment of distance measurement with single optical triangulation method.
III. Sharp GP2D120 IR Sensor
Generally there are two types of sensors available to be used with optical triangulation method, which are Charge Coupled Device (CCD) and Position Sensitive Detector (PSD). However, it is more preferable to choose PSD since it provides an analogue output which makes the measurement to be done easier compared to the digital output provided by the CCD [3].
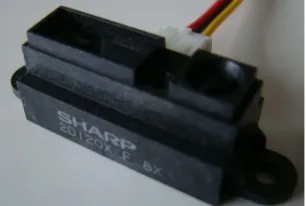
Sharp GP2D120 is one of many transceivers that are listed under PSD. It measures analog voltage as the object reflects back the beam transmitted by the transceiver [4]. The outer view of GP2D120 IR Sensor is shown in Fig. 2. This sensor is working with infrared radiation and giving a distance functional to the measured output voltage levels. The range of detecting distance for this sensor is 4 to 30cm [5]. It is equipped with a cable made of three wires; each for voltage, mass and signal supplies.
Fig. 2 Outer view of Sharp GP2D120 IR Sensor
3. EXPERIMENTAL SETUP
The objective of this experiment is to measure the output voltage given by the sensor for the objects located at different position away from the sensor. In order to do that, a mechanical hardware setup was built up to allow measurements at different object’s position to be done in a practical way.
The basis of the setup must be able to hold the object in stationary and also to move the object without interrupting the direction of detection from the sensor. In addition, the reflective direction of the object must
be in parallel with the center of emitter or the center of sensor’s detection. The 3D view design of the hardware is illustrated in Fig. 3.
Fig. 3 3D view design of mechanical hardware setup
In the earlier stage of the hardware setup, few steps were taken into considerations such as the dimension and the type of materials to be used and also the mechanical features. Wood was chosen to be used for the entire development of the hardware setup. The sensor holder was made of a wooden block with a higher thickness compared to the base. It was measured to suit the length and width of the sensor. Meanwhile the track for the object to move during measurement was designed using two pieces of aluminum curtain track.
All the dimensions used for the hardware setup were chosen based on the size and feature of the Sharp GP2D120 Sensor. The object holder was made by combining two pieces of wooden plate with a thickness of 0.5cm only, since the sliding area of the track curtain can only accept the entering of 0.5cm width materials. The length of the object holder represents the gap between the two tracks, while the gap between transmitter and receiver of the sensor is approximately 3 to 4cm. Hence the detection range of the sensor can be still obtainable.
Fig. 4 shows the complete version of mechanical hardware setup, where the sensor was held by two screws on the wooden block to maintain its stability in stationary position.
Fig. 4 Complete mechanical hardware setup
The sensor was extended by a distance of 1.5cm in order to be compatible with the object holder, since the object will be placed on the center of the holder with a gap of 3cm from the front edge of the holder. Therefore the sensor will be able to measure the object’s distance starting from a zero point. An ink liner was used to substitute the operation of the moving object by controlling the movement of the
object using the string which is controlled by the handle of the ink liner.
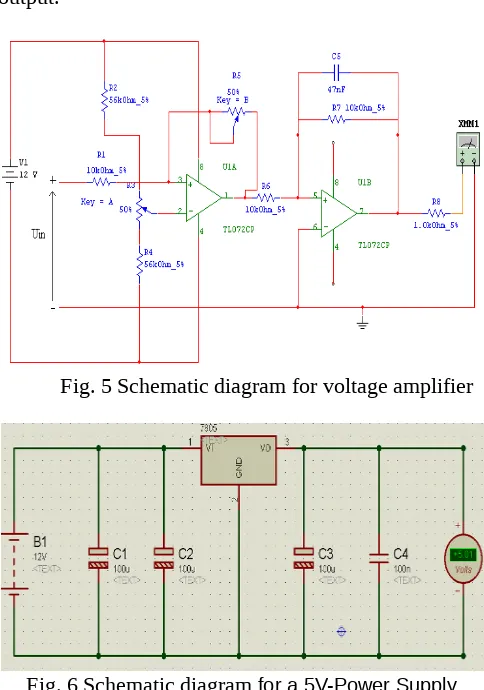
During the measurement, the sensor was used together with a voltage amplifier as depicted in Fig. 5. The task of this amplifier was to amplify an input voltage from the sensor to the output voltage in the range of 0 to 5V. The amplifier used 12V voltage source as the power supply. However some electronic components require a 5V voltage source as the power supply. For this purpose, voltage regulator was used as depicted in Fig. 6, providing a 5V stable voltage at the output.
Fig. 5 Schematic diagram for voltage amplifier
Fig. 6 Schematic diagram for a 5V-Power Supply
The whole experimental setup for this experiment is shown is Fig. 7 which consists of the mechanical hardware setup and also voltage regulator and amplifier circuit boards. Voltage readings can be obtained from the amplifier circuit using a voltmeter after being amplified into output voltage of range 0 to 5V.
Fig. 7 Whole experimental setup
The experiment was then conducted with the
existence of visible light and in a condition in which, the experimental setup was in a static position in order to prevent any error in the deflection. In addition, the experiment was also conducted on a flat and smooth surface area for accurate data readings.
4. RESULTS AND ANALYSIS
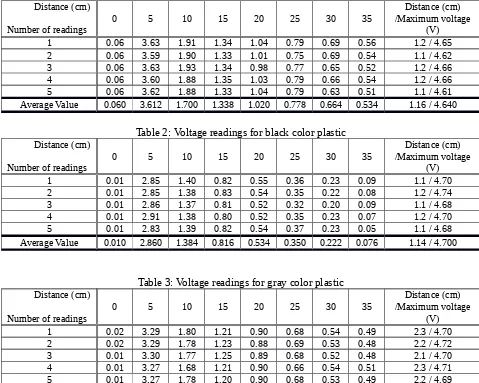
In this experiment, there were four objects made of the same material (plastic) but each of them came in different colors which are white, black, gray and transparent.. Measurement was conducted by measuring the output voltage of the sensor when the object was located in different position from the sensor. The readings taken for each object were repeated for five times to obtain the average value of readings. The average readings were then tabulated into Table 1, Table 2, Table 3 and Table 4.
Table 1: Voltage readings for white color plastic
Distance (cm)
Number of readings
0 5 10 15 20 25 30 35 /Maximum voltageDistance (cm) (V) 1 0.06 3.63 1.91 1.34 1.04 0.79 0.69 0.56 1.2 / 4.65 2 0.06 3.59 1.90 1.33 1.01 0.75 0.69 0.54 1.1 / 4.62 3 0.06 3.63 1.93 1.34 0.98 0.77 0.65 0.52 1.2 / 4.66 4 0.06 3.60 1.88 1.35 1.03 0.79 0.66 0.54 1.2 / 4.66 5 0.06 3.62 1.88 1.33 1.04 0.79 0.63 0.51 1.1 / 4.61 Average Value 0.060 3.612 1.700 1.338 1.020 0.778 0.664 0.534 1.16 / 4.640
Table 2: Voltage readings for black color plastic
Distance (cm)
Number of readings 0 5 10 15 20 25 30 35
Distance (cm) /Maximum voltage
(V) 1 0.01 2.85 1.40 0.82 0.55 0.36 0.23 0.09 1.1 / 4.70 2 0.01 2.85 1.38 0.83 0.54 0.35 0.22 0.08 1.2 / 4.74 3 0.01 2.86 1.37 0.81 0.52 0.32 0.20 0.09 1.1 / 4.68 4 0.01 2.91 1.38 0.80 0.52 0.35 0.23 0.07 1.2 / 4.70 5 0.01 2.83 1.39 0.82 0.54 0.37 0.23 0.05 1.1 / 4.68 Average Value 0.010 2.860 1.384 0.816 0.534 0.350 0.222 0.076 1.14 / 4.700
Table 3: Voltage readings for gray color plastic
Distance (cm)
Number of readings 0 5 10 15 20 25 30 35
Distance (cm) /Maximum voltage
(V) 1 0.02 3.29 1.80 1.21 0.90 0.68 0.54 0.49 2.3 / 4.70 2 0.02 3.29 1.78 1.23 0.88 0.69 0.53 0.48 2.2 / 4.72 3 0.01 3.30 1.77 1.25 0.89 0.68 0.52 0.48 2.1 / 4.70 4 0.01 3.27 1.68 1.21 0.90 0.66 0.54 0.51 2.3 / 4.71 5 0.01 3.27 1.78 1.20 0.90 0.68 0.53 0.49 2.2 / 4.69 Average Value 0.014 3.284 1.762 1.220 0.894 0.678 0.532 0.490 2.22 / 4.704
Distance (cm)
Number of readings
0 5 10 15 20 25 30 35 /Maximum voltageDistance (cm) (V) 1 0.01 2.91 1.68 1.12 0.81 0.65 0.53 0.38 1.5 / 4.50 2 0.01 2.90 1.68 1.12 0.80 0.66 0.52 0.35 1.4 / 4.48 3 0.00 2.88 1.66 1.11 0.83 0.65 0.53 0.37 1.5 / 4.52 4 0.01 2.90 1.67 1.09 0.78 0.61 0.50 0.35 1.5 / 4.52 5 0.01 2.90 1.66 1.12 0.80 0.63 0.51 0.33 1.5 / 4.51 Average Value 0.008 2.898 1.670 1.112 0.804 0.640 0.518 0.356 1.48 / 4.506
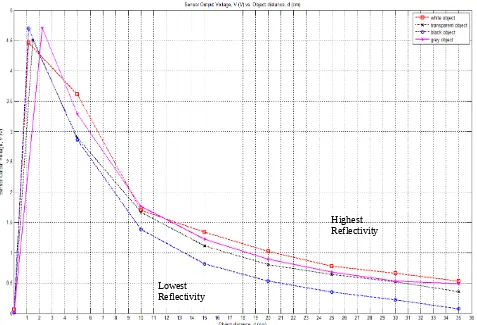
The average values obtained from each object measurement were then tabulated into an overall table as shown in Table 5. The readings obtained as in Table 5 were plotted into a graph of voltages versus distance as illustrated in Fig. 8, which represents the output voltage-distance characteristic of Sharp GP2D120 Sensor for reflective objects.
Table 5: Average voltage readings for reflective object measurement
Distance (cm)
Objects measured
0
5
10
15
20
25
30
35
Distance (cm) / Peak voltage
(V)
White color plastic
0.060 3.612 1.700 1.338 1.020 0.778 0.664 0.534 1.16 / 4.460Transparent plastic
0.008 2.898 1.670 1.112 0.804 0.640 0.518 0.356 1.48 / 4.506Black color plastic
0.010 2.860 1.384 0.816 0.534 0.350 0.222 0.076 1.14 / 4.700Grey color plastic
0.014 3.284 1.762 1.220 0.894 0.678 0.532 0.490 2.22 / 4.704Fig. 8 Output voltage-distance characteristic of Sharp GP2D120 Sensor for reflective objects
For each of the curve characteristics, there is a sudden increase in term of output voltage from the origin
before having a smooth decrease starting from the point where the distance to the reflective object is at
Highest Reflectivity
approximately 4cm. This observation is actually agreed with one of the features of Sharp GP2D120 Sensor in which, its detection range is from 4 to 30cm only. Therefore the valid output voltage-distance characteristics are conformed within the stated range only, which resulted in reciprocal curve functions. The output-voltage characteristics obtained from the reflective objects differs a lot from each other. As mentioned before, the difference among the plastic objects are the surface colors and each of the colors corresponds to the different levels of reflectivity. The level of reflectivity cannot be determined using any devices but can be proved using the plotted curves obtained from the data measurement using optical triangulation method.
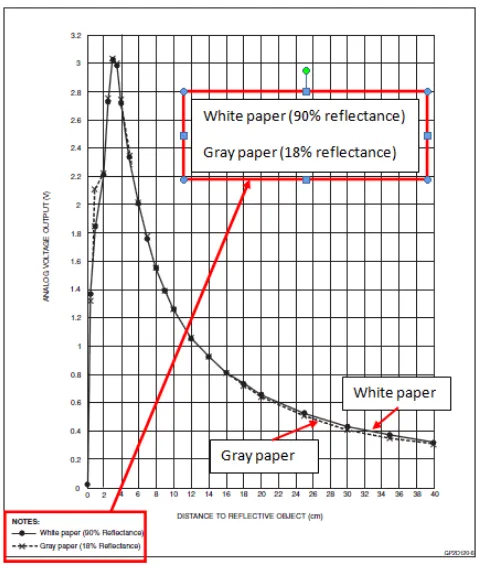
In theory, the higher the level of reflectivity the higher output voltage produced by the sensor as shown by the output voltage-distance characteristic of Sharp GP2D120 Sensor taken from the datasheet in Fig. 9.
Fig. 9 Output voltage-distance characteristics of Sharp GP2D120 taken from datasheet
From the graph plotted in Fig. 8, the highest output voltage produced by the sensor at the position of 30 cm, for instance, is the white color plastic followed by gray, transparent and black color. Therefore, white color object is said to be having the highest level of reflectivity, followed by gray, transparent and lastly, black color. This statement can be further clearly illustrated in Fig. 10.
Fig. 10 Level of reflectivity of difference colors
REFERENCES
[1] C. Mulsow, M. Schulze, P. Westfel, 2006: An optical triangulation method for height measurements on instationary water surfaces, IAPRS Volume XXXVI, Part 5
[2] Kumar, S., Tiwari, P.K., Chaudhury, S.B., 2007: An optical triangulation method for non-contact profile measurement, Industrial Technology, 2006. ICIT 2006. (IEEE International Conference) [3] Technical Brief - Single point optical triangulation, Optical Metrology Center
[4] Vashishtha Kadchhu, 2007: Infrared Proximity Sensors Application Note
[5] Sharp GP2D120 Datasheet
