UNIVERSITI TEKNIKAL MALAYSIA MELAKA
EVALUATION OF CMM’S UNCERTAINTY BY USING EXCEL
This report submitted in accordance with requirement of the Universiti Teknikal Malaysia Melaka (UTeM) for the Bachelor Degree of Manufacturing Engineering
(Manufacturing Process) (Hons.)
by
LEM ZHI XIAN B050810280 880725235498
UNIVERSITI TEKNIKAL MALAYSIA MELAKA
BORANG PENGESAHAN STATUS LAPORAN PROJEK SARJANA MUDA
TAJUK: Evaluation of CMM’s Uncertainty by Using Excel
SESI PENGAJIAN: 2011/12 Semester 2
Saya LEM ZHI XIAN
mengaku membenarkan Laporan PSM ini disimpan di Perpustakaan Universiti Teknikal Malaysia Melaka (UTeM) dengan syarat-syarat kegunaan seperti berikut:
1. Laporan PSM adalah hak milik Universiti Teknikal Malaysia Melaka dan penulis. 2. Perpustakaan Universiti Teknikal Malaysia Melaka dibenarkan membuat salinan
untuk tujuan pengajian sahaja dengan izin penulis.
3. Perpustakaan dibenarkan membuat salinan laporan PSM ini sebagai bahan pertukaran antara institusi pengajian tinggi.
(Mengandungi maklumat TERHAD yang telah ditentukan oleh organisasi/badan di mana penyelidikan dijalankan)
Alamat Tetap:
DECLARATION
I hereby, declared this report entitled “Evaluation of CMM’s Uncertainty by Using Excel” is the results of my own research except as cited in references.
Signature : _______________________________ Author’s Name : LEM ZHI XIAN
APPROVAL
This report is submitted to the Faculty of Manufacturing Engineering of UTeM as a partial fulfillment of the requirements for the degree of Bachelor of Manufacturing Engineering (Manufacturing Process) (Hons.). The member of the supervisory is as follow:
i
ABSTRAK
ii
ABSTRACT
iii
DEDICATION
iv
ACKNOWLEDGEMENT
v
List Abbreviations, Symbols and Nomenclature xii
CHAPTER 1: INTRODUCTION 1
1.1 Background 1
1.2 Problem Statement 3
1.3 Objectives 4
1.4 Scope 4
1.5 Organization 5
CHAPTER 2: LITERATURE REVIEW 6
2.1 Coordinate Measuring Machine (CMM) 6
2.1.1 Types of CMM 7
2.1.2 Probing System 9
2.1.3 CMM Software 10
2.2 Errors in Measurement 11
2.2.1 Types of Errors 11
2.2.1.1 Systematic Errors 12
2.2.1.2 Random Errors 12
2.2.2 Sources of Errors 13
2.2.3 Errors Deduction 13
2.2.4 Sources of Errors and Calibration of CMM 14
vi
2.3.1 Sources of Uncertainty 16
2.3.1.1 Cause and Effect Diagram Method 17 2.3.1.2 List Published in ISO GUM 18
2.3.2 Model of Measurement 18
2.3.3 Standard Uncertainty 19
2.3.3.1 Type A Evaluation 19
2.3.3.2 Type B Evaluation 19
2.3.4 Combined Standard Uncertainty 22
2.3.5 Expanded Uncertainty 22
2.3.6 Coverage Factor 23
2.3.7 Uncertainty in CMM Measurement 23
2.4 Data Analysis Tool – Excel 26
2.5 Summary 26
CHAPTER 3: METHODOLOGY 27
3.1 Overview 27
3.2 Planning Experiment 29
3.2.1 Tools and Equipments 29
3.2.1.1 CMM (Carl Zeiss Contura G2) 29 3.2.1.2 Touch Probe (Renishaw TP20) 30 3.2.1.3 Stylus Kit (Carl Zeiss Stylus Kit B) 30 3.2.1.4 Calibration Artefact (Ceramic Sphere) 31
3.2.1.5 CMM Software (Calypso) 31
3.2.2 Parameters and Variables 31
3.3 Designing Experiment 32
3.4 Conducting Experiment 35
3.4.1 Calibration of Stylus System 35
3.4.2 Data Collection 37
3.4.3 Construction of Uncertainty Evaluation Tool 39
3.5 Evaluation of CMM’s Uncertainty 45
3.6 Conforming Predicted Result 47
vii
CHAPTER 4: RESULT AND DISCUSSION 48
4.1 Overview of Data Collection 48
4.2 Sources of Errors 49
4.2.1 Stylus Length 50
4.2.2 Ball Diameter 51
4.2.3 Travel Speed 52
4.3 CMM’s Uncertainty Assessment 53
4.3.1 Standard Uncertainty 54
4.3.2 Combined uncertainty 55
4.3.3 Expanded Uncertainty 55
4.3.4 Result of CMM’s Measurement Uncertainty 56
4.4 Discussion 59
4.5 Summary 62
CHAPTER 5: CONCLUSION AND RECOMMENDATION 63
5.1 Conclusion 63
5.2 Recommendations for Future Study 65
REFERENCES 66
APPENDICES
A Gantt Chart of PSM I B Gantt Chart of PSM II
C Data Collection for CMM Measurements
D1-D3 Scattering Graph of Measurement Errors Measured by Various Stylus Length
E1-E3 Scattering Graph of Measurement Errors Measured by Various Ball Diameter
F1-F3 Scattering Graph of Measurement Errors Measured by Various Travel Speed G Qualification of Stylus System (S value)
H1-H9 CMM Measurement Uncertainty Budgets
viii
2.1 Classification of CMMs 8
2.2 Possible Sources of Uncertainty in the CMM Measurement 25
3.1 The Parameters and Variables Designed in This Study 31 3.2 33 Factorial Design and Experimental Runs 33
3.3 Table of the Measurement of Artefact Carried Out by Each Individual Experiment
34
3.4 Steps of evaluate CMM’s uncertainty by using Excel 45
4.1 Average errors of measurement at different stylus lengths. 51 4.2 Average errors of experiments at different ball diameter 52 4.3 Results of Experiments with different travel speed 52 4.4 Results of CMM’s measurement uncertainty 57
ix
2.1 The Basic Structure Of CMM 7
2.2 Basic Principle Of Touch Triggers Probe System 9 2.3 Effects Of Random And Systematic Errors On Measurement
Readings
12
2.4 The Artefacts For CMM Calibration (Ball Bar) And Probe Calibration (Sphere Ball)
15
2.5 The Steps Of Measurement Errors Enter Into The Measurement Result And Measurement Uncertainty
15
2.6 Example Of Cause And Effect Diagram Of Determine Measurement Uncertainty
17
2.7 Graph Of Normal Distribution 20
2.8 Graph Of Rectangular Distribution 21
2.9 Graph Of Triangular Distribution 21
2.10 Schematic Of The Various Factors Affecting CMM Measurement 23 2.11 Dimension Of Probe System That Influenced Performance Of CMM 24
3.1 Flow Chart Of Overall Project 28
3.2 Model Of CMM Used (Carl Zeiss Contura G2) 29 3.3 Model of Touch Probe Used (Renishaw TP20) 30
3.4 Carl Zeiss Stylus Kit B 30
3.5 Calibration Artefact (Ceramic Sphere) 31
3.6 Example of Design of Evaluation Tool For Uncertainty 32
3.7 Ceramic sphere at preference 36
3.8 Stylus system is clicked for the qualification of stylus 36 3.9 Ref. sphere position is clicked to quantify the ceramic sphere 36 3.10 Reference ball angle is identified by clicking the picture 1 37 3.11 S value which is standard deviation of stylus system is checked 37
3.12 New file of measurement is created 38
x 3.14 Measurement of artefact is run according the parameters planned 38 3.15 Home page is created to show the content and steps involved in
evaluation of CMM’s uncertainty
39
3.16 Sheet of “Data Collection” 40
3.17 Standard uncertainty can be calculated by clicking on the type of uncertainty
40
3.18 Sheet of Type A standard uncertainty 41
3.19 Equation inserted to evaluate Type A standard uncertainty 41
3.20 Sheet of Type B standard uncertainty 42
3.21 Evaluation of standard uncertainty for normal distribution 42 3.22 Evaluation of standard uncertainty for rectangular distribution 42 3.23 Evaluation of standard uncertainty for triangular distribution 42 3.24 Sheet of combined uncertainty evaluation 43 3.25 The formula of combined uncertainty was inserted in the cell 43
3.26 Sheet of expanded uncertainty 44
3.27 The formula of expanded uncertainty was inserted in the cell 44 3.28 Sheet of the result which expressed the result and uncertainty
budget of the measurement
44
4.1 Data collection of the measurement 49
4.2 Measurement errors for each experiment run 50 4.3 Measurement errors at different stylus length 51 4.4 Measurement errors at different ball diameter 52 4.5 Measurement errors at different approaching speed 53 4.6 Type A standard uncertainty evaluation in Excel 54 4.7 Combined uncertainty evaluation in evaluation tool created 55 4.8 Expanded uncertainty evaluation in evaluation tool created 55 4.9 Result expressed in the spreadsheet constructed 56
4.10 Uncertainty of measurement 56
4.11 Measurement values were scattered within the specification in experiment 7
xi 4.12 Measurement values were scattered within the specification in
experiment 8
58
4.13 Measurement values were scattered outside the specification in experiment 5
59
4.14 Measurement values were scattered outside the specification in experiment 6
59
xii AMC - Advance Machining Centre
ANSI - American National Standards Institute ASME - American Society of Mechanical Engineers CAD - Computer Aided Drawing
CMM - Coordinate Measuring Machine DOE - Design of Experiment
GUM - Guide to the expression of Uncertainty Measurement ISO - International Organization for Standardization JCGM - Joint Committee for Guides in Metrology MPK - Mesin Pengukur Kordinat
NIST - National Institute of Standards and Technology PSM - Project Sarjana Muda
RSS - Root Sum of the Square SPC - Statistical Process Control
TP - Touch Probe
UTeM - Universiti Teknikal Malaysia Melaka
VIM - International Vocabulary of basic and general terms in Metrology
1
CHAPTER 1
INTRODUCTION
This chapter presents the general introduction of the project. The problem statement, objectives and scope of the study are identified in this chapter. Briefly to say, this project is carried out to create an evaluation tool by using Excel for the evaluation of uncertainty in Coordinate Measuring Machine (CMM) measurement. The Guide to the expression of Uncertainty in Measurement (GUM) is used in this study. The factors that contribute to the uncertainty of measurement are studied in this project as well. Last but not least, the overview of this study is summarized in the end of chapter.
1.1 Background
Measurement is one of the procedures that essential in wide range of areas such as the fields on nuclear, space, electronics, manufacturing industries and so on. Measurement is known as a process that performed to determine the value of a physical quantity with assist of measuring instrument. However, it is impossible to obtain the ideal value of measurement because of the presence of uncertainties.
2 Uncertainty of measurement is to be anticipated in the result of a measurement. It can be taken part in the calibration, test or tolerance of any products. Careful measurement with properly identified and quantified uncertainties could lead to a high quality of product and improve the safety margins in such system. Therefore, the better way is set an interval to the final outcome when the measurement is made. Interval here meant that the range inside the desired value lies.
According to Fornaisini (2008), physical quantity of measurement is generally quoted as
X = X0 ± δX (1.1)
Where X0 is the true value of measurement
δX is the uncertainty due to the display resolution.
Since there no measurement is exact, thus, the measurement taken by using CMM is also no exception. CMM is the machine that created to measure the dimension of the part with three dimensional spaces. According to the CMM’s manufacturers, this machine is playing the important role in nearly all of the industry because it can be used for dimensional measurement, profile measurement, angularity or orientation measurement, depth mapping, digitizing or imaging and shaft measurement. CMM uses a probe to measure points on a part. Each point on the workpiece is unique to the machine’s coordinate system. With the supporting of software and hardware of CMM system, the product dimension can be easily measured but it is not including the error and uncertainty of measurement made. Since Fornaisini (2008) told that uncertainty can be caused by many different factors which cannot be reduced by the instrument characteristics, it is better to understand the measurement process and determine the factors that may influence the measurement.
3 consistent, transferable, and readily provide the level of confidence that corresponds in a realistic way with that required.
This project is focused on the making use of Excel to evaluate the uncertainty of measurement by determining the values of mean, standard deviation, degree of freedom and uncertainties in CMM measurement. Excel is known as the spreadsheet that can be used for storing, organizing and manipulating data. Microsoft Office Corporation (2011) stated that Excel Calculation Services is one of the basic components of Excel Service which can load the workbook, calculate and revive the data. Excel is not only can be used to store the data, but it also provides the built-in functions to perform the same calculations multiple times by using different input values, reuse the calculations in another program without retype it and allocate a simple task to make the complex program to be easily understood (Larsen, 2009).
1.2 Problem Statement
In general, the uncertainty measurement can be evaluated by manual or software programs. However, evaluating uncertainty of measurement by manual is not an easy task. The equations for uncertainty of measurement are complex to be memorized and complicated to be calculated as well. Yet, in this modern world, there is a number of software programs have been implemented to provide the needs of evaluation on measurement uncertainty. “Uncertainty Calculator” by Chris Grachanen is one of the software programs that may download from the website (Agilent Technologies, 2004). However, most of these software programs are uncommon to all users. The users are sometimes required to purchase for the software. Apart from that, users need spend more time to learn and understand the program as well. Also, the programs sometimes need support by other software with the specific programming language.
4 basic knowledge in Excel. The evaluation tool created is to make sure users friendly and allow users to evaluate the CMM’s uncertainty with a systematically method which is standardized. Besides that, invention of this evaluation tool with Excel application is easy to use as it has shorten the learning time of user. As a result, the uncertainty in measurement can be evaluated with low cost, short time and accurate result.
To accomplish the project, CMM is used as the measuring instrument to carry out the measurement of artefact (ceramic sphere). The measurement of artefact is carried out by using different variables. Then, the data is collected and the uncertainty of measurement is evaluated in accordance with GUM by using Excel.
1.3 Objectives
The objectives of this project are:
To study and understand the method of evaluation for CMM’s uncertainty.
To identify the factors those cause uncertainty in CMM measurements.
To set up an evaluation tool for the purpose of evaluate the uncertainty in CMM measurement.
1.4 Scope
5
1.5 Organization
6
CHAPTER 2
LITERATURE REVIEW
This chapter basically presents the literature reviews of topics related to the project title. First of all, the general introduction of coordinate measuring machine (CMM) is presented which including the types of CMM, CMM probing system and CMM software. Next, the errors and uncertainties which always influenced the measurement accuracy are explained as well. Sources of errors and uncertainties of CMM are then further described in this chapter. Apart from that, the general introduction of the tool that used to evaluate CMM uncertainty which is Excel is presented. Finally, a brief summary of the literature reviewed is provided in this chapter as well.
2.1 Coordinate Measuring Machine (CMM)
CMM is one of the important tools for post-process inspection of products and check the dimension in a variety of process tooling in the manufacturing industry. CMMs are widely used in order to ensure dimensional quality of products exactly meet the customers’ requirements. Benbow et al. (2003) stated that CMMs are widely used because the flexibility and speed of CMMs to measure the dimensional characteristics of many products. Comparing with CMM, the conventional equipment may take longer time and more procedures for the similar measurement.
7 Cartesian coordinates. Besides that, CMMs are used to measure the part by single point probing or scanning. The data are collected continuously when the stylus tip is in contact with the single points of surface or dragged across the surface.
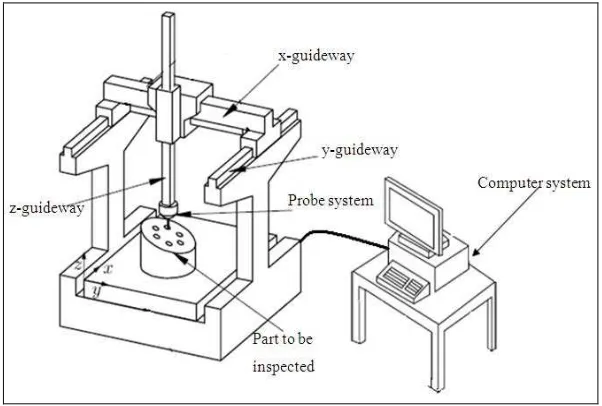
CMMs can be either function with manual or automatic mode. In manual mode, the machine is operated by user. However, in automatic mode, the CMM is actuated by electric devices and driven by a CNC controller (Zhao et al., 2011). CMMs are typically able to readout and analyse the distances of the part being measured with the interface between the CMM three linear axes guide ways (x, y, and z axes), CMM probing system and CMM software. As an example, Figure 2.1 is about the basic design of a CMM.
Figure 2.1: The basic structure of CMM.
2.1.1 Types of CMM
8
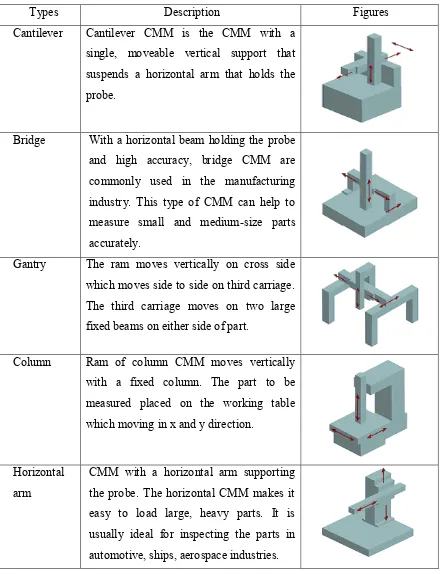
Table 2.1: Classification of CMMs (Leach, 2009 and Tooling University LLC, 2011).
Types Description Figures
Cantilever Cantilever CMM is the CMM with a single, moveable vertical support that suspends a horizontal arm that holds the probe.
Bridge With a horizontal beam holding the probe and high accuracy, bridge CMM are commonly used in the manufacturing industry. This type of CMM can help to measure small and medium-size parts accurately.
Gantry The ram moves vertically on cross side which moves side to side on third carriage. The third carriage moves on two large fixed beams on either side of part.
Column Ram of column CMM moves vertically with a fixed column. The part to be measured placed on the working table which moving in x and y direction.