ii
I hereby declare that I have read through this report entitle “Comparison on Data Driven Algorithms to Maintain Color Constancy in Industrial Camera for High Intensity Environment” and found that it has comply the partial fulfillment for awarding the degree of
Bachelor of Mechatronics with Honors
Signature:………..
iii
COMPARISON ON DATA DRIVEN ALGORITHMS TO MAINTAIN COLOR CONSTANCY IN INDUSTRIAL CAMERA FOR HIGH INTENSITY
ENVIRONMENT
ABDUL RAHMAN B ABDUL GHANI
A progress report submitted in partial fulfillment of the requirement for the degree of Mechatronics Engineering
Faculty of Electrical Engineering
UNIVERSITI TEKNIKAL MALAYSIA MELAKA
iv
I declare that this report entitle “Comparison on Data Driven Algorithms to Maintain Color Constancy in Industrial Camera for High Intensity Environment” is the result of my own research except as cited in the references. The report has not been accepted for any degree and
is not concurrently submitted in candidature of any other degree
Signature:………..
v
ACKNOWLEDGEMENT
First and foremost, I would like to express my deepest gratitude to my supervisor, Pn. Nurdiana bt Nordin @Musa for the guidance, enthusiasm and motivation given throughout the progress of the project of the comparison on data driven algorithms to maintain color constancy in CCTV camera for high intensity environment. She has been motivating and inspired me to successfully complete my project. Her guidance, advice, encouragement, patient and support given throughout this project are greatly appreciated.
I would also like to thank my parents for always be there to support me all the time and give me the courage and strength that are necessary for me to carry on with this project. Thanks for their encouragement, love and emotional support that they had given to me.
I would also like to thank my friend who had given me the advice, courage and support in completing this progress report. Their views and tips are very useful.
vi
ABSTRACT
vii
ABSTRAK
viii
2.2 High Intensity Illuminant ... 19
2.3 Shadow and Highlight ... 21
2.4 Histogram ... 22
3 METHODOLOGY ... 23
3.0 Introduction ... 23
3.1 Flow diagram ... 23
3.2 Set the Equipment and Specification of the Test ... 25
3.3 Capture the Ball Image ... 25
3.4 Mask and Crop ... 29
ix
3.8.3 Root-Mean-Software Error ... 39
4 RESULT AND DISCUSSION ... 41
4.0 Result ... 41
4.0.1 500W Spotlight Light Source ... 42
4.0.2 500W Spotlight Light Source With Shadow ... 48
x
LIST OF TABLES
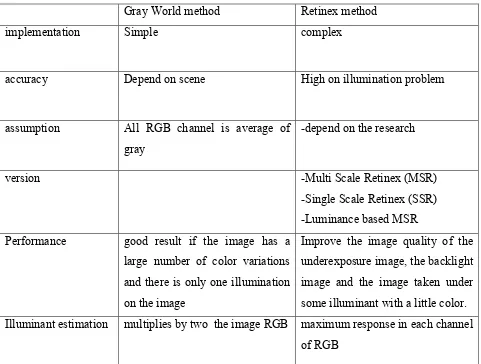
Table 1 Table of comparison of Retinex method with Gray World method ... 19
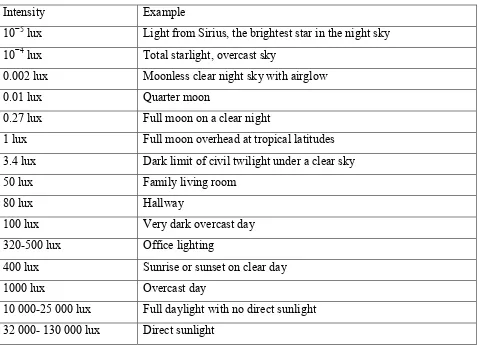
Table 2 Table of Common Lux Reading ... 20
Table 3 Table of Error of 500W Spotlight Light Source ... 54
Table 4 Table of Error of 500W Spotlight Light Source with Shadow... 55
Table 5 Table of Error of 150W Spotlight Light Source ... 56
xi
LIST OF FIGURES
Figure 1 Image of standard illuminant ... 21
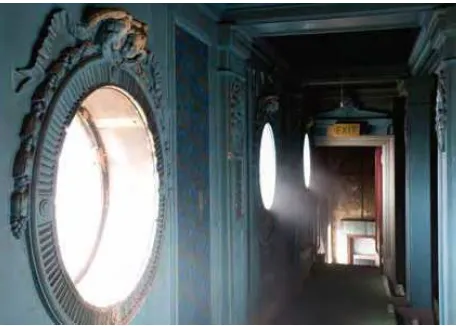
Figure 2 image of Effect of Highlight and Shadow ... 21
Figure 3 Common Histogram ... 22
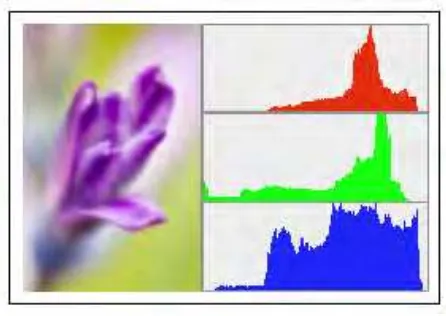
Figure 4 RGB Histogram ... 22
Figure 5 Project Flow Diagram ... 24
Figure 6 Image Acquisition Tool ... 26
Figure 7 Hardware Browser ... 27
Figure 8 Preview the Image ... 27
Figure 9 Acquisition Parameters ... 28
Figure 10 Data Exporter ... 28
Figure 17 Gray World Flow Diagram ... 33
Figure 18 Single Scale Retinex method ... 35
Figure 19 Flow Diagram of Retinex Method ... 36
Figure 20 Histogram Flow ... 38
Figure 21 Fluorescent Green ... 42
Figure 22 Fluorescent Red ... 43
Figure 23 Fluorescent Yellow ... 43
xii
Figure 25 Glossy Red ... 44
Figure 26 Glossy Yellow... 45
Figure 27 Matte Green ... 46
Figure 28 Matte Red ... 46
Figure 29 Matte Yellow ... 47
Figure 30 Fluorescent Green ... 48
Figure 31 Fluorescent Red ... 49
Figure 32 Fluorescent Yellow ... 49
Figure 33 Glossy Green... 50
Figure 34 Glossy Red ... 50
Figure 35 Glossy Yellow... 51
Figure 36 Matte Green ... 52
Figure 37 Matte Red ... 52
Figure 38 Matte Yellow ... 53
Figure 39 Pie Chart of Angular Error ... 58
Figure 40 Pie Chart of Euclidean Error ... 58
xiii
LIST OF APPENDIX
1. K-Chart
2. Matlab Codes
14
1
INTRODUCTION
1.0 Problem Statement
15
1.1 Objective
1) To compare the reduction highlights on directly illuminated object in the industrial
camera image by using Gray World method and Retinex method.
2) To compare the reduction of the shadows on the obstructed object in the industrial
camera image by using Gray World method and Retinex method.
3) To compare the performance of Gray World and Retinex method in retaining the colour
constancy of the image using histograms and colour quantization and correlation.
1.2 Scope
1) The benchmark of intensity in normal intensity environment is 500 Lux
2) The condition of high intensity environment is equal or greater than 5000 Lux
3) Comparison only using two data driven algorithms which is Retinex and gray world.
16
2
LITERATURE REVIEW
2.0 Introduction
This study is done to ensure that this project run smoothly while achieving the objectives of this project. In this section, it will explain the concepts, methods use and the person who created the algorithms. Each of these researches has their own pros and cons. The algorithms will be compared to obtain the best color constancy of the image.
2.1 Color Constancy
Color constancy is defined as the constancy of the perceived color of surfaces under changes in the intensity and spectral composition of the illumination [5]. Light is reflected from an object or scene under a fix power at their own wavelength which is known as surface spectral reflectance [2]. Every surface of object has a different in how they absorb or reflect the light. In general, the reflection is depending on wavelength, the angle of the incident light and the angle of the reflected light [3]. There are three variables that need to be taken as the function of color image and the mathematical equation is representing as;
17 Where �(�,�,�) is the surface reflectance,�(�) is the illumination property, ��(�) is the sensor
characteristic, � is the wavelength and � is the visible spectrum. From the equation, V. Agarwal
[13], has concluded that the assumption can be categorized by three types which are assumption of surface reflectance, assumption of the sensor and assumption of the illumination.
Color constancy method is aimed to decrease the effect of the illuminant variation on an image to obtain the most precise color of the image true color [6]. From V Agarwal [13], the color constancy algorithms can be classified into two groups which are Pre-Calibrated approaches and Data-driven approaches. There are many algorithms of Data-driven approaches but only 2 algorithms will be reviewed which are gray world method and Retinex method.
Gray world method is the earliest and the simpler technique of data driven algorithms compare to the others data driven approaches. V. Agarwal [13], presented that the gray world method is based on the assumption that each color on every sensor channel is an average of gray to the entire image. P. Aurora [11], however concluded that this method will produce a good result if the image has a large number of color variations and there is only one illumination on the image. Besides that, the color will be biased by the large color group in the image.
Retinex method on the other hand had been introduced by E.Land [4] based on the study of human vision. This method assumes that the small variation in image scene is due to the illuminant variation and big variation is due to changes in the surface while the light variation is removed. J. Bai [8], stated that Retinex method had produce a good result compare to the other method because it can improve the image quality of the underexposed image, the backlight image and the image taken under some illuminant with a little color.
18 database. In real image experiment, he assumes that the illuminant is constant across the scene and the optical effect of the camera will be ignored. Other assumption concerns on the illuminant chromaticity, diversity, surface and the illuminant that may be encountered. For grey world method, in the real image and synthetic data experiments, the multiplition of the image RGB with two is done for the illuminant. For the Retinex method, in the real image and synthetic data experiments, the illuminant is estimated by using the maximum response in each channel of RGB.
A. Gijsenij [1], focuses on the estimation of the illumination color specifically the estimation of the illuminant using a single image from a regular digital camera for this research. The first step of this method is correcting the chromaticity of the light source by estimating the color of the light source then transforms the original image value using the estimated illuminant. The important criteria for computational color constancy algorithms are the requirement of training data, the accuracy of the estimation, the computational runtime of the method, the transparency of the approach, the complexity of the implementation and the number of tunable parameters. Two types of data are used for this experiment which is hyperspectral data and RGB image.
K. Barnard [10], compared the result of color constancy methods. It is shown that the illuminant estimated angular error of gray world method produced a fair error and the retinex method produce a lower error. K. Barnard [9], The result shows that the illuminant estimated angular error of gray world method is fair compare to the other color constancy method and the Retinex method had produce low illuminant estimate angular error. For A. Gijsenij [1], the angular error is depend on the scene of the image whether high or average.
19 show that the proposed color metric based on S_CIELAB was effective to evaluate the image produced by Retinex method.
Gray World method Retinex method
implementation Simple complex
accuracy Depend on scene High on illumination problem
assumption All RGB channel is average of
gray
-depend on the research
version -Multi Scale Retinex (MSR)
-Single Scale Retinex (SSR) -Luminance based MSR
Performance good result if the image has a
large number of color variations and there is only one illumination on the image
Improve the image quality of the underexposure image, the backlight image and the image taken under some illuminant with a little color. Illuminant estimation multiplies by two the image RGB maximum response in each channel
of RGB
Table 1 Table of comparison of Retinex method with Gray World method
20 In color constancy, illuminant is one of the variables that very important and need to be measured. The SI unit for luminous intensity is lux and the symbol is lx. Table below show the common reading of lux at different scene.
Intensity Example
10−5 lux Light from Sirius, the brightest star in the night sky
10−4 lux Total starlight, overcast sky
0.002 lux Moonless clear night sky with airglow
0.01 lux Quarter moon
0.27 lux Full moon on a clear night
1 lux Full moon overhead at tropical latitudes
3.4 lux Dark limit of civil twilight under a clear sky
50 lux Family living room
80 lux Hallway
100 lux Very dark overcast day
320-500 lux Office lighting
400 lux Sunrise or sunset on clear day
1000 lux Overcast day
10 000-25 000 lux Full daylight with no direct sunlight
32 000- 130 000 lux Direct sunlight
21
2.3 Shadow and Highlight
According to S. Utochki [1], image taken at night will be different with the image taken at daylight. Image from daylight background will produce a highlight on objects that been directly illuminated by the illuminant and a strong shadow when the objects obstructed.
Figure 1 Image of standard illuminant
Figure 2 image of Effect of Highlight and Shadow
22
2.4 Histogram
J. Sachs [13], histogram is defined as graphical tools develop to visualize frequency distribution and had a specific meaning in the context of digital images. For the image histogram, it will plot the data of image pixel versus the brightness of the image. Each colour in a pixel has a value range from 0 to 255 for a 8-bit image. The example of the image histogram in gray scale is;
Figure 3 Common Histogram
In the image picture, if there is more shadow and highlight than others, the majority of distribution is located in the left hand side. For the RGB image, each channel of RGB can be shown in the individual histogram as shown below;
23
3
METHODOLOGY
3.0 Introduction
The methodology of this project will be explained in this section. It will include the step and method that will be done in order to achieve the desire result. The flow diagram will be use to show the process of methodology in order to complete these project.
3.1 Flow diagram
The flow diagram will be used to show the overall process of the project from the start to the end. It has a step by step method to be followed in order to accomplish the project.
24
25
3.2 Set the Equipment and Specification of the Test
In this project, the process of capture the image of the ball is done in a room with no outside or unwanted light source because it would affect the result of the capture ball image. The room must be dark and should only get a light source from the light than had been set in the room. All windows in that room were plastered with the black paper to prevent light from penetrating the room space. Each ball in suspension under different lighting fixture was taken by using industrial digital camera which integrates with Matlab software. The condition before capture the image of the ball is;
Conditions of light source:
There are five condition of lighting in the room when capture the image of the ball. The condition is;
• Under D-65 OSRAM daylight light source
• Under 500W spotlight light source
• Under 150W spotlight light source
• Under 500W spotlight light source with shadow
• Under OSRAM warm white light source
Condition of ball;
In this project, we use 9 type of ball. There are three type of color which is red, green and yellow and each type of color have three type of coating which is matte, fluorescent and glossy.
• Glossy red, green and yellow ball
• Fluorescent red, green and yellow ball
• Matte red, green and yellow ball